Dispersion engineering and measurement of whispering gallery mode microresonator for Kerr frequency comb generation
-
Shun Fujii
 und
Takasumi Tanabe
und
Takasumi Tanabe


Abstract
Designing and engineering microresonator dispersion are essential for generating microresonator frequency comb. Microresonator frequency combs (microcombs, Kerr frequency combs) offer the potential for various attractive applications as a new type of coherent light source that is power efficient and compact and has a high repetition rate and a broad bandwidth. They are easily driven with a continuous-wave pump laser with adequate frequency tuning; however, the resonators must have a high quality (Q) factor and suitable dispersion. The emergence of cavity enhanced four-wave mixing, which is based on third-order susceptibility in the host material, results in the generation of broadband and coherent optical frequency combs in the frequency domain equivalent to an optical pulse in the time domain. The platforms on which Kerr frequency combs can be observed have been developed, thanks to intensive efforts by many researchers over a few decades. Ultrahigh-Q whispering gallery mode (WGM) microresonators are one of the major platforms since they can be made of a wide range of material including silica glass, fluoride crystals and semiconductors. In this review, we focus on the dispersion engineering of WGM microresonators by designing the geometry of the resonators based on numerical simulation. In addition, we discuss experimental methods for measuring resonator dispersion. Finally, we describe experimental results for Kerr frequency combs where second- and higher-order dispersions influence their optical spectra.
1 Introduction
Optical frequency combs based on microresonators have attracted considerable interest in the last few decades in the micro-/nano-photonics research fields [1], [2]. Microresonator frequency combs are generated in ultrahigh-Q microresonators by a continuous-wave (CW) laser pump, thanks to Kerr nonlinearity [3], [4], and therefore, they are called Kerr frequency combs [5] or microcombs [6]. Microcombs allow us to fabricate micro or millimeter-scale devices that are much smaller than conventional frequency comb sources, and this enables us to achieve compact monolithic comb devices with low noise, a broad bandwidth, and a repetition rate in the microwave domain [7], [8], [9], [10], [11], [12]. Therefore, microresonators have the potential to be desirable platforms for massively optical communication [13], astronomical calibration [14], [15], precision spectroscopy [16], [17], light detection and ranging [18], [19], low-noise microwave generation [20], and integrated optical-frequency synthesizer [21], as well as for various nonlinear photonic applications [22], [23], [24].
In these high-Q monolithic resonators, equidistant optical sidebands are generated via cavity enhanced four-wave mixing processes based on the third-order nonlinear effect. In order to enhance the light-matter interaction inside the resonator, it is necessary to increase Q and reduce the mode volume, which are related to the required pump power [25]. The generated comb lines have an equidistant frequency spacing supported by the energy and momentum conservation process (Figure 1). However, the relative phase relation of these comb lines is not always optimized in experiments [10], [26]. The mode-locked state in which periodic optical pulses circulate inside the circumference of the resonator, which is called a dissipative Kerr soliton (DKS) [27], can be achieved by the proper operation of the pump laser [28], [29], [30], [31], [32]. This discovery made it possible to achieve a high-coherence, stable soliton microcomb, as a result of the balance between parametric gain and loss and between dispersion and nonlinearity [33]. DKSs have been successively demonstrated in a wide variety of microresonators, ranging from silica [34], silicon nitride [35], [36], silicon [37], aluminum nitride [38], and lithium niobate [39], since the first observation of DKSs in crystalline microresonators [28]. Different platforms have different advantages (e.g. Q-factor, nonlinearity, chip-integration), and many groups have already developed and proposed new materials and structures for microresonator.

Schematic of Kerr optical frequency comb generation in a WGM microresonator with a tapered fiber coupling.
With regard to the generation of soliton microcombs, considerable attention has been paid to the group-velocity dispersion (GVD) of the resonator. In general, bright solitons characterized by sech2-shaped optical spectrum require a suitable anomalous GVD in order to maintain a dissipative system [27]. Moreover, microresonator dispersion exhibits soliton dynamics with interesting features such as dark pulses [40] and dispersive waves [35].
The purpose of this article is to present an overview of microresonator dispersion engineering that is needed to generat e Kerr frequency comb. As we will discuss later, the strategy of dispersion engineering in a whispering gallery mode (WGM) resonator is different from that of wire-waveguide devices such as microrings.
The paper is organized as follows. First, in Section 2, we introduce theoretical and analytical approaches that enable us to understand microresonator dispersion, which is determined by both material and geometry. Section 3 describes a useful calculation method based on a finite-element simulation and shows the simulation results for several WGM microresonators. Following the calculation, we describe in Section 4 experimental dispersion measurement methods and a comprehensive survey. Finally, in Section 5, we report the effect of higher-order dispersion and avoided mode crossing in an optical spectrum and highlight their application.
2 Microresonator dispersion
2.1 Fundamentals of dispersion
Dispersion is one of the most important physical quantities in microresonator frequency comb generation and in ultrafast optics. When light travels the same physical path length, dispersion originates from the frequency dependence of the refractive index, which means that different frequency components experience different phase velocities (equivalent to different optical path lengths). Here, we start with a well-known fundamental dispersion relation, which gives the frequency dependence of the propagation constant β of traveling light as follows [41]:
where ω and c are angular frequency and light speed in a vacuum, respectively. The linear term β0=ω0/νp is given by the phase velocity of the center frequency νp, which also gives the effective index neff as neff=c/νp. The first-order dispersion β1 is given by group velocity νg and group index ng as
It is sometimes helpful to employ an expression in function to wavelength λ:
The group velocity is explained as the speed of the envelope of the optical pulse (wave packet). When taking the phase shift ϕ=βL into account, the spectral phase after the propagation through a dispersive medium of length L is given by Φ(ω)=ωt–βL. By substituting Eq. (1), we obtain
Here, the spectral phases of all the frequency components have constant values without being dependent on frequency at t=L/νg, which means that the pulse envelope arrives with a velocity of νg. This first-order dispersion is also used to describe group delay Tg as
which corresponds to the propagation time of a pulse through an optical medium of length L. The second-order derivative term of Eq. (1) represents the change rate in the inverse group velocity (corresponding to the group delay) in terms of frequency, namely, the group velocity dispersion (GVD) β2.
where β2 is responsible for broadening of the pulse bandwidth. Moreover, the frequency dependency of the group delay is known as group delay dispersion,
In addition to the GVD parameter β2, the parameter D is a convenient expression in fiber optics, which is given by the change of group delay Tg per unit length in function to wavelength (not frequency).
D can be described with β2 using Eq. (5) as follows:
Whether to use β2 or D to express the GVD depends on different preferences in the research community. The parameters β2 and D are usually given in units of (ps2/km) and [ps/(km·nm)], respectively, showing the opposite sign. As a result, the sign of the GVD parameters are “β2>0, D<0” for normal dispersion and “β2<0, D>0” for anomalous dispersion. Note that the above definition of normal/anomalous dispersion gives the GVD for a particular wavelength. Sometimes the wavelength dependence of the refractive index dn/dλ is also referred to as normal dispersion (dn/dλ<0) and anomalous dispersion (dn/dλ>0), whereas this definition does not coincide with GVD, and it is confusing for readers. Accordingly, in this article, we use the term “dispersion” to indicate GVD.
Optical resonators have the discrete resonance frequencies given by
where fm (=ωm/2π) is the frequency of the mth longitudinal mode with the azimuthal mode number m. Here, it should be noted that both the effective refractive index neff′ and the effective radius of the mode R′ are in function to the azimuthal mode number (frequency), which is a unique property of WGM resonators. Although R′ is usually a constant in waveguide devices, the value is frequency dependent for WGM resonators, as we will show later in Figure 4C. And this makes the dispersion engineering unique in WGM resonators. However, we usually redefine the frequency-dependent effective refractive index neff, and as such, it includes the effect of frequency dependence of the R′ because it is not easy to detect R′ (or neff′) independently in an experiment. Hence, neff is frequency dependent, whereas R is now the actual radius of WGM resonators, which is a constant.
We can derive the propagation constant of mth WGM from the resonance condition,
Consequently, the first-order dispersion
From Eq. (9), dispersion parameter
where we can use a difference approximation for the mth mode, such as Δfm=(fm+1–fm−1)/2 and Δ(Δfm)=fm+1–2fm+fm−1).
The microresonator dispersion is expressed in function to the relative position of the resonance frequencies, and it is often used for the sake of convenience. The relative mode number μ is defined as the mode index in terms of the center (pump) mode μ=0; hence, all the resonance frequencies are given in with a Taylor expansion around the center frequency:
where D1/2π is the equidistant resonator FSR, D2/2π is the second-order dispersion related to β2, and D3/2π, D4/2π, … represent the higher-order dispersion in units of (Hz) [Di is given in (rad/s)]. Consequently, the integrated dispersion Dint is given by the deviation of the resonance frequency including all the above dispersion terms from the equidistant grid D1/2π. The frequency distance between two adjacent resonant modes is called an FSR, which is the original definition. However, we see many papers defining an equidistant grid with respect to the pump mode D1/2π as an FSR. The former includes the offset induced by the dispersion, whereas the latter indicates only equal intervals. Since both terms are used to stand for “FSR,” readers need to consider this carefully in context. In this paper, we distinguish the original definition of “FSR” (i.e. longitudinal mode spacing with the effect of dispersion) from “equidistant FSR” (i.e. D1/2π).
Figure 2 is a schematic illustration of microresonator dispersion. Higher-order dispersions can be omitted depending on the case because of the relation given as D2≫D3≫D4…. Here, a positive (negative) D2 corresponds to an anomalous (normal) dispersion, and Di parameter has the relation to dispersion βi as

Resonance frequencies taking dispersion into account. The mismatch between the equidistant comb grid (black dashed line) and the resonance mode (blue) corresponds to the microresonator dispersion.
2.2 Material dispersion
Since the dispersion is derived from the deviation of the resonance frequencies of longitudinal modes, it is necessary to consider several contributions that affect the refractive indices of the resonators. Material dispersion plays an important role in the total dispersion of a resonator; hence, it can be taken into account by Sellmeier equations [42]:
where Ai and Bi are the Sellmeier coefficients and λ is wavelength in units of μm (see Table 1). Figure 3 shows material dispersion D given by Eq. (18). Table 2 shows detailed parameter values for these resonator materials. Sellmeier coefficients for other materials can be found elsewhere [43], [44].
Coefficients of Sellmeier equations in microresonator material [43].
| Material | A1 | A2 | A3 | B1 (μm) | B2 (μm) | B3 (μm) |
|---|---|---|---|---|---|---|
| SiO2 | 0.6961663 | 0.4079426 | 0.8974794 | 0.0684043 | 0.1162414 | 9.896161 |
| MgF2 | 0.48755108 | 0.39875031 | 2.3120353 | 0.04338408 | 0.09461442 | 23.793604 |
| CaF2 | 0.5675888 | 0.4710914 | 3.8484723 | 0.050263605 | 0.1003909 | 34.649040 |
| Si3N4 | 3.0249 | 40314 | 0.1353406 | 1239.842 |

Material dispersion D of various platforms: silica (SiO2), magnesium fluoride (MgF2), calcium fluoride (CaF2), and silicon nitride (Si3N4).
Comparison of resonator material properties at 1550 nm.
| n | n2 (10−20 m2/W) | D [ps/(km·nm)] | |
|---|---|---|---|
| SiO2 | 1.44 | 2.2 | 21.9 |
| MgF2 | 1.37 | 0.9 | 7.03 |
| CaF2 | 1.43 | 1.9 | 0.057 |
| Si3N4 | 1.98 | 25 | –6.57 |
2.3 Geometric dispersion
In addition to the large contribution made by material dispersion, geometric dispersion has a strong impact on total dispersion. Geometrical dispersion can be interpreted as follows: an optical mode with a different frequency experiences a different optical path in the waveguide; therefore, various parameters of the resonator geometry (i.e. resonator size, curvature size, disk thickness, and disk angle) exhibit a dispersive effect as a function of wavelength. Furthermore, it is known that different spatial modes and different polarization modes can induce additional dispersion effects with regard to geometric dispersion because WGM resonators generally have a multimode structure.
Currently, there are two calculation methods that have been developed to obtain the geometric dispersion of WGM resonators. One is an analytical approach via an approximation of the eigenfrequency of resonators [45], [46], [47]. Such an analytical expression provides an accurate calculation of the mode frequencies and field distribution for WGM resonators, and it has already been used to calculate geometric dispersion. However, this method has the geometrical limitation of resonators in which an analytical estimation is valid only for simple and symmetric geometries (i.e. spheroids and toroids). Accordingly, an alternative numerical approach with a finite-element method (FEM) simulation is widely used to derive the eigenfrequencies [48]. The simulation can be performed with commercially available software (e.g. COMSOL Multiphysics) as an eigenvalue solver of axisymmetric structures. A detailed calculation including both material and geometric dispersion is described later.
An FEM simulation reveals not only the eigenmode corresponding to the resonance frequency but also the mode field distribution. In general, transverse electric (TE) and transverse magnetic (TM) polarizations are defined as electric (magnetic) field being perpendicular to the direction of propagation. However, we employed TE (TM) mode of WGM as the parallel (orthogonal) direction of the dominant electrical field to the symmetric axis of the WGM microresonator because they cannot imposed by conventional transverse approximation [48], [49].
Figure 4 shows the meshing and the calculation result for FEM analysis. Here, we clearly determine that the optical mode approaches the inner region of the resonator (symmetric axis of resonator) when the wavelength (frequency) is increasing (decreasing). This trend corresponds to the variation in the effective resonator radius, and so we consider that the resonator FSR changes depending on the effective radius and group index [50], [51]:

Examples of mode profile simulation with FEM.
(A) Created mesh cells for axisymmetric microdisk resonator with 40° wedge angle in FEM calculation. (B) Calculated mode profile of fundamental TE and TM modes around 1550 nm. The TM mode slightly extends the outer boundary of the disk resonator. (C) Comparison of mode profiles at three different wavelengths. At longer wavelengths, the center of the optical mode is shifted inside the resonator.
The following expressions are useful if we are to understand the relationship between FSR and dispersion straightforwardly:
Here, we know that the reduction in mode radius with longer wavelength (decreasing frequency) contributes to the normal dispersion. Such reduction in the effective radius at longer wavelengths can be interpreted as one side of the geometric dispersion. On the other hand, the change in ng, which is determined by the sum of neff and the frequency-dependent variation ω(dneff/dω) defined as Eq. (2), is another side of the geometric dispersion. When the optical mode extends to the lower index area, it induces a reduction in neff (promotes normal dispersion); in contrast, a sudden change in neff leads to an overall increase in ng, and it helps to contribute anomalous dispersion.
Certainly, the effective index is associated with the change in effective radius and the penetration of the optical mode field into the air cladding. The former effect is not present in wire-waveguide devices (i.e. microring) and is unique in WGM. This makes difference between WGM resonator and microring when trying to engineer the dispersion. In a WGM resonator, it is necessary to consider these two simultaneously as mutual contributions. Nevertheless, it is possible to predict the overall microresonator dispersion by understanding the principle of the geometric dispersion of WGM microresonators. In the next section, we describe a strategy for engineering the WGM structure to realize an anomalous dispersion.
2.4 Combination of material and geometry dispersion
Both material and geometry dispersions should be taken into account to obtain the total dispersion of WGM microresonators. However, it is difficult to consider these two dispersions separately because the optical mode distribution of a WGM resonator is closely related to the refractive index of the material. Therefore, an iterative calculation is an effective way to calculate resonance frequencies (i.e. resonator dispersion) accurately. The calculation has three steps. (1) The microresonator structure and the approximate refractive index of the material are input into an FEM solver. (2) The solver gives the resonance frequency. Then, a Sellmeier equation calculates the refractive index at the frequency. These procedures are repeated several times. (3) The exact resonance frequency, which takes account of the geometrical and material dispersions, is obtained. A detailed calculation flow is shown in Figure 5. The setting of the starting value eigenfrequency of interest is important if we are to avoid an undesired mode and a failed result. Calculated results sometimes diverge due to a calculation error with the solver, and so the calculation should be repeated with a different starting frequency. A judgment algorithm that can be used to check the values is necessary for implementing a successful simulation and reducing the redundant computation time. Furthermore, the mesh size should be sufficiently fine to make it possible to obtain exact values (but there is a tradeoff against computation time). The obtained results are resonance frequencies that include both material and geometry dispersions, and then we can easily calculate the exact FSR and dispersion through proper data processing.

Iterative calculation flow for resonator dispersion taking account of material and geometry dispersion.
3 Dispersion engineering of WGM microresonator
3.1 Principle
WGM microresonators have wide-ranging combinations of material and geometry, in particular, various choices are available (e.g. sphere, disk, toroid, and rod) and the selection is made based on the demands with regard to FSR or integration possibility. The host material for resonators determines the Q limitation, and the major trend with regards to the dispersion. However, the total dispersion can only be modified by changing the structural parameters in the monolithic resonators, and thus, there are many studies aimed at engineering the resonator dispersion utilizing geometry tailoring [51], [52], [53], [54], [55], [56], [57], [58], layer structure [59], [60], [61], [62], slot waveguide [63], [64], and multiresonator system [65], [66]. Moreover, micrometer order fabrication accuracy on the resonator cross-sectional dimensions sometimes plays an important role in the precise dispersion engineering.
In this section, we study the impact of geometry dispersion on the total dispersion for silica and magnesium fluoride (MgF2) WGM resonators. MgF2 has the potential for an ultra-high Q up to 1010 [67], [68] and a transmission window covering from the visible to mid-infrared wavelength range. Calcium fluoride (CaF2) [69], [70] and barium fluoride (BaF2) [71] exhibit similar optical properties to MgF2; nevertheless, thermal instability increases the difficulty of self-thermal locking [72] and results in a disadvantage in terms of frequency comb generation. Compared with MgF2, fused silica exhibits strong anomalous dispersion at 1.55 μm, but Q is likely limited to 108–109 due to OH-absorption [73]. However, the Q can be compensated for by its small mode area, because the threshold for parametric oscillation scales as V/Q2, which reduces the required pump power [3]. Moreover, good compatibility with wafer-scale fabrication and chip integration constitute major advantages [50], [74] compared with fluoride crystalline materials.
We learned that the total dispersion including the effects of material and geometry can be engineered via the geometric condition where different resonators are characterized by different structure parameters. To understand the geometry dispersion well, we looked at some example dispersion calculation results for several kinds of WGM resonators. The resonator size (corresponding to radius R) is directly related to the FSR, and thus, the FSR can be approximated from the resonator radius while other structural parameters affect both the FSR and dispersion. We mainly focus on presenting the dependence of each parameter on microresonator dispersion using a simulation. Here, we discuss the following WGM resonators (see also Figure 6):

Modeling of resonator structure.
(A) Spheroid (spherical) model, representing a mm-sized microresonator with a resonator radius R and a curvature radius r. (B) Microtoroid model, whose two structural parameters are major radius R and minor radius r. (C) Single-disk model with resonator radius R, thickness t, and wedge angle θ. (D–F) Scanning electron micrograph (SEM) images of WGM microresonators, (D) MgF2 crystalline resonator, (E) silica microtoroid resonator, and (F) Silica microdisk resonator.
Spheroid (spherical) model: The spheroid (spherical) structure is characterized by a resonator radius R and a curvature radius r. We assume MgF2 as the resonator material in this article.
Microtoroid model: The toroidal structure is characterized by the major radius R and minor diameter r. We assume the use of a silica resonator.
Single-disk model: The disk structure is characterized by the resonator radius R, disk angle θ, and thickness t. We assume the use of a silica resonator as with the toroid model.
3.2 Spheroid (spherical) model
Spheroid and spherical resonators have a common cross-sectional shape in crystalline [67] and silica rod resonators [75]. Since the fabricated resonator size is of the order of several hundred micrometers to several millimeters, the typical curvature radius is several tens/hundreds of micrometers. These features are determined by the fabrication methods, which involve mechanical and hand polishing with a crystalline resonator, and a carbon dioxide (CO2) laser cutting process with a silica rod resonator. It should be noted that microsphere resonators have only the resonator radius parameter, which is identical with the curvature radius [76], [77].
Figure 7A and B show calculated dispersion D as a function of wavelength for the fundamental TE mode of a MgF2 resonator with a different resonator radius and curvature radius. Figure 7C and D are the corresponding integrated dispersions Dint, which express the deviation between each resonance frequency and the estimated equidistant FSR D1/2π. By changing the resonator radius to 350 μm, 700 μm, 1400 μm, and 2800 μm, the dispersion curves gradually get close to the material dispersion with a larger size, exhibiting an overall anomalous dispersion. On the other hand, the curvature radii from 25 μm to 100 μm are less important with regard to dispersion, whereas a smaller radius contributes slightly to a strong anomalous dispersion (see inset of Figure 7B). These results reveal important guidelines: (1) the overall dispersion mainly depends on the resonator size and (2) the curvature size plays a less important role in a mm-size spheroid/spherical resonator. The first guideline can be simply understood as a reduction in the geometric dispersion in a larger resonator. The second guideline indicates that the optical mode is not influenced, thanks to a relatively large curvature radius compared with the resonance wavelength. Although we calculate only the fundamental mode here, the radial and polar higher-order modes enable us to change the dispersion. In particular, the radial higher-order mode contributes significantly to normal dispersion. [78].

Simulated dispersion of MgF2 spheroid resonator for different resonator radii R and curvature radii r in μm.
(A) Dispersion parameter D for different resonator radii. (B) Dispersion parameter D for different curvature radii. (C) Integrated dispersion Dint, which is defined as the deviation of the resonance frequency from an equidistant FSR, for different resonator radii. The positive parabolic function corresponds to anomalous dispersion, and the cubic function curves of the dispersion originate from the effect of third-order dispersion. (D) Integrated dispersion Dint for different curvature radii.
3.3 Microtoroid model
A microtoroid is characterized by a major (resonator) radius and a minor radius of several tens/hundreds of micrometers and several micrometers, respectively. A toroidal structure is formed by a (CO2) laser reflow process after silica disk fabrication using photolithography and chemical etching and thus achieves efficient light confinement via the boundary between silica and the surrounding air [74].
The simulated dispersion is shown in Figure 8. As with the spheroid model, a choice of major radii strongly affects the dispersion. Particularly, the difference between radii of 40 μm and 60 μm is more important in terms of realizing an anomalous dispersion. From Figure 8B, we can see that, in contrast to the spheroid model, the smaller minor radius contributes to a strong anomalous dispersion. This trend indicates that the inner boundary of toroid structures influences the optical mode, which strongly affects the geometry dispersion due to the μm-size minor radius. The change toward an anomalous dispersion with a smaller minor radius is interpreted as follows: geometry dispersion generally contributes to normal dispersion since a mode radius reduction corresponds to an increasing FSR with a longer wavelength. On the other hand, a change in ng can compensate for the normal dispersion, and the total dispersion becomes anomalous as a result of the strong mode confinement (see Section 2.4 for a detailed explanation). Thus, the geometry dispersion is anomalous overall as the resonator waveguide dimensions are compressed. We find that the dispersion for r=5 and r=6 shows little change compared with that for r=3 and r=4 as shown in Figure 8B and D. This can be explained by analogy with relatively loose mode confinement, namely, mode relaxation, has less influence on dispersion.

Simulated dispersion of a SiO2 microtoroid for different resonator radii R and minor radii r in μm.
(A) Dispersion parameter D for different resonator radii. (B) Dispersion parameter D for different minor radii. (C) Integrated dispersion Dint for different resonator radii. (D) Integrated dispersion Dint for different minor radii.
3.4 Single-disk model
A single-disk resonator has three parameters, namely a resonator radius, a wedge angle, and thickness [50], [79]. Our aim was to check the effect of disk angle and thickness on the dispersion with fixed resonator radius R=300 μm. Figure 9A and C show the dispersion with different thicknesses of 4 μm, 6 μm, 8 μm, and 10 μm. The disk angle was kept at 40°. We can clearly see that the dispersion curves increase significantly with a decrease in disk thickness and do not show any clear change with thicknesses of 8 μm and 10 μm. The reason for former observation can be explained with the analogy of “mode compression,” and the latter observation can be understood with the analogy of “mode relaxation” as with the microtoroid model. Next, we changed the disk angle of 20°, 30°, 40°, and 50° with a fixed thickness of 6 μm as shown in Figure 9B and D. The simulation result shows that the small disk angle contributes greatly to the normal dispersion. We can conclude that this effect is mainly because of the faster mode radius reduction with a smaller disk angle, which is a major feature of geometric dispersion as described in Section 2.3.

Simulated dispersion of SiO2 disk of 300 μm radius for different angles θ and thicknesses t μm.
(A) Dispersion parameter D for different disk thicknesses. (B) Dispersion parameter D for different disk angles. (C) Integrated dispersion Dint for different disk thicknesses. (D) Integrated dispersion Dint for different disk angles.
3.5 Strategy of dispersion engineering
Here, we review the obtained simulation results and plan a dispersion engineering strategy. First, the choice of material and resonator size is essential with respect to deciding the overall dispersion. Since a smaller-radius resonator is strongly influenced by geometric dispersion, it generally exhibits a normal dispersion. However, the resonator size determines the FSR of a comb, and so it is not easy to achieve both a large FSR and a proper anomalous dispersion for Kerr comb generation. To overcome this limitation, the compression of smaller resonator cross-section dimension is an effective way to change the dispersion from normal to anomalous in small-radius resonators [57], [79], [80]. A criterion for such mode compression is several times the wavelength of the optical mode (i.e. a cross-section dimension of λ~4λ). In addition, the disk angle critically affects the dispersion, which is not observed with spheroid/spherical and toroid models. We can understand this case as a rapidly decreasing mode radius with a smaller disk angle than with a larger angle (i.e. contribution to normal dispersion) [51], [81].
We believe that these trends apply to every type of WGM microresonator, and it will be an important strategy for designing the structure of a microresonator. In fact, both the GVD value and the higher-order dispersion play interesting roles with regard to the optical spectrum of a Kerr comb. Dint provides important information for predicting the optical spectrum, and dispersion engineering, which takes higher-order dispersion into account, enables more flexible control of a Kerr frequency comb.
4 Dispersion measurement technique
4.1 Principle
The measurement of microresonator dispersion is an essential technique for the evaluation of fabricated microresonators in addition to numerical simulation, as described in the previous section. Obtained resonance frequency information provides the resonator FSR, second- and higher-order dispersions, and the mode interaction between different transverse modes. However, resonator dispersion measurements have to be performed carefully and accurately because the resonator linewidths and deviation of the mode spacing are typically of the orders of kHz or MHz, which means that high spectral resolution is needed over the measurement bandwidth. In general, guaranteeing wavelength accuracy will not be easy work because of frequency uncertainty, which cannot be neglected in this case, during laser sweeping. Therefore, the wavelength axis of the measurement data must be calibrated with reliable methods to provide precise wavelength references. The dispersion measurement requirements are as follows: (1) measurement bandwidth, (2) accuracy and resolution, and (3) system simplicity. There is often a tradeoff, and thus, we have to carefully choose the best method. In this section, we review several dispersion measurement methods and compare the measurement results. Figure 10A shows a schematic of the experimental setup we used for the dispersion measurement, where we employed a crystalline MgF2 microresonator as a sample.

Schematics of various dispersion measurement methods.
(A) Schematic of the setup used for the microresonator dispersion measurement. Both the resonator transmittance and calibration marker are recorded simultaneously with a multi-channel oscilloscope. The paths of 4.2, 4.3, and 4.4 can be independently used for dispersion measurements, but all the signals in the experiment were observed for comparison. ECDL, external cavity diode laser; MZI, Mach-Zehnder interferometer. (B) Operating principle of the mode-locked frequency comb-based method. The scanning laser generates beat notes with stabilized fiber comb lines, and the beat signals filtered with a band-pass filter calibrate the time axis to frequency axis.
4.2 Laser wavelength-meter-based measurement
The simplest way involves using a wavelength meter to determine the actual wavelength of the sweeping laser. The wavelength meter is synchronized with the scanning laser, and the resonance transmission and output signal from the wavelength meter are obtained simultaneously with a long-memory oscilloscope or other data acquisition system. We assumed that the wavelength meter can be synchronized with the sweeping laser in this measurement. Accordingly, wavelength resolution and accuracy would be limited by the performance of the wavelength meter, which is at best of a tens of MHz order in commercially available devices. This lacks wavelength accuracy even though it is critical for the dispersion measurement. The advantage of this method is experimental simplicity, and it requires only a two-channel oscilloscope (available for maximum performance of memory length). Figure 11A–C show the experimental dispersion result obtained with a wavelength-meter-based measurement.
4.3 Mode-locked frequency-comb-based measurement
This method was first proposed as frequency-comb-assisted diode laser spectroscopy [82] and used in many studies [35], [40], [83], [84]. A scanning laser over resonances is partially split and combined with a stabilized frequency comb source, which generates a laser beat signal with equidistant comb lines. The generated beat signals are filtered with a narrow-band electrical bandpass filter to make calibration markers only when the scanning laser passes through the comb lines. Consequently, the calibration markers are detected when the laser frequency (fs) matches the difference between a neighboring comb line (fc=fceo+nfrep) and the center of the bandpass filter (fb) with 0<fb<frep/2: fs=fceo+nfrep±fb. This provides reliable information about the scanning laser frequency and the transmission resonance simultaneously within a few seconds (see Figure 10B). Resonance dips and marker peaks can be processed with a local peak finding algorithm. The measured results are shown in Figure 11D–F.

Comparison of dispersion measurement results obtained with three different methods.
(A) Measured resonator transmission spectrum (blue) and frequency marker signal with wavelength meter (orange). Several different mode families are recorded. (B) 10× enlarged view of (A). The frequency axis is calibrated by the peaks at a 100 MHz distance. (C) Measured dispersion plot of Dint (blue dots) versus relative mode number μ. The red line shows a parabolic fitting curve yielding D2/2π=4.5 kHz (FSR~21.6 GHz). The deviations from the fitting are limited by the accuracy of the wavelength meter. Strong mode perturbations around μ=100 and μ=150 are caused by anti-mode crossing between different mode families. (D) Measured resonator transmission spectrum (blue) and beat signal (red) with fiber comb lines, which work as calibration peaks. (E) 10× enlarged view of (D). The frequency axis is calibrated by the peaks at 40 MHz and 60 MHz with respect to the fiber comb lines with a 100 MHz mode spacing. (F) Measured dispersion plot of Dint (blue dots) and fitting curve (solid red line). The measurement accuracy is greatly improved compared with the wavelength meter method. (G) Measured resonator transmission spectrum (blue) and interferometric signal (green) with a fiber MZI. (H) 10× enlarged view of (G). The frequency axis is calibrated by the sinusoidal peaks at 20 MHz of FSR of the MZI. (I) Measured dispersion plot of Dint (blue dots) and fitting curve (solid red line). With proper dispersion calibration of the fiber MZI, the measured dispersion agrees well with the results obtained with other methods. The inset shows the result without MZI calibration, which reflects the inherent dispersion of silica optical fiber, and it hinders the resonator dispersion.
The spectral resolution is simply determined from the scan bandwidth and the memory length of the oscilloscope, and the sweeping speed of the laser should be sufficiently fast to avoid unnecessary measurement error (e.g. the frequency fluctuation of the comb source). However, the maximum sweep speed νs is limited by the bandwidth of radio frequency filters, which have response times (estimated from the inverse of the filter bandwidth Γ), yielding νg=1/Γ2. The laser frequency between neighboring calibration markers can be interpolated so that the use of multiple bandpass filters can increase the measurement accuracy. It should be noted that this method uses a multichannel oscilloscope with a sufficiently long memory because the spectral resolution (scan bandwidth divided by memory length) must be sufficiently finer than the resonance linewidth γ=Q/f. For instance, the detection of a high Q resonance of 109 over a 40-nm range needs a memory length of at least ~25M point per channel. It should also be noted that this measurement requires a mode-hope-free tunable laser over the scanning range, and the measurement bandwidth is limited by both the laser and the reference frequency comb.
In addition, we can also use a wavelength meter and frequency-stabilized reference laser, which generate a reference marker signal to calibrate the absolute wavelength. The uncertainty of the wavelength meter introduces an absolute wavelength offset for the measurement data; however, it is less important for microresonator “dispersion” measurements. This indicates that measurement accuracy does not depend on absolute frequency calibration, but on relative frequency calibration. The bandwidth limitation of the measurement can be overcome by utilizing two widely tunable lasers with different wavelength bands if the reference comb has a broad enough bandwidth over the full measurement range [85].
4.4 Calibrated fiber interferometer based measurement
With this method, a fiber interferometer or fiber-loop cavity is used as a calibration marker [34], [50], [86], [87], [88] instead of beat signals generated with a frequency comb. This method offers simple implementation, high accuracy, and a broad bandwidth, but the fiber interferometer itself inherently exhibits dispersion. Thus, the FSR and dispersion of a fiber Mach-Zehnder interferometer (MZI) have to be carefully measured and calibrated in advance of the resonator dispersion measurement. A fiber MZI is easy to prepare by connecting two 50/50 fiber couplers where one path is several meters longer than the other. The length difference between the two paths ΔLfiber corresponds to the frequency period of a sinusoidal interferometer signal ΔfMZI=c/(nΔLfiber). If we use a 10 m length of delay line (e.g. commercial single-mode silica optical fiber), the interferometric period will be around 20 MHz. When the laser is slowly scanned, the period of the MZI becomes longer on the time axis, on the other hand, the MZI will respond as a short period against faster scanning. This gives frequency calibration information, and the number of MZI periods is counted with a similar algorithm to that used with the frequency comb-based method. Measured results are shown in Figure 11G–I. The MZI dispersion can be expressed by a Taylor expanded equation, which has a similar form to Eq. (15);
where ΔfMZI,0 is the FSR of the center mode μMZI=0, μMZI is the relative mode number of the MZI period with respect to the center mode, d1 and d2 are the first- and second-order dispersion, respectively. The calibration of the fiber MZI must be accomplished by the precise measurement of the FSR both near and far from the center mode, and polynomial fitting according to Eq. (22). If the dispersion of the fiber MZI, namely, d1 and d2, is not considered, the resonator dispersion can be no longer measured (see inset in Figure 11I). When used for microresonator dispersion measurement, the calibrated fiber MZI should be operated in a stable condition with respect to temperature, pressure, and bending, to avoid any deviation of the calibration data.
4.5 Electro-optic modulator comb-based measurement
An electro-optic modulator (EOM) generates the sidebands of the scanning laser, and the result is multiple resonances on both sides with a modulation frequency fmod. The sideband modulation technique can be used for various applications in microresonator research such as the Pound-Drever-Hall technique [89], linewidth estimation [90], electro-optic (EO) frequency comb generation [91], and the dispersion measurement described here [51], [81]. If the modulation frequency fmod nearly matches the resonator FSR, three resonance dips can overlap each other in the spectral domain, and then fmod itself gives the FSR to be investigated. This method can be adopted for broadband dispersion measurement and is not limited by tunable range of the mode-hope free laser, from 1400 to 1700 nm, and even around the 2100 nm wavelength region via difference frequency generation [51]. The CW laser sent to the EOM with fmod outputs a narrow band EO comb, and the bandwidth is broadened through multiple amplifiers and highly nonlinear fibers. When the broadened comb lines sweep over the multiple resonances simultaneously, precisely adjusted fmod will provide the average FSR of the extracted resonances. The uncertainty of this measurement is estimated to be about 100 kHz [81]. Here it should be noted that there is a limitation in terms of resonator FSR because fmod must reach at least 1-FSR from the pump laser. Since the bandwidth of a commercially available EO modulator is several tens of GHz, this method can only be applied to mm-meter scale microresonators.
5 Role of dispersion in Kerr frequency comb spectrum
Microresonator dispersion plays a critical role in the Kerr frequency comb spectrum, and thus, dispersion engineering is currently a hot topic in microresonator frequency comb research. By tailoring the resonator geometry, it becomes possible to overcome the inherent material dispersion as shown in Section 3. Since a requirement for microresonator soliton formation, particularly bright soliton, is to accomplish anomalous dispersion, parabolic positive dispersion D2 should ideally be achieved around the pump laser wavelength (see Figure 12A). Nevertheless, higher-order dispersions contribute to the spectral broadening of Kerr combs [92], [93], [94], [95], and this effect is attracting great interest in terms of overcoming the spectral limitation imposed by second-order dispersion.

Spectra of Kerr frequency comb and corresponding dispersion Dint (solid red line).
Dissipative Kerr solitons dominated by D2 (A), with a single peak dispersive wave (B) and double peaks (C) affected by D3 and D4, respectively. (D) Clustered comb formed in a normal dispersion regime via D4. Phase-matching points are indicated by the solid green line.
Higher-order dispersion makes it possible to expand the comb into a wavelength region in which the sign of the dispersion Dint changes from positive (negative) to negative (positive). For instance, third-order dispersion induces Cherenkov radiation [96], which can be understood in terms of the dispersive wave emission in the frequency domain in Figure 12B [35], [97], and fourth-order dispersion permits the formation of a dispersive wave with double peaks on both sides with respect to the pump in Figure 12C [98], [99], [100]. Fourth-order dispersion also makes it possible to achieve spectral broadening in both anomalous and normal dispersion and is called clustered comb formation [84], [101], [102], [103]. A clustered comb is shown in Figure 12D, where the sign of D2 is negative and that of D4 is positive (odd orders of dispersion have no effect in this case). This phase-matching scheme enables us to realize a frequency-tunable parametric oscillator and a localized comb generator from 1 μm to mid-infrared wavelengths [84], [104].
Figure 13 shows the observed Kerr comb spectrum influenced by microresonator dispersion. DKS formation is observed when the resonator dispersion is dominated by the positive parabolic curve D2 (anomalous dispersion) as shown in Figure 13A. The comb spectrum becomes distorted under local dispersion perturbation, which is induced by avoided mode crossing between different transverse modes [105], [106]. Such local mode coupling occurring at the vicinity of the pump mode disturbs soliton formation [107], and therefore, the suppression of mode coupling between coexisting transverse modes is needed if one wants to generate DKSs in WGM microresonators efficiently [51], [108], [109]. On the other hand, a mode-coupling-induced local dispersion shift leads to many applications such as deterministic single soliton generation [110], an understanding of soliton properties [111], [112], and Kerr comb generation in normal dispersion system [86], [113], [114]. In particular, dark pulse (flat-topped pulse, platicon) formation can be directly achieved in a normal dispersion resonator via the local avoided mode crossing [40], [65], [115], [116]. The normal dispersion microresonator comb formation is expected to expand the comb bandwidth in the visible wavelength range, where the strong material dispersion dominates the total dispersion, via tailoring of dispersion. Moreover, the higher conversion efficiency [117] and FSR controllability [65], [118], [119] are unique features of the normal dispersion microcomb. Dispersive waves realized via higher-order dispersion constitute a key technology for expanding the microcomb spectrum to the normal dispersion regime, and thus sustaining a robust soliton waveform. This improves the conversion efficiency of the comb spectral and enables one to generate an octave-wide soliton comb [98]. Recently, multicolor soliton microcombs have been proposed by utilizing advance dispersion engineering such as a complex structure tailoring [120], and it paves the way for developing of broadband, arbitrary spectrum engineering techniques.
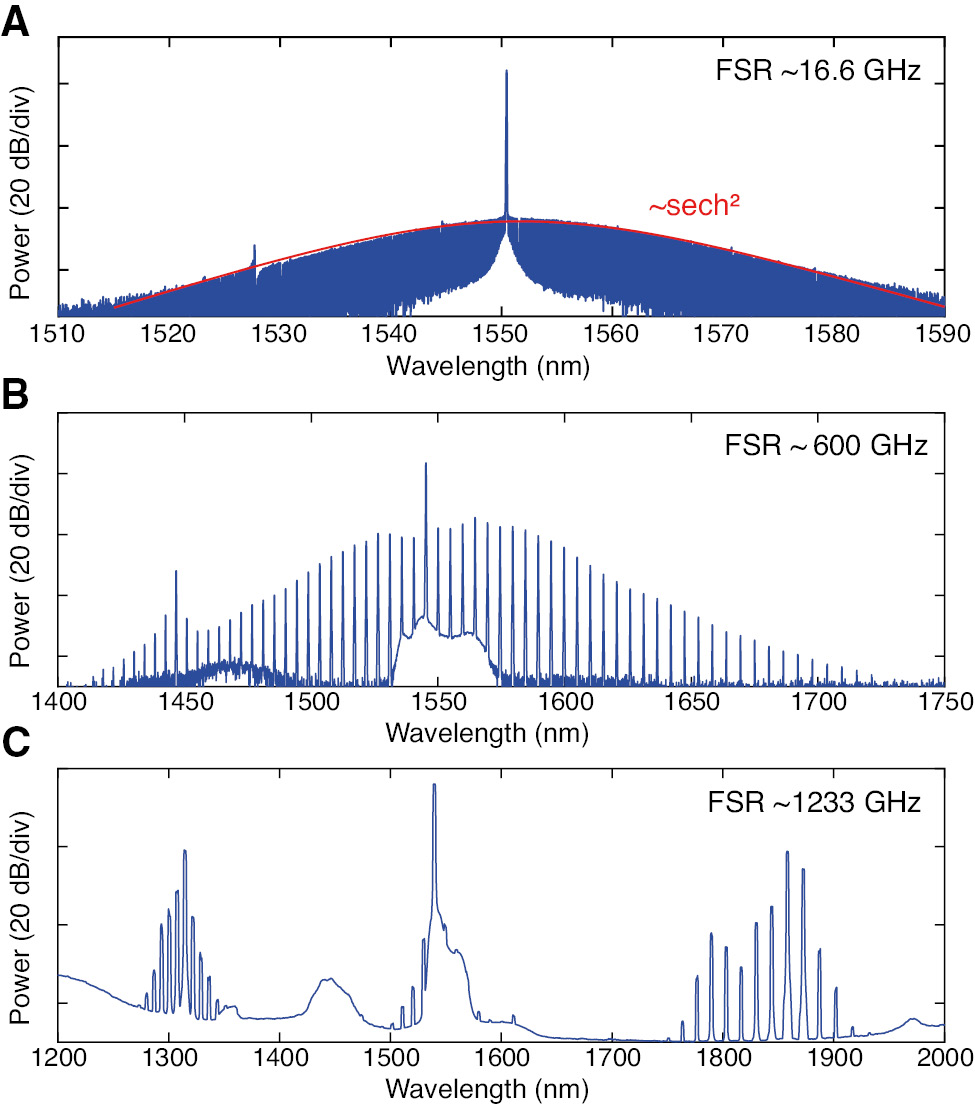
Experimentally observed optical spectra of Kerr frequency comb.
(A) Soliton comb formation in a MgF2 crystalline microresonator with an FSR of 16.6 GHz. The solid red line (~sech2) shows a single soliton state with smooth spectrum envelope. (B) Optical spectrum with dispersive wave emission around 1450 nm in a silica toroid microresonator. (C) Clustered comb formation in a normal dispersion operated silica toroid microresonator.
6 Summary
We have reviewed microresonator dispersion engineering and described a calculation method and a measurement method with the aim of Kerr frequency comb generation. WGM microresonators have several kinds of resonator structures and candidate materials, and their choice and dispersion tailoring are the key steps to generating a Kerr soliton comb and expanding the comb bandwidth assisted by dispersive wave emission. Dispersion simulation based on FEM computation provides a useful method for obtaining reliable resonance frequency results as well as the optical mode distribution. In addition, a comparison of experimental dispersion measurements offers a wide range of choices suited to the requirement. We believe that much is still to be explored with regard to microresonator dispersion engineering, and problems remain, including comb generation in different wavelength regions (i.e. visible and mid-infrared), where material dispersion is more dominant. The dispersion engineering technique will evolve concurrently with the development of fabrication techniques with a view to plotting a new landscape for the microresonator frequency comb.
Acknowledgments
This work was supported by Strategic Information and Communications R&D Promotion Programme (SCOPE) (191603001) from the Ministry of Internal Affairs and Communications and by the Japan Society for the Promotion of Science (JSPS) (JP18J21797) Grant-in-Aid for JSPS Fellow. The authors would like to acknowledge the research contribution of current and former members of research group: T. Kato, R. Suzuki, A. Hori, H. Kumazaki, A. Kubota, M. Fuchida, S. Tanaka, K. Wada, and R. Imamura. We also thank the following kind collaborators: Y. Kakinuma for resonator fabrication and H. Sasada for mode-locked fiber comb technique.
References
[1] Kippenberg TJ, Holzwarth R, Diddams SA. Microresonator-based optical frequency combs. Science 2011;332:555–9.10.1126/science.1193968Suche in Google Scholar PubMed
[2] Del’Haye P, Schliesser A, Arcizet O, Wilken T, Holzwarth R, Kippenberg TJ. Optical frequency comb generation from a monolithic microresonator. Nature 2007;450:1214–7.10.1038/nature06401Suche in Google Scholar PubMed
[3] Kippenberg TJ, Spillane SM, Vahala KJ. Kerr-nonlinearity optical parametric oscillation in an ultrahigh-Q toroid microcavity. Phys Rev Lett 2004;93:083904.10.1103/PhysRevLett.93.083904Suche in Google Scholar PubMed
[4] Savchenkov AA, Matsko AB, Strekalov D, Mohageg M, Ilchenko VS, Maleki L. Low threshold optical oscillations in a whispering gallery mode CaF2 resonator. Phys Rev Lett 2004;93:243905.10.1103/PhysRevLett.93.243905Suche in Google Scholar PubMed
[5] Chembo YK. Kerr optical frequency combs: theory, applications and perspectives. Nanophotonics 2016;5:214–30.10.1515/nanoph-2016-0013Suche in Google Scholar
[6] Pasquazi A, Peccianti M, Razzari L, et al. Micro-combs: a novel generation of optical sources. Phys Rep 2018;729:1–81.10.1016/j.physrep.2017.08.004Suche in Google Scholar
[7] Del’Haye P, Arcizet O, Schliesser A, Holzwarth R, Kippenberg TJ. Full stabilization of a microresonator-based optical frequency comb. Phys Rev Lett 2008;101:053903.10.1103/PhysRevLett.101.053903Suche in Google Scholar PubMed
[8] Del’Haye P, Herr T, Gavartin E, Gorodetsky ML, Holzwarth R, Kippenberg TJ. Octave spanning tunable frequency comb from a microresonator. Phys Rev Lett 2011;107:063901.10.1103/PhysRevLett.107.063901Suche in Google Scholar PubMed
[9] Savchenkov AA, Matsko AB, Ilchenko VS, Solomatine I, Seidel D, Maleki L. Tunable optical frequency comb with a crystalline whispering gallery mode resonator. Phys Rev Lett 2008;101:093902.10.1103/PhysRevLett.101.093902Suche in Google Scholar PubMed
[10] Herr T, Hartinger K, Riemensberger J, et al. Universal formation dynamics and noise of Kerr-frequency combs in microresonators. Nat Photon 2012;6:480–7.10.1038/nphoton.2012.127Suche in Google Scholar
[11] Savchenkov A, Matsko A, Maleki L. On frequency combs in monolithic resonators. Nanophotonics 2016;5:363–91.10.1515/nanoph-2016-0031Suche in Google Scholar
[12] Hansson T, Wabnitz S. Dynamics of microresonator frequency comb generation: models and stability. Nanophotonics 2016;5:231–43.10.1515/nanoph-2016-0012Suche in Google Scholar
[13] Marin-Palomo P, Kemal JN, Karpov M, et al. Microresonator-based solitons for massively parallel coherent optical communications. Nature 2017;546:274–9.10.1038/nature22387Suche in Google Scholar PubMed
[14] Obrzud E, Rainer M, Harutyunyan A, et al. A microphotonic astrocomb. Nat Photon 2019;13:31–5.10.1038/s41566-018-0309-ySuche in Google Scholar
[15] Suh M-G, Yi X, Lai Y-H, et al. Searching for exoplanets using a microresonator astrocomb. Nat Photon 2019;13:25–30.10.1038/s41566-018-0312-3Suche in Google Scholar PubMed PubMed Central
[16] Suh M-G, Yang Q-F, Yang KY, Yi X, Vahala KJ. Microresonator soliton dual-comb spectroscopy. Science 2016;354:600–3.10.1364/FIO.2016.FF2C.2Suche in Google Scholar
[17] Dutt A, Joshi C, Ji X, et al. On-chip dual-comb source for spectroscopy. Sci Adv 2018;4:e1701858.10.1126/sciadv.1701858Suche in Google Scholar PubMed PubMed Central
[18] Suh M-G, Vahala KJ. Soliton microcomb range measurement. Science 2018;359:884–7.10.1126/science.aao1968Suche in Google Scholar PubMed
[19] Trocha P, Karpov M, Ganin D, et al. Ultrafast optical ranging using microresonator soliton frequency combs. Science 2018;359:887–91.10.1126/science.aao3924Suche in Google Scholar PubMed
[20] Liang W, Eliyahu S, Ilchenko VS, et al. High spectral purity Kerr frequency comb radio frequency photonic oscillator. Nat Commun 2015;6:7957.10.1038/ncomms8957Suche in Google Scholar PubMed PubMed Central
[21] Spencer DT, Drake T, Briles TC, et al. An optical-frequency synthesizer using integrated photonics. Nature 2018;557:81–5.10.1038/s41586-018-0065-7Suche in Google Scholar PubMed
[22] Lin G, Coillet A, Chembo YK. Nonlinear photonics with high-q whispering-gallery-mode resonators. Adv Opt Photon 2017;9:828–90.10.1364/AOP.9.000828Suche in Google Scholar
[23] He L, Özdemir SK, Yang L. Whispering gallery microcavity lasers. Laser Photon Rev 2013;7:60–82.10.1002/lpor.201100032Suche in Google Scholar
[24] Lin G, Chembo YK. Monolithic total internal reflection resonators for applications in photonics. Opt Mater X 2019;2:100017.10.1016/j.omx.2019.100017Suche in Google Scholar
[25] Matsko AB, Savchenkov AA, Strekalov D, Ilchenko VS, Maleki L. Optical hyperparametric oscillations in a whispering-gallery-mode resonator: threshold and phase diffusion. Phys Rev A 2005;71:033804.10.1103/PhysRevA.71.033804Suche in Google Scholar
[26] Ferdous F, Miao H, Leaird DE, et al. Spectral line-by-line pulse shaping of on-chip microresonator frequency combs. Nat Photon 2011;5:770–6.10.1038/nphoton.2011.255Suche in Google Scholar
[27] Kippenberg TJ, Gaeta AL, Lipson M, Gorodetsky ML. Dissipative Kerr solitons in optical microresonators. Science 2018;361:eaan8083.10.1126/science.aan8083Suche in Google Scholar PubMed
[28] Herr T, Brasch V, Jost J, et al. Temporal solitons in optical microresonators. Nat Photon 2014;8:145–52.10.1038/nphoton.2013.343Suche in Google Scholar
[29] Brasch V, Geiselmann M, Pfeiffer MHP, Kippenberg TJ. Bringing short-lived dissipative Kerr soliton states in microresonators into a steady state. Opt Express 2016;24:29312–20.10.1364/OE.24.029312Suche in Google Scholar PubMed
[30] Guo H, Karpov M, Lucas E, et al. Universal dynamics and deterministic switching of dissipative Kerr solitons in optical microresonators. Nat Phys 2017;13:94–102.10.1038/nphys3893Suche in Google Scholar
[31] Stone JR, Briles TC, Drake TE, et al. Thermal and nonlinear dissipative-soliton dynamics in Kerr-microresonator frequency combs. Phys Rev Lett 2018;121:063902.10.1103/PhysRevLett.121.063902Suche in Google Scholar PubMed
[32] Zhang S, Silver JM, Bino LD, et al. Sub-milliwatt-level microresonator solitons with extended access range using an auxiliary laser. Optica 2019;6:206–12.10.1364/OPTICA.6.000206Suche in Google Scholar
[33] Grelu P, Akhmediev N. Dissipative solitons for mode-locked lasers. Nat Photon 2012;6:84–92.10.1038/nphoton.2011.345Suche in Google Scholar
[34] Yi X, Yang Q-F, Yang KY, Suh M-G, Vahala KJ. Soliton frequency comb at microwave rates in a high-Q silica microresonator. Optica 2015;2:1078–85.10.1364/OPTICA.2.001078Suche in Google Scholar
[35] Brasch V, Geiselmann M, Herr T, et al. Photonic chip-based optical frequency comb using soliton Cherenkov radiation. Science 2016;351:357–60.10.1126/science.aad4811Suche in Google Scholar PubMed
[36] Joshi C, Jang JK, Luke K, et al. Thermally controlled comb generation and soliton modelocking in microresonators. Opt Lett 2016;41:2565–8.10.1364/OL.41.002565Suche in Google Scholar PubMed
[37] Griffith AG, Lau RKW, Cardenas J, et al. Silicon-chip mid-infrared frequency comb generation. Nat Commun 2015;6:6299.10.1364/CLEO_SI.2014.STh5C.6Suche in Google Scholar
[38] Gong Z, Bruch A, Shen M, et al. High-fidelity cavity soliton generation in crystalline AlN micro-ring resonators. Opt Lett 2018;43:4366–9.10.1364/OL.43.004366Suche in Google Scholar PubMed
[39] He Y, Yang Q-F, Ling J, et al. Self-starting bi-chromatic LiNbO3 soliton microcomb. Optica 2019;6:1138–44.10.1364/OPTICA.6.001138Suche in Google Scholar
[40] Xue X, Xuan Y, Liu Y, et al. Mode-locked dark pulse Kerr combs in normal-dispersion microresonators. Nat Photonics 2015;9:594–600.10.1038/nphoton.2015.137Suche in Google Scholar
[41] Agrawal GP. Nonlinear fiber optics. Academic, 2007.10.1016/B978-012369516-1/50011-XSuche in Google Scholar
[42] Sellmeier W. Ueber die durch die aetherschwingungen erregten mitschwingungen der kÖrpertheilchen und deren rÜckwirkung auf die ersteren, besonders zur erklärung der dispersion und ihrer anomalien. Ann der Physik 1872;223:386–403.10.1002/andp.18722231105Suche in Google Scholar
[43] Weber MJ. Handbook of optical materials. CRC press, 2002.10.1201/9781420050196Suche in Google Scholar
[44] Luke K, Okawachi Y, Lamont MRE, Gaeta AL, Lipson M. Broadband mid-infrared frequency comb generation in a Si3N4 microresonator. Opt Lett 2015;40:4823–6.10.1364/CLEO_SI.2015.STu4I.8Suche in Google Scholar
[45] Demchenko YA, Gorodetsky ML. Analytical estimates of eigenfrequencies, dispersion, and field distribution in whispering gallery resonators. J Opt Soc Am B 2013;30:3056–63.10.1364/JOSAB.30.003056Suche in Google Scholar
[46] Breunig I, Sturman B, Sedlmeir F, Schwefel HGL, Buse K. Whispering gallery modes at the rim of an axisymmetric optical resonator: analytical versus numerical description and comparison with experiment. Opt Express 2013;21:30683–92.10.1364/OE.21.030683Suche in Google Scholar PubMed
[47] Chembo YK, Yu N. Modal expansion approach to optical-frequency-comb generation with monolithic whispering-gallery-mode resonators. Phys Rev A 2010;82:033801.10.1103/PhysRevA.82.033801Suche in Google Scholar
[48] Oxborrow M. How to simulate the whispering-gallery modes of dielectric microresonators in FEMLAB/COMSOL. Proc SPIE 2007;6452:6452–1–6452–12.10.1117/12.714954Suche in Google Scholar
[49] Spillane SM, Kippenberg TJ, Vahala KJ, Goh KW, Wilcut E, Kimble HJ. Ultrahigh-q toroidal microresonators for cavity quantum electrodynamics. Phys Rev A 2005;71:013817.10.1103/PhysRevA.71.013817Suche in Google Scholar
[50] Lee H, Chen T, Li J, et al. Chemically etched ultrahigh-Q wedge-resonator on a silicon chip. Nat Photon 2012;6:369.10.1038/nphoton.2012.109Suche in Google Scholar
[51] Yang KY, Beha K, Cole DC, et al. Broadband dispersion-engineered microresonator on a chip. Nat Photon 2016;10:316–20.10.1038/nphoton.2016.36Suche in Google Scholar
[52] Turner AC, Manolatou C, Schmidt BS, et al. Tailored anomalous group-velocity dispersion in silicon channel waveguides. Opt Express 2006;14:4357–62.10.1364/OE.14.004357Suche in Google Scholar
[53] Grudinin IS, Baumgartel L, Yu N. Frequency comb from a microresonator with engineered spectrum. Opt Express 2012;20:6604–9.10.1364/OE.20.006604Suche in Google Scholar PubMed
[54] Grudinin IS, Baumgartel L, Yu N. Impact of cavity spectrum on span in microresonator frequency combs. Opt Express 2013;21:26929–35.10.1364/OE.21.026929Suche in Google Scholar PubMed
[55] Grudinin IS, Yu N. Dispersion engineering of crystalline resonators via microstructuring. Optica 2015;2:221–4.10.1364/OPTICA.2.000221Suche in Google Scholar
[56] Zhou C, Du J, He Z. Wideband dispersion flattening for whispering gallery mode microresonators fabricated by laser micromachining. IEEE Photon J 2017;9:1–8.10.1109/JPHOT.2017.2773120Suche in Google Scholar
[57] Yang Y, Jiang X, Kasumie S, et al. Four-wave mixing parametric oscillation and frequency comb generation at visible wavelengths in a silica microbubble resonator. Opt Lett 2016;41:5266–9.10.1364/OL.41.005266Suche in Google Scholar PubMed
[58] Nakagawa Y, Mizumoto Y, Kato T, et al. Dispersion tailoring of a crystalline whispering gallery mode microcavity for a wide-spanning optical Kerr frequency comb. J Opt Soc Am B 2016;33:1913–20.10.1364/JOSAB.33.001913Suche in Google Scholar
[59] Riemensberger J, Hartinger K, Herr T, Brasch V, Holzwarth R, Kippenberg TJ. Dispersion engineering of thick high-Q silicon nitride ring-resonators via atomic layer deposition. Opt Express 2012;20:27661–9.10.1364/OE.20.027661Suche in Google Scholar PubMed
[60] Xu C, Ma J, Ke C, et al. Microcavity dispersion engineering for the visible optical frequency comb generation. Appl Phys Lett 2019;114:091104.10.1063/1.5080126Suche in Google Scholar
[61] Jin X, Wang J, Wang M, Dong Y, Li F, Wang K. Dispersion engineering of a microsphere via multi-layer coating. Appl Opt 2017;56:8023–8.10.1364/AO.56.008023Suche in Google Scholar PubMed
[62] Liang H, He Y, Luo R, Lin Q. Ultra-broadband dispersion engineering of nanophotonic waveguides. Opt Express 2016;24:29444–51.10.1364/OE.24.029444Suche in Google Scholar PubMed
[63] Zhang L, Bao C, Singh V, et al. Generation of two-cycle pulses and octave-spanning frequency combs in a dispersion-flattened micro-resonator. Opt Lett 2013;38:5122–5.10.1364/OL.38.005122Suche in Google Scholar PubMed
[64] Zhang L, Yue Y, Beausoleil RG, Willner AE. Flattened dispersion in silicon slot waveguides. Opt Express 2010;18:20529–34.10.1364/OE.18.020529Suche in Google Scholar PubMed
[65] Xue X, Xuan Y, Wang P-H, et al. Normal-dispersion microcombs enabled by controllable mode interactions. Laser Photon Rev 2015;9:L23–8.10.1002/lpor.201500107Suche in Google Scholar
[66] Kim S, Han K, Wang C, et al. Dispersion engineering and frequency comb generation in thin silicon nitride concentric microresonators. Nat Commun 2017;8:372.10.1038/s41467-017-00491-xSuche in Google Scholar PubMed PubMed Central
[67] Liang W, Savchenkov AA, Matsko AB, et al. Generation of near-infrared frequency combs from a MgF2 whispering gallery mode resonator. Opt Lett 2011;36:2290–2.10.1364/OL.36.002290Suche in Google Scholar PubMed
[68] Hofer J, Schliesser A, Kippenberg TJ. Cavity optomechanics with ultrahigh-Q crystalline microresonators. Phys Rev A 2010;82:031804.10.1103/PhysRevA.82.031804Suche in Google Scholar
[69] Grudinin IS, Ilchenko VS, Maleki L. Ultrahigh optical Q factors of crystalline resonators in the linear regime. Phys Rev A 2006;74:063806.10.1103/PhysRevA.74.063806Suche in Google Scholar
[70] Savchenkov AA, Ilchenko VS, Matsko AB, Maleki L. Kilohertz optical resonances in dielectric crystal cavities. Phys Rev A 2004;70:051804.10.1103/PhysRevA.70.051804Suche in Google Scholar
[71] Lin G, Diallo S, Henriet R, Jacquot M, Chembo YK. Barium fluoride whispering-gallery-mode disk-resonator with one billion quality-factor. Opt Lett 2014;39:6009–12.10.1364/OL.39.006009Suche in Google Scholar PubMed
[72] Diallo S, Lin G, Chembo YK. Giant thermo-optical relaxation oscillations in millimeter-size whispering gallery mode disk resonators. Opt Lett 2015;40:3834–7.10.1364/OL.40.003834Suche in Google Scholar PubMed
[73] Gorodetsky ML, Savchenkov AA, Ilchenko VS. Ultimate Q of optical microsphere resonators. Opt Lett 1996;21:453–5.10.1364/OL.21.000453Suche in Google Scholar PubMed
[74] Armani D, Kippenberg TJ, Spillane S, Vahala KJ. Ultra-high-Q toroid microcavity on a chip. Nature 2003;421:925–8.10.1038/nature01371Suche in Google Scholar PubMed
[75] Del’Haye P, Diddams SA, Papp SB. Laser-machined ultra-high-Q microrod resonators for nonlinear optics. Appl Phys Lett 2013;102:221119.10.1063/1.4809781Suche in Google Scholar
[76] Braginsky V, Gorodetsky M, Ilchenko V. Quality-factor and nonlinear properties of optical whispering-gallery modes. Phys Rev A 1989;137:393–7.10.1016/0375-9601(89)90912-2Suche in Google Scholar
[77] Collot L, Lefevre-Seguin V, Brune M, Raimond J, Haroche S. Very high-Q whispering-gallery mode resonances observed on fused silica microspheres. Europhys Lett 1993;23:327.10.1209/0295-5075/23/5/005Suche in Google Scholar
[78] Lin G, Chembo YK. On the dispersion management of fluorite whispering-gallery mode resonators for Kerr optical frequency comb generation in the telecom and mid-infrared range. Opt Express 2015;23:1594–604.10.1364/OE.23.001594Suche in Google Scholar PubMed
[79] Li G, Liu P, Jiang X, et al. High-Q silica microdisk optical resonators with large wedge angles on a silicon chip. Photon Res 2015;3:279–82.10.1364/PRJ.3.000279Suche in Google Scholar
[80] Lee SH, Oh DY, Yang Q-F, et al. Towards visible soliton microcomb generation. Nat Commun 2017;8:1295.10.1038/s41467-017-01473-9Suche in Google Scholar PubMed PubMed Central
[81] Li J, Lee H, Yang KY, Vahala KJ. Sideband spectroscopy and dispersion measurement in microcavities. Opt Express 2012;20:26337–44.10.1364/OE.20.026337Suche in Google Scholar PubMed
[82] Del’Haye P, Arcizet O, Gorodetsky ML, Holzwarth R, Kippenberg TJ. Frequency comb assisted diode laser spectroscopy for measurement of microcavity dispersion. Nat Photon 2009;3:529–33.10.1038/nphoton.2009.138Suche in Google Scholar
[83] Xue X, Xuan Y, Wang C, et al. Thermal tuning of Kerr frequency combs in silicon nitride microring resonators. Opt Express 2016;24:687–98.10.1364/OE.24.000687Suche in Google Scholar PubMed
[84] Fujii S, Tanaka S, Fuchida M, et al. Octave-wide phase-matched four-wave mixing in dispersion-engineered crystalline microresonators. Opt Lett 2019;44:3146–9.10.1364/OL.44.003146Suche in Google Scholar PubMed
[85] Liu J, Brasch V, Pfeiffer MHP, et al. Frequency-comb-assisted broadband precision spectroscopy with cascaded diode lasers. Opt Lett 2016;41:3134–7.10.1364/OL.41.003134Suche in Google Scholar PubMed
[86] Huang S-W, Zhou H, Yang J, et al. Mode-locked ultrashort pulse generation from on-chip normal dispersion microresonators. Phys Rev Lett 2015;114:053901.10.1103/PhysRevLett.114.053901Suche in Google Scholar PubMed
[87] Suzuki R, Kato T, Kobatake T, Tanabe T. Suppression of optomechanical parametric oscillation in a toroid microcavity assisted by a Kerr comb. Opt Express 2017;25:28806–16.10.1364/OE.25.028806Suche in Google Scholar
[88] Zhou H, Geng Y, Cui W, et al. Soliton bursts and deterministic dissipative Kerr soliton generation in auxiliary-assisted microcavities. Light Sci Appl 2019;8:50.10.1038/s41377-019-0161-ySuche in Google Scholar PubMed PubMed Central
[89] Drever RWP, Hall JL, Kowalski FV, et al. Laser phase and frequency stabilization using an optical resonator. Appl Phys B 1983;31:97–105.10.1007/BF00702605Suche in Google Scholar
[90] Anderson M, Pavlov NG, Jost JD, et al. Highly efficient coupling of crystalline microresonators to integrated photonic waveguides. Opt Lett 2018;43:2106–9.10.1364/OL.43.002106Suche in Google Scholar PubMed
[91] Papp SB, Del’Haye P, Diddams SA. Parametric seeding of a microresonator optical frequency comb. Opt Express 2013;21:17615–24.10.1364/OE.21.017615Suche in Google Scholar PubMed
[92] Chembo YK, Yu N. On the generation of octave-spanning optical frequency combs using monolithic whispering-gallery-mode microresonators. Opt Lett 2010;35:2696–8.10.1364/OL.35.002696Suche in Google Scholar PubMed
[93] Coen S, Randle HG, Sylvestre T, Erkintalo M. Modeling of octave-spanning Kerr frequency combs using a generalized mean-field Lugiato-Lefever model. Opt Lett 2013;38:37–9.10.1364/OL.38.000037Suche in Google Scholar PubMed
[94] Okawachi Y, Lamont MRE, Luke K, et al. Bandwidth shaping of microresonator-based frequency combs via dispersion engineering. Opt Lett 2014;39:3535–8.10.1364/OL.39.003535Suche in Google Scholar PubMed
[95] Bao C, Taheri H, Zhang L, et al. High-order dispersion in Kerr comb oscillators. J Opt Soc Am B 2017;34:715–25.10.1364/JOSAB.34.000715Suche in Google Scholar
[96] Akhmediev N, Karlsson M. Cherenkov radiation emitted by solitons in optical fibers. Phys Rev A 1995;51:2602–7.10.1103/PhysRevA.51.2602Suche in Google Scholar
[97] Brasch V, Lucas E, Jost JD, Geiselmann M, Kippenberg TJ. Self-referenced photonic chip soliton Kerr frequency comb. Light Sci Appl 2017;6:e16202.10.1038/lsa.2016.202Suche in Google Scholar PubMed PubMed Central
[98] Pfeiffer MHP, Herkommer C, Liu J, et al. Octave-spanning dissipative Kerr soliton frequency combs in Si3N4 microresonators. Optica 2017;4:684–91.10.1364/OPTICA.4.000684Suche in Google Scholar
[99] Li Q, Briles TC, Westly DA, et al. Stably accessing octave-spanning microresonator frequency combs in the soliton regime. Optica 2017;4:193–203.10.1364/OPTICA.4.000193Suche in Google Scholar PubMed PubMed Central
[100] Yu S-P, Briles TC, Moille GT, et al. Tuning Kerr-soliton frequency combs to atomic resonances. Phys Rev Appl 2019;11:044017.10.1103/PhysRevApplied.11.044017Suche in Google Scholar
[101] Matsko AB, Savchenkov AA, Huang S-W, Maleki L. Clustered frequency comb. Opt Lett 2016;41:5102–5.10.1364/OL.41.005102Suche in Google Scholar PubMed
[102] Fujii S, Kato T, Suzuki R, Tanabe T. Third-harmonic blue light generation from Kerr clustered combs and dispersive waves. Opt Lett 2017;42:2010–3.10.1364/OL.42.002010Suche in Google Scholar PubMed
[103] Sayson NLB, Pham H, Webb KE, et al. Origins of clustered frequency combs in Kerr microresonators. Opt Lett 2018;43:4180–3.10.1364/OL.43.004180Suche in Google Scholar PubMed
[104] Sayson NLB, Bi T, Ng V, et al. Octave-spanning tunable parametric oscillation in crystalline Kerr microresonators. Nat Photon 2019;13:701–6.10.1038/s41566-019-0485-4Suche in Google Scholar
[105] Ramelow S, Farsi A, Clemmen S, et al. Strong polarization mode coupling in microresonators. Opt Lett 2014;39:5134–7.10.1364/OL.39.005134Suche in Google Scholar PubMed
[106] Matsko AB, Liang W, Savchenkov AA, Eliyahu D, Maleki L. Optical Cherenkov radiation in overmoded microresonators. Opt Lett 2016;41:2907–10.10.1364/OL.41.002907Suche in Google Scholar PubMed
[107] Herr T, Brasch V, Jost JD, et al. Mode spectrum and temporal soliton formation in optical microresonators. Phys Rev Lett 2014;113:123901.10.1103/PhysRevLett.113.123901Suche in Google Scholar PubMed
[108] Kordts A, Pfeiffer MHP, Guo H, Brasch V, Kippenberg TJ. Higher order mode suppression in high-Q anomalous dispersion sin microresonators for temporal dissipative Kerr soliton formation. Opt Lett 2016;41:452–5.10.1364/CLEO_SI.2016.SW4E.2Suche in Google Scholar
[109] Grudinin IS, Huet V, Yu N, Matsko AB, Gorodetsky ML, MalekiL. High-contrast Kerr frequency combs. Optica 2017;4:434–7.10.1364/OPTICA.4.000434Suche in Google Scholar
[110] Bao C, Xuan Y, Leaird DE, Wabnitz S, Qi M, Weiner AM. Spatial mode-interaction induced single soliton generation in microresonators. Optica 2017;4:1011–5.10.1364/OPTICA.4.001011Suche in Google Scholar
[111] Yi X, Yang Q-F, Zhang X, Yang KY, Li X, Vahala KJ. Single-mode dispersive waves and soliton microcomb dynamics. Nat Commun 2017;8:14869.10.1364/CLEO_SI.2017.SW4N.2Suche in Google Scholar
[112] Yang Q-F, Yi X, Yang KY, Vahala K. Spatial-mode-interaction-induced dispersive waves and their active tuning in microresonators. Optica 2016;3:1132–5.10.1364/OPTICA.3.001132Suche in Google Scholar
[113] Liang W, Savchenkov AA, Ilchenko VS, et al. Generation of a coherent near-infrared Kerr frequency comb in a monolithic microresonator with normal gvd. Opt Lett 2014;39:2920–3.10.1364/OL.39.002920Suche in Google Scholar PubMed
[114] Xue X, Qi M, Weiner AM. Normal-dispersion microresonator Kerr frequency combs. Nanophotonics 2016;5:244–62.10.1515/nanoph-2016-0016Suche in Google Scholar
[115] Lobanov V, Lihachev G, Kippenberg TJ, Gorodetsky M. Frequency combs and platicons in optical microresonators with normal GVD. Opt Express 2015;23:7713–21.10.1364/OE.23.007713Suche in Google Scholar PubMed
[116] Jang JK, Okawachi Y, Yu M, et al. Dynamics of mode-coupling-induced microresonator frequency combs in normal dispersion. Opt Express 2016;24:28794–803.10.1364/OE.24.028794Suche in Google Scholar PubMed
[117] Xue X, Wang P-H, Xuan Y, Qi M, Weiner AM. Microresonator Kerr frequency combs with high conversion efficiency. Laser Photon Rev 2017;11:1600276.10.1002/lpor.201600276Suche in Google Scholar
[118] Liu Y, Xuan Y, Xue X, et al. Investigation of mode coupling in normal-dispersion silicon nitride microresonators for Kerr frequency comb generation. Optica 2014;1:137–44.10.1364/OPTICA.1.000137Suche in Google Scholar
[119] Fujii S, Okabe Y, Suzuki R, et al. Analysis of mode coupling assisted Kerr comb generation in normal dispersion system. IEEE Photon J 2018;10:1–11.10.1109/JPHOT.2018.2865417Suche in Google Scholar
[120] Moille G, Li Q, Kim S, Westly D, Srinivasan K. Phased-locked two-color single soliton microcombs in dispersion-engineered Si3N4 resonators. Opt Lett 2018;43:2772–5.10.1364/OL.43.002772Suche in Google Scholar PubMed PubMed Central
© 2020 Takasumi Tanabe et al., published by De Gruyter, Berlin/Boston
This work is licensed under the Creative Commons Attribution 4.0 Public License.
Artikel in diesem Heft
- Editorial
- New trends in nanophotonics
- Reviews
- Optical wavefront shaping based on functional metasurfaces
- Recent advances in optical metasurfaces for polarization detection and engineered polarization profiles
- Research Articles
- Broadband wavelength demultiplexer using Fano-resonant metasurface
- Direction control of colloidal quantum dot emission using dielectric metasurfaces
- Observation of an exceptional point in a non-Hermitian metasurface
- Review
- Deep learning enabled inverse design in nanophotonics
- Research Articles
- Simulator-based training of generative neural networks for the inverse design of metasurfaces
- Direct detection of charge and discharge process in supercapacitor by fiber-optic LSPR sensors
- Differentiating and quantifying exosome secretion from a single cell using quasi-bound states in the continuum
- Review
- Dispersion engineering and measurement of whispering gallery mode microresonator for Kerr frequency comb generation
- Research Article
- Plasmonic electro-optic modulator based on degenerate semiconductor interfaces
- Reviews
- Multipole and multimode engineering in Mie resonance-based metastructures
- 3D and 4D printing for optics and metaphotonics
- Photonic flat-band lattices and unconventional light localization
- Research Article
- From symmetric to asymmetric bowtie nanoantennas: electrostatic conformal mapping perspective
- Review
- Tunable nanophotonics enabled by chalcogenide phase-change materials