Summer temperature and precipitation govern bat diversity at northern latitudes in Norway
-
Tore Christian Michaelsen


Abstract
This study investigated bat diversity in a temperature and precipitation gradient in fiord and valley landscapes of western Norway about 62° N. Equipment for automatic recording of bat calls was distributed in areas ranging from lowlands to alpine habitats with a mean July temperature range of 8–14°C. A general description of species distribution was given and diversity was analysed using both a generalised linear model (GLM) and a mixed-effects model (GLMM). With regard to the sampling design, the data were analysed on a binary scale, where presence or absence of any species other than the northern bat Eptesicus nilssonii is included. Models including temperature and precipitation explain 79% (GLM) to 91% (GLMM) of the overall variation in bat diversity. In sub-alpine and alpine areas with temperature below 10°C, only the northern bat was found. This species also forms maternity roosts where mean July temperatures are as low as 11°C and 10°C, below July temperatures found in the warmest areas beyond the Arctic Circle.
Introduction
Bat diversity is negatively correlated with latitude, a surrogate factor for temperature and light conditions (Kaufman and Willig 1998, Ulrich et al. 2007, Michaelsen et al. 2011). In northern Europe, both summer and winter temperatures drop with latitude, the duration of summer shortens, and the length of summer nights decreases and is finally void. These factors should strongly affect energy budgets and thus survival and ability to successfully reproduce in sedentary bats (e.g., Speakman 1991, Hamilton and Barclay 1994, Jones and Rydell 1994, Rydell et al. 1996, Humphries et al. 2002, Lourenço and Palmeirim 2004, Frafjord 2007, 2012a,b, Michaelsen et al. 2011). For a given latitude, temperature varies with several factors, the most obvious being altitude (Schönwiese and Rapp 1997, Moen 1999). Although altitude itself can be a significant explanatory factor of both local distribution and reproduction (e.g., Stutz 1989, Syvertsen et al. 1995, Cryan et al. 2000, Russo 2002, Kanuch and Kristin 2006, Michaelsen 2010), it can make no universal statement about bat distribution over wider areas (Michaelsen et al. 2011).
To the north and beyond the Arctic Circle, only the northern bat Eptesicus nilssonii (Keyserling and Blasius, 1839) forms lasting reproducing populations (Rydell 1993, Rydell et al. 1994, Frafjord 2001, 2012a, Gerell and Rydell 2001). Most other European bat species are rare or void long before reaching this climatic landmark (Mitchell-Jones et al. 1999, Dietz et al. 2007), and only a few extreme records of other species are reported far north (Siivonen and Wermundsen 2008). In Norway, relatively high bat diversity can be found between 62° and 63° north, but the northern bat is the most recorded bat (Olsen 1996, Isaksen et al. 2009). In southern Norway, the northern bat seems to be almost omnipresent below the treeline (Gjerde and Fuszara 1995, Michaelsen et al. 2003, Michaelsen and van der Kooij 2006). Remarkably, few records exist from sub-alpine and alpine areas (e.g., Gjerde and Fuszara 1995, Lie and Skåtan 1999).
In central Europe, the northern bat has a patchy distribution and its main distribution is in elevated areas (Jaberg and Guisan 2001, Kanuch and Kristin 2006, Piksa and Nowak 2013, Piksa et al. 2013). At least in some parts of central Europe, competition with species sharing similar foraging behaviour may explain this patchy distribution (Haupt et al. 2006). As all of the species likely to compete with the northern bat (see Haupt et al. 2006) are rare at northern latitudes, one should assume distribution to be either marginally or not affected by competition.
This study was threefold. First, through recording bat calls using data-loggers over a temperature and precipitation gradient, binary models were made to identify important climatic factors affecting bat diversity. The northern bat was excluded from statistical analysis, but was included in descriptive statistics. The aim was to find boundaries for when diversity can be expected in this landscape, i.e., where more than just the northern bats can be found. Second, attempts were made to estimate how much of the deviance these models and their predictor variables explain, applying different approaches to obtain the R2 parameter. Light conditions were accounted for in the study design by selecting a study area with glacially carved fiords and valleys shaded by tall surrounding mountains to the north. Third, the results obtained here were compared with previous knowledge of diversity in the region, including known colonies and distribution patterns.
Materials and methods
Study area
This study was conducted during a relatively warm period in six valleys in western Norway around 62° N in July 2013. Owing to its complex topography and position relative to the North Atlantic Current, this area has more geographic regions defined by vegetation than any neighbouring countries in Scandinavia and Finland. Steep mountain slopes have left the bulk of the land area unspoilt by man, and only small patches of farmland and settlements exist. Unlike most of Europe (except for mountainous regions), no large fields are found. Relatively steep valleys were selected, where conditions such as precipitation and oceanic influence would vary relatively little within each valley. Moreover, all areas studied have tall mountains blocking out the sun well before sunset and after sunrise. This factor can influence bat distribution and behaviour at these latitudes (Michaelsen et al. 2011). Available publications from the study area (Gjerde and Fuszara 1995, Olsen 1996, Michaelsen 2003, 2012, Michaelsen et al. 2003, 2004a,b, Michaelsen and van der Kooij 2006, Isaksen et al. 2009) suggest that bats can be found in all available landscapes and habitats, ranging from alpine areas to coastal plains with only bracken vegetation, cliffs, cities, roads (street lamps), cultivated areas, freshwater and marine shores, woodlands (all sorts), coastal islands and more. During summer, most species and the highest densities are found close to freshwater and other water sources with low salinity in the warmest parts of the landscape (Michaelsen 2012). At least some species seem to avoid open habitats (Michaelsen et al. 2011). Most efforts in mapping bats stem from lowland areas, but altitudinal records suggest that at least northern bats occasionally can be found up to about 900 m.a.s.l. and just above the treeline (Gjerde and Fuszara 1995). This would include mean July temperatures as low as approximately 9°C based on the coordinates and altitude reported by Gjerde and Fuszara (1995).
A total of 10 of Norway’s 13 species have been confirmed at about 62° N in the study area (see Gjerde and Fuszara 1995, Michaelsen et al. 2003, 2004a,b, Michaelsen and van der Kooij 2006, Michaelsen 2012). Northern bats, soprano pipistrelles [Pipistrelluspygmaeus (Leach, 1825)], Daubenton’s bat [Myotisdaubentonii (Kuhl, 1817)] and whiskered bats [M. mystacinus (Kuhl, 1817)] are common or fairly common. Brandt’s bat [M. brandtii (Eversmann, 1845)] has been recorded only in northern parts in the study area, but not in any of the valleys investigated in this study. Uncommon or rarely recorded species are noctules [Nyctalus noctula (Schreber, 1774)], parti-coloured bats (Vespertilio murinus Linnaeus, 1758) and brown long-eared bats (Plecotus auritus Linnaeus, 1758). Few records exist of the Nathusius’ pipistrelle [P. nathusii (Keyserling and Blasius, 1839)] and only one recording of serotine (Eptesicus serotinus Schreber, 1774) has been made, all during autumn and only on islands along the coast. The three species found in Norway but not in the study area are the barbastelle [Barbastellabarbastellus (Schreber, 1774)], Natterer’s bat [M. nattereri (Kuhl, 1817)] and the common pipistrelle [P. pipistrellus (Schreber, 1774)], all found at single sites in recent years (Flåten and Røed 2007, Isaksen 2007, van der Kooij et al. 2009).
Automatic recording of bats
Automatic recordings of bat calls were made using the batcorder-system (EcoObs, Nürnberg, Germany) and D500 detectors (Pettersson Elektronik AB, Uppsala, Sweden). Up to seven units from the same manufacturer were deployed each night within the same valley covering the entire temperature gradient selected, ranging from 8 to 14°C mean July temperatures (Table 1). In these valleys, a total of 45 sites had ultrasound loggers deployed, each site with known mean July temperature and mean July precipitation. Where the 45 loggers were deployed, the total variation in mean July precipitation varied from 75 to 150 mm (Table 1). The climate variables were retrieved from shape-files based on 30 years normal (1961–1990) provided by the Norwegian Meteorological Institute. Models behind the shape files are described in detail in Tveito et al. (2000). At present, there are no available shape files showing the variation in precipitation during the 24-h cycle. The precipitation variable used in this study does not discriminate between any such temporal variations, but was still considered as being suitable for the following reason: significant precipitation in this region is, to a great extent, caused by low pressures hitting the coast from southwest, yielding longer durations of rainfall (normally 12 h or longer) (e.g., Hanssen-Bauer et al. 2009). Thus, significant precipitation under current climates is generally not caused by events that would have little effect on bats (e.g., short afternoon showers).
Names of the six Norwegian valleys sampled in this study with coordinates, mean July temperature/precipitation ranges retrieved from GIS files provided by The Norwegian Meteorological Institute and number of recording sites in each valley.
| Valley name | Coordinates (centered) | Temperature range (°C) | Precipitation range (mm) | Sites within each valley |
|---|---|---|---|---|
| Strynedalen | N61.91651 E7.10980 | 8–14 | 75 | 7 |
| Strandadalen | N62.25334 E6.89804 | 11–14 | 75–125 | 4 |
| Holedalen | N62.04720 E6.95259 | 9–14 | 75–100 | 7 |
| Kalvassdalen | N62.04185 E6.39885 | 11–14 | 125–150 | 4 |
| Rødalen | N62.20781 E7.47244 | 9–14 | 75–100 | 6 |
| Valldalen | N62.33780 E7.43362 | 8–14 | 75–100 | 17 |
At two sites, batteries did not sustain through the night, so they were excluded from the data set and from this table. In Valldalen, loggers were deployed for more than one night.
Each unit was placed <100 m from a river and along woodland edge, a preferred habitat for many species, and care was taken to find similar structures for all units within the same valley. The selected areas had continuous woodland throughout the selected valleys and beyond, only fragmented by narrow roads or rivers. Bats should not have any problems moving from any site within a valley to the site where the loggers were deployed. At temperatures about 8–9°C, woodland was patchy only in low alpine habitats. Here, most tree species assumed bush-shaped structures except for rowan (see Moen 1999 for further definitions of alpine habitats). In this habitat, loggers were placed at the edge of such bush-habitats. The time of deployment of loggers was from July 10 to 27, a time that would cover the lactation period before the young are weaned at these latitudes (author’s unpublished data). Loggers were deployed for only one night per site. In one valley, Valldalen, recording was performed over a period of two additional nights with temperatures ranging from 8 to 10°C. Data were collected only on nights considered to be suitable for bats (see Fischer et al. 2009 for relevance to the statistical outcome).
On both hardware systems, recording time was set to start at 21:00 h (minimum of 1 h and 31 min before sunset) and end at 05:00 h (minimum of 19 min after sunrise) local time. With the batcorder II-system (v. 2.0), the default settings were used: quality=20, threshold=-27 dB, post-trigger=400 ms, critical frequency=16 kHz. With the D500 units (v. 2.2.5), the following settings were applied: sampling frequency=500, pre-trigger=off, recording length=3 s, high pass filter=yes, t.sense=medium. The input gain was set to 30, trigger level to 28, and allowed for continuous recording (no pause between each recording).
Post processing
Two software systems were used to process the recorded files from the units. bcAdmin (EcoObs, Nürnberg, Germany) was used only to convert raw-files recorded by the batcorder-system to wave files, and SonoChiro (v.3.2.3. with Qt. 4.8.4., compiled 17 October 2013; Biotope, Mèze, France) was applied to all analysis of ultrasound. The northern boreal package was utilized to narrow down the species included in the analysis (see SonoChiro Team 2013). Information following each recording was as follows: identification to group and/or species level with confidence indexes (0–10), quality of recording (0–10), peak frequency (mean of N pulses), pulse interval (mean of N pulses), presence of feeding buzz, presence of social calls and more (SonoChiro Team 2013). A total of 6208 recordings were identified by the software to contain bat calls from one or more species. From these recordings, SonoChiro produced a csv file with 6701 rows, each with an identification of a bat species. The software indicated the possibility that a second species was present in 488 recordings and even a third species in five recordings. Manual analysis (see Skiba 2009, Middleton et al. 2014) was performed on all these recordings, and further recordings suggesting uncommon species (noctules, parti-coloured bat, Nathusius’ pipistrelle and brown long-eared bat), species never found in the study area (the pond bat, Myotis dasycneme (Boye, 1825), and Natterer’s bat) and recordings suggested to be northern bat with mean frequency outside the range of 28–35 kHz. A total of 699 wave files were analysed manually. Manual analysis reduced the number of recordings with more than one species to 96 and no recordings with three species were found. Two recordings could not be identified to genus and one recording had no bat calls. After manual analysis of bat calls, the total number of rows in the dataset were N=6302 and all were included in further analysis. Each of the 45 sites investigated using ultrasound detectors were then assigned with either presence (1) or absence (0) of bats (excluding the northern bat).
Roosts and distribution of captured bats
Maternity roosts of the most common species in the study area were found through radio telemetry, through inspections of roosts following reports from the public or by random observations during fieldwork. Moreover, several bats were captured and banded at their hunting grounds in the study area in June and July from 2004 to 2012, almost exclusively at temperatures ranging from 13–14°C (mean July). In 2014, some effort was made using a Sussex Autobat lure (David Hill/University of Sussex, Brighton, UK) to increase the knowledge of reproductive status and distribution of the sexes at temperatures below 13°C (mean July) at 62° north.
Statistics
All statistics were performed using R v. 3.0.2 (R Core Team 2013). In the first step, a full generalised linear model (GLM) containing both mean July temperatures and mean July precipitation, including an interaction term and a quadratic term for precipitation, was fitted as predictors to the data. The response was a binary variable indicating either the presence of bats (1) or the absence (0) at each site where detectors were deployed. The northern bat was excluded (see the Discussion section for exclusion arguments). Model simplification (backward selection) was performed by dropping one variable at a time with the ANOVA-command and Chi-tests. The second-order Akaike information criterion (AICc) (Burnham and Anderson 2002) was used as inspection criterion (with the MuMIn package) (Barton 2013) and Area under an ROC curve (AUC) to evaluate the performance of each fitted model (R330 package) (Lee and Robertson 2012). Nagelkerke’s R2 (fmsb package) (Nakazawa 2013) was presented as an estimate of the explained deviance of fitted GLM.
In addition to the GLM, a generalized linear mixed-effects model (GLMER with the lme4 library) (Bates et al. 2013) was fitted to the data. Here, temperature was the only fixed effect and precipitation was fitted as a random effect. Both conditional and marginal
With regard to the sampling design, signs of spatial autocorrelation were tested on Pearson residuals in the final model objects using Mantel tests provided in the ade4 package (Dray and Dufour 2007).
Results
Recorded species and genera
Bats species other than the northern bat were recorded at sites with mean July temperatures as low as 10°C (Table 2A). This record included the soprano pipistrelle and Myotis bats (possibly several species). As expected, more than one species were recorded in all the seven 13–14°C sites. Around and above the treeline in sub-alpine and low alpine areas at 8 and 9°C, only the northern bat was recorded in 10 out of the 13 sites. Northern bat maternity roosts were found at three locations in areas with mean July temperatures as low as 10 and 11°C (Table 2B). Maternity roosts and lactating females of other species were found in sites with temperatures as low as 12°C (the whiskered bat) and 13°C (the soprano pipistrelle and the Daubenton’s bat) (Table 2B). Neither maternity roosts nor lactating females of the brown long-eared bat were found in the valleys included in this study, but lactating females were captured elsewhere at these latitudes in areas with mean July temperatures above 12°C (author’s unpublished data).
(A) Recorded species within the temperature range of the six Norwegian valleys sampled in this study. (B) Number and reproductive status of bats captured and banded in their hunting grounds and maternity roosts found within a temperature range around the valleys Valldalen, Rødalen and Kalvassdalen in the study area from 2004 to 2014.
| A Valley | Temperature (°C) | ||||||
|---|---|---|---|---|---|---|---|
| 14 | 13 | 12 | 11 | 10 | 9 | 8 | |
| Strynedalen | En-M (29) | En-Pp-M (54) | En-Pp (15) | En-Pp-M (157) | En-M (10) | En (60) | En (67) |
| Strandadalen | En-Pp-M (758) | En-Pp-M (194) | En (4) | (0) | |||
| Holedalen | En-Pp-M (273) | En-Pp-M (60) | En (71) | En-M (29) | En-M (21) | (0) | |
| Kalvassdalen | En-Pp-M (183) | En-Pp-M (34) | En (21) | (0) | |||
| Rødalen | En-Pp-M (1056) | En-Pp-Pa-M (40) | En-Pp-M(52) | En-M (68) | En (22) | En (191) | |
| Valldalen | En-Pp-M (120) | En-Pp-M (960) | En-M (28) | En-Pp-M (1308) | En-Pp-M (343) | En (58) | En (16) |
| B Captured bats | Temperature (°C) | ||||||
| 14 | 13 | 12 | 11 | 10 | 9 | 8 | |
| Myotis daubentonii | 10F+5Ma | 12F+2Ma | 1M | ||||
| Myotis mystacinus | a | a | 6F+5Ma | ||||
| Eptesicus nilssonii | 19F+8Ma | 1Fa | b | 2F+3Ma | 1Mb | ||
| Pipistrellus pygmaeus | 77F+22Ma | 4F+1Ma | 1M | 3M | |||
(A) En, Eptesicus nilssonii; Pp, Pipistrellus pygmaeus; Pa, Plecotus auritus; M, Myotis sp. Number of rows produced by SonoChiro with identification to species and/or genus is listed in parenthesis (N=6302). (B) F, pregnant/lactating female; M, male. Maternity roosts confirmed by tracking pregnant or lactating females using radio telemetry, by capturing bats during emergence/entrance or by direct observations of pups at roost are marked with «a». Maternity roosts identified without trapping or observation of pups are marked with a single «b» (relevant only for the northern bat).
Models and deviance explained
A GLM fitted to the data suggests that mean July temperatures have a significant positive effect and mean July precipitation a significant negative effect on bat diversity (Figure 1). The AICc, AUC and R2 values for fitted models with significant terms are listed in Table 3, and parameter estimates, errors and p-values of the final model in Table 4A. The GLM, including both temperature and precipitation without an interaction or quadratic term, was the most parsimonious model and explained an estimated 79% of the variation in the dataset. AUC suggests a very good performance of the final model (Table 3).
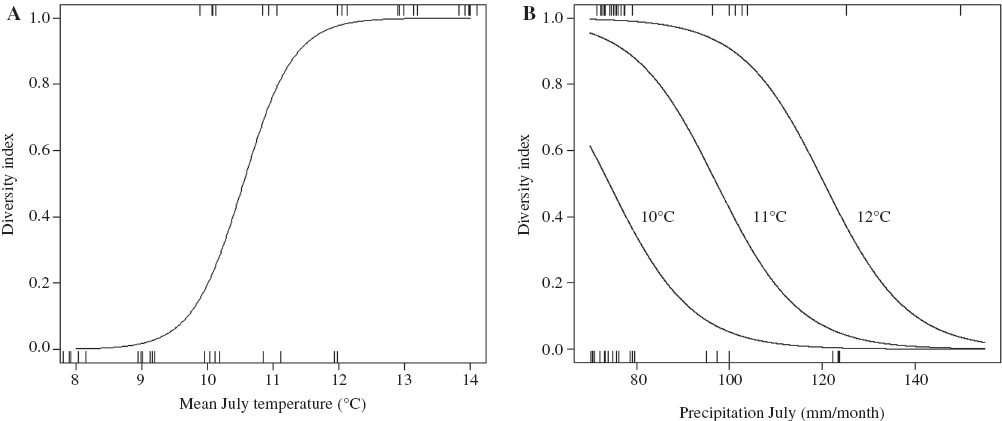
Predicted values (lines) of finding other species than the northern bat in temperature (A) and precipitation (B) gradients (x-axis) based on the GLM-model. Each tick represents one of the 45 sites where ultrasound loggers were deployed. The figure predicting the effect of temperature is based on a separate GLM-model fit including temperature as a single factor with average precipitation values. The figure presenting precipitation shows predicted values only in the temperature range where variation in diversity was found during this study (from 10 to 12°C).
Backward selection with AICc, AUC and estimated deviance explained in the GLM using Nagelkerke’s R2.
| Fitted predictors | AICc | AUC | R2 |
|---|---|---|---|
| Temperature*precipitation | |||
| Precipitation | 66.25637 | 0.28 | 0.0063 |
| Temperature | 39.33351 | 0.87 | 0.6047 |
| Temperature+precipitation | 28.7076 | 0.95 | 0.7871 |
The full model with interaction term (temperature*precipitation) and a model with a quadratic term for precipitation were not significant and are omitted.
Parameter estimates, errors and p-values of the GLM (A) and the GLMER (B). In the GLMER, July temperature was fitted as fixed effect and mean July precipitation as a random effect.
| Parameter estimate | Standard error | Z-value | p-Value | |
|---|---|---|---|---|
| A (GLM) | ||||
| (Intercept) | -17.66510 | 6.89674 | -2.561 | 0.01043 |
| Temperature | 2.59765 | 0.95056 | 2.733 | 0.00628 |
| precipitation | -0.11215 | 0.04432 | -2.531 | 0.01139 |
| B (GLMER) | ||||
| (Intercept) | -28.7427 | 9.2880 | -3.095 | 0.00197 |
| Temperature | 2.5345 | 0.8137 | 3.115 | 0.00184 |
Both temperature and precipitation are mean values for July (in °C and mm, respectively) from 1961 to 1990 normals.
In the GLMER, where mean July temperatures were fitted as a fixed effect and precipitation as a random effect, dropping temperature from the model yielded a significant increase in ΔAICc (32.87167) as expected and suggested by the GLM. Marginal
There was no significant effect of spatial autocorrelation when tested on residuals of fitted models in neither the GLM (p=0.4566) nor the GLMER (p=0.8847).
Discussion
The important effect of temperature on diversity as found in this study was highly anticipated based on general theories on bat distribution (Kaufman and Willig 1998, Ulrich et al. 2007, see also Michaelsen et al. 2011). However, common occurrence of northern bats in alpine habitats and the relatively wide distribution of other species were not expected. This study shows that Pipistrellus (here only P. pygmaeus) and Myotis bats (possibly several species) can be found in areas with mean July temperatures as low as 10°C. Previously, these genera have been found during summer only in lowlands (below 400 m.a.s.l.) with mean July temperatures about 12°C or warmer (Michaelsen et al. 2003). This is also true for maternity roosts of all species other than the northern bat. For some species, in particular the soprano pipistrelle, the few records of calls made at temperatures ranging from 10 to 12°C in this study probably stem from males. Records of trapped bats and absence of reported maternity roosts at least give some support to this assumption. Female soprano pipistrelles will venture to higher altitudes in autumn during mating season in this region (Michaelsen 2010) and pass by these males, thus this male strategy could pay off. For Myotis species, no useful information on reproduction (or occurrence of females) exists in climates below 12°C. Bats of this genus were found in areas with temperatures as low as 10°C, and possible reproduction cannot be excluded over a wider range of temperatures. It is a drawback that Brandt’s bat is probably missing in the bulk of the study area. This species seems to have a slightly more northern distribution than the whiskered bat in Scandinavia (Dietz et al. 2007) and could be more tolerant of cooler summer climates. Both noctules and parti-coloured bats were recorded by ultrasound detectors combined with direct visual observation in the study area, but rarely so in the bottom of fiords or valleys (Michaelsen 2007). One could assume that the method used here would be less efficient in detecting these two high-flying species (e.g., Collins and Jones 2009).
Based on the data collected during this study, only northern bats prevail in areas where mean July temperatures are below 10°C. Furthermore, the results suggest that the northern bat has a wide distribution at areas with temperatures below 10°C and above the treeline in low alpine areas in southern Norway. This finding is in contrast to previous knowledge, where such observations have been highlighted as exceptions (e.g., Gjerde and Fuszara 1995). Owing to this unexpected omnipresence of the northern bat throughout the selected temperature range, no model aiming at identifying boundaries for the species distribution was fitted. If the species reproduces at mean July temperatures as low as 8°C is unknown, but should not be ruled out. In some lowland areas North of the Arctic Circle (AC), mean July temperatures can still reach 13°C (see Tveito et al. 2000). Northern bats reproducing at temperatures as low as they do in this study area do so in summer climates colder than many lowland areas north of the AC. Bats in fiords and valleys in western Norway have several advantages not available to bats near the AC and beyond. First, northern bats can exploit the warmer temperatures in lowlands in spring and autumn when higher altitudes still have snow cover, thus they do not rely on suitable conditions at their breeding grounds except in July and August. Seasonal use of the altitudinal gradient has been observed in other species in the study area (Michaelsen 2010). Whether northern bats undertake such seasonal movements remains to be tested. Assuming such behaviour, pups should be born around the same time throughout the temperature gradient and the assumption can be tested in future studies. Second, northern bats in western Norway always occur within short distances to areas with mean January temperatures above 0°C and a relatively long growth season, much unlike their counterparts above the AC. Thus, the northern bats in the study area are unlikely to be limited by suitable hibernation sites nearby. The results obtained in the present study at least indicate that temperatures during lactation may not be the factor limiting the distribution of the northern bat beyond the AC, and other factors such as winter survival, short time for reproduction and risk of predation during flights in daylight conditions are more likely explanatory factors (see also Frafjord 2012a).
Bats living towards the north have to deal with several factors, including low temperatures and short nights, influencing their time budgets during summer. Moreover, due to short summers, the time available to reproduce for these bat species is highly limited compared with that for their counterparts at more southern latitudes. Precipitation will further affect an already strained time budget by denying bats foraging time on rainy nights. At least for reproducing females living towards their temperature limits, selecting those areas with less precipitation is likely to be beneficial. This study aimed at distributing the ultrasound loggers over a range of temperatures. The range in precipitation did not cover the range actually available at these latitudes. Furthermore, the data show that there was no variation in diversity in the warmest parts of the landscape (Table 2A), although mean July precipitation within this range of temperatures varied from 75 to 150 mm. These drawbacks should be appreciated when considering this variable and further efforts should be undertaken to better understand when and how precipitation affects bats towards their northern limits.
Both present and previous knowledge from this region of Europe is much limited when assessing distribution of the sexes or limits for reproduction in most species, including the most common species and the northern bat, which may or may not reproduce in present-day alpine areas. Future studies should focus on significantly increasing the number of sampling sites so that diversity could be analysed as counts and proportions. This should be done using several combinations of approaches (e.g., Flaquer et al. 2007, Fischer et al. 2009), and not only by using automatic recording devices for only on a single night per site, which would have some evident drawbacks (e.g., Collins and Jones 2009, Fischer et al. 2009, Matos et al. 2013, see also Adams et al. 2012). Trapping and sexing of bats and searching for maternity roosts should be conducted to more precisely identify boundaries for reproduction in all occurring species at mean July temperatures below 13°C. Identifying time of birth in colonies of northern bats over a temperature gradient could provide useful information about possible seasonal use of temperature gradients in this species in areas with complex topography. Bat workers should focus more on mapping bats in colder parts of the gradient, although this approach is expected to obtain relatively low (or possibly no) diversity at present time, thus providing future researchers with valuable data in a changing world.
Supplementary material: The dataset used in this study (wave files with coordinates) can be made available to researchers through The Global Biodiversity Information Facility and is stored by The Norwegian Biodiversity Information Centre under the name «BatClimate62North».
Acknowledgments
I am grateful to Tor-Amund Røsberg, Karl Johan Grimstad and Oddvar Olsen for assistance during field work. Kjell Isaksen and Neil Middleton gave their evaluation of some recordings difficult to identify. Göran Högstedt, Knut Helge Jensen and two anonymous reviewers provided useful comments to the manuscript. The Norwegian Directorate for Nature Management (SNO/Miljødirektoratet) put to my disposal the necessary equipment, and The Norwegian Action Plan for Bats funded the study. Pettersson Elektronik (Sweden), EcoObs (Germany) and The SonoChiro Team (France) provided useful support on how to obtain the best results using their hardware and software.
References
Adams, A.M., M.K. Jantzen, R.M. Hamilton and M.B. Fenton. 2012. Do you hear what I hear? Implications of detector selection for acoustic monitoring of bats. Meth. Ecol. Evol. 3: 992–998.10.1111/j.2041-210X.2012.00244.xSuche in Google Scholar
Barton, K. 2013. MuMIn: multi-model inference. R package version 1.9.13. http://CRAN.R-project.org/package=MuMIn.Suche in Google Scholar
Bates, D., M. Maechler, B. Bolker and S. Walker. 2013. lme4: linear mixed-effects models using Eigen and S4. R package version 1.0-5. http://CRAN.R-project.org/package=lme4.Suche in Google Scholar
Burnham, K.P. and D.R. Anderson. 2002. Model selection and inference: a practical information theoretic approach. Springer Verlag, New York, NJ. pp. 488.Suche in Google Scholar
Collins, J. and G. Jones. 2009. Differences in bat activity in relation to bat detector height: implications for bat surveys at proposed windfarm sites. Acta Chiropterol. 11: 343–350.10.3161/150811009X485576Suche in Google Scholar
Cryan, P.M., M.A. Bogan and J.S. Altenbach. 2000. Effect of elevation on distribution of female bats in the Black Hills, South Dakota. J. Mammal. 81: 719–725.Suche in Google Scholar
Dietz, C., O. von Helversen and D. Nill. 2007. Handbuch der Fledermaüse Europas und Nordwestafrikas. Franckh-Cosmos, Stuttgart, Germany. pp. 399.Suche in Google Scholar
Dray, S. and A.B. Dufour. 2007. The ade4 package: implementing the duality diagram for ecologists. J. Stat. Software 22: 1–20.10.18637/jss.v022.i04Suche in Google Scholar
Fischer, J., J. Stott, B.S. Law, M.D. Adams and R.I. Forrester. 2009. Designing effective habitat studies: quantifying multiple sources of variability in bat activity. Acta Chiropterol. 11: 127–137.10.3161/150811009X465749Suche in Google Scholar
Flaquer, C., I. Torre and A. Arrizabalaga. 2007. Comparison of sampling methods for inventory of bat communities. J. Mammal. 88: 526–533.10.1644/06-MAMM-A-135R1.1Suche in Google Scholar
Flåten, M. and T. Røed. 2007. Barbastelle Barbastella barbastellus is not extinct in Norway! Fauna (Oslo) 60: 142–144 (in Norwegian with English summary).Suche in Google Scholar
Frafjord, K. 2001. Distribution of the northern bat Eptesicus nilssonii above the Arctic Circle in Norway. Fauna (Oslo) 54: 124–131 (in Norwegian with English summary).Suche in Google Scholar
Frafjord, K. 2007. Do northern bats Eptesicus nilssonii prefer heated building as roosts? Fauna (Oslo) 60: 239–245 (in Norwegian with English summary).Suche in Google Scholar
Frafjord, K. 2012a. Influence of night length on home range size in the northern bat Eptesicus nilssonii. Mammal. Biol. 78: 205–211.10.1016/j.mambio.2012.06.005Suche in Google Scholar
Frafjord, K. 2012b. Observations of a merlin (Falco columbarius) hunting Northern bats (Eptesicus nilssonii) in midnight sun (Northern Norway). Nyctalus (N.F.) 17: 107–111.Suche in Google Scholar
Gerell, R. and J. Rydell. 2001. Eptesicus nilssonii (Keyserling et Blasius, 1839) – Nordfledermaus. In: (F. Krapp, ed.) Handbuch der Säugetiere Europas. Band 4: Fledertiere. Teil I: Chiroptera I. Rhinolophidae, Vespertilionidae 1. Aula-Verlag, Wiebelsheim, Germany. pp. 561–581.Suche in Google Scholar
Gjerde, L. and E. Fuszara. 1995. Notes on the distribution of bats (Chiroptera) in Sogn og Fjordane county, Norway. Nordre Øyern biologiske stasjon, Oslo, Norway. pp 38.Suche in Google Scholar
Hamilton, I.M. and R.M.R. Barclay. 1994. Patterns of daily torpor and day-roost selection by male and female big brown bats (Eptesicus fuscus). Can. J. Zool. 72: 744–749.10.1139/z94-100Suche in Google Scholar
Hanssen-Bauer, I., H. Drange, E.J. Førland, L.A. Roald, K.Y. Børsheim, H. Hisdal, D. Lawrence, A. Nesje, S. Sandven, A. Sorteberg, S. Sundby, K. Vasskog and B. Ådlandsvik. 2009. Climate in Norway 2100. The Norwegian climate centre, Oslo, Norway. pp. 148 (in Norwegian).Suche in Google Scholar
Haupt, M., S. Menzler and S. Schmidt. 2006. Flexibility of habitat use in Eptesicus nilssonii: does the species profit from anthropogenically altered habitats? J. Mammal. 87: 351–361.10.1644/05-MAMM-A-193R1.1Suche in Google Scholar
Humphries, M.M., D.W. Thomas and J.R. Speakman. 2002. Climate-mediated energetic constraints on the distribution of hibernating mammals. Nature 418: 313–316.10.1038/nature00828Suche in Google Scholar PubMed
Isaksen, K. 2007. The common pipistrelle Pipistrellus pipistrellus recorded in southwest Norway – a species new to Norway. Fauna (Oslo) 60: 120–132 (in Norwegian with English summary).Suche in Google Scholar
Isaksen, K., M. Klann, J. van der Kooij, T.C. Michaelsen, K.M. Olsen, T. Starholm, C.F. Sunding, M.F. Sunding and P.O. Syvertsen. 2009. Bats in Norway. Recommendation to nation action plan. Report no. 13, The Norwegian Zoological Society, Oslo, Norway. pp. 124 (in Norwegian).Suche in Google Scholar
Jaberg, C. and A. Guisan. 2001. Modelling the distribution of bats in relation to landscape structure in a temperate mountain environment. J. Appl. Ecol. 38: 1169–1181.10.1046/j.0021-8901.2001.00668.xSuche in Google Scholar
Jones, G. and J. Rydell. 1994. Foraging strategy and predation risk as factors influencing emergence time in echolocating bats. Phil. Trans. R. Soc. Lond. B Biol. Sci. 346: 445–455.10.1098/rstb.1994.0161Suche in Google Scholar
Kanuch, P. and A. Kristin. 2006. Altitudinal distribution of bats in the Polana Mts area (central Slovakia). Biologia (Bratislava) 61: 605–610.10.2478/s11756-006-0097-6Suche in Google Scholar
Kaufman, D.M. and M.R. Willig. 1998. Latitudinal patterns of mammalian species richness in the New World: the effects of sampling method and faunal group. J. Biogeogr. 25: 795–805.10.1046/j.1365-2699.1998.2540795.xSuche in Google Scholar
Lee, A. and B. Robertson. 2012. R330: an R package for Stats 330. R package version 1.0. http://CRAN.R-project.org/package=R330.Suche in Google Scholar
Lie, A. and J.E. Skåtan. 1999. Northern bat Eptesicus nilssonii in the high mountains. Fauna (Oslo) 52: 212–213 (in Norwegian with English summary).Suche in Google Scholar
Lourenço, S.I. and J.M. Palmeirim. 2004. Influence of temperature in roost selection by Pipistrellus pygmaeus (Chiroptera): relevance for the design of bat boxes. Biol. Conserv. 119: 237–243.10.1016/j.biocon.2003.11.006Suche in Google Scholar
Matos, M., N.L. Pinto, M.J.R. Pereira and C. Fonseca. 2013. Triggering bat detectors: automatic vs. manual mode. Mammalia 77: 461–466.10.1515/mammalia-2013-0029Suche in Google Scholar
Michaelsen, T.C. 2003. Bat colonies in Møre og Romsdal County. The Møre og Romsdal county governor, Molde, Norway. pp. 46 (in Norwegian).Suche in Google Scholar
Michaelsen, T.C. 2007. First record of the noctule Nyctalus noctula in Sogn og Fjordane county, western Norway. Fauna (Oslo) 60: 292–293 (in Norwegian with English summary).Suche in Google Scholar
Michaelsen, T.C. 2010. Steep altitudinal gradient can benefit lowland bats. Folia Zool. 59: 202–204.10.25225/fozo.v59.i3.a5.2010Suche in Google Scholar
Michaelsen, T.C. 2012. Bat diversity in a fiord landscape in Norway. Fauna (Oslo) 65: 22–28 (in Norwegian with English summary).Suche in Google Scholar
Michaelsen, T.C. and J. van der Kooij. 2006. Bats in Sogn og Fjordane County. Report no. 11, The Norwegian Zoological Society, Oslo, Norway. pp. 28 (in Norwegian).Suche in Google Scholar
Michaelsen, T.C., K.J. Grimstad, K.M. Soot, J. Heggset and J.B. Jordal. 2003. Bats in Møre og Romsdal county. Report no. 10, The Norwegian Zoological Society, Oslo, Norway. pp. 25 (in Norwegian).Suche in Google Scholar
Michaelsen, T.C., K.J. Grimstad and J.E. Anonby. 2004a. Some interesting discoveries of day roosts for bats in Norway. Fauna (Oslo) 57: 54–61 (in Norwegian with English summary).Suche in Google Scholar
Michaelsen, T.C., J.E. Anonby, O. Olsen, K.J. Grimstad and K.M. Soot. 2004b. Bat phenology in western Norway. Fauna (Oslo) 56: 120–130 (in Norwegian with English summary).Suche in Google Scholar
Michaelsen, T.C., K.H. Jensen and G. Högstedt. 2011. Topography is a limiting distributional factor in the soprano pipistrelle at its latitudinal extreme. Mammal. Biol. 76: 295–301.10.1016/j.mambio.2010.12.004Suche in Google Scholar
Middleton, N., Froud, A. and K. French. 2014. Social calls of the bats of Britain and Ireland. Pelagic Publishing, Exeter, England. pp. 176.Suche in Google Scholar
Mitchell-Jones, A.J., G. Amori, W. Bogdanowicz, B. Krystufek, P.J.H. Reijnders, F. Spitzenberger, M. Stubbe, J.M.B. Thissen, V. Vohral¡k and J. Zima. 1999. The atlas of European mammals. Academic Press, London, England. pp. 484.Suche in Google Scholar
Moen, A. 1999. National atlas of Norway: vegetation. The Norwegian Mapping Authority, Hønefoss, Norway. pp. 199.Suche in Google Scholar
Nakagawa, S. and H. Schielzeth. 2013. A general and simple method for obtaining R2 from generalized linear mixed-effects models. Meth. Ecol. Evol. 4: 133–142.10.1111/j.2041-210x.2012.00261.xSuche in Google Scholar
Nakazawa, M. 2013. fmsb: functions for medical statistics book with some demographic data. R package version 0.4.1. http://CRAN.R-project.org/package=fmsb.Suche in Google Scholar
Olsen, K.M. 1996. Bats in Norway. Report no. 2, The Norwegian Zoological Society, Oslo, Norway. pp. 210 (in Norwegian).Suche in Google Scholar
Piksa, K. and J. Nowak. 2013. The bat fauna hibernating in the caves of the Polish Tatra Mountains, and its long-term changes. Centr. Eur. J. Biol. 8: 448–460.Suche in Google Scholar
Piksa, K., J. Nowak, M. Zmihorski and W. Bogdanowicz. 2013. Nonlinear distribution pattern of hibernating bats in caves along an elevational gradient in mountain (Carpathians, Southern Poland). PLoS One 8: e68066.10.1371/journal.pone.0068066Suche in Google Scholar PubMed PubMed Central
R Core Team. 2013. R: a language and environment for statistical computing. R Foundation for Statistical Computing, Vienna.Suche in Google Scholar
Russo, D. 2002. Elevation affects the distribution of the two sexes in Daubenton’s bats Myotis daubentonii (Chiroptera: Vespertilionidae) from Italy. Mammalia 66: 543–551.10.1515/mamm.2002.66.4.543Suche in Google Scholar
Rydell, J. 1993. Eptesicus nilssonii. Mammal. Spec. 430: 1–7.10.2307/3504128Suche in Google Scholar
Rydell, J., K.B. Strann and J.R. Speakman. 1994. First record of breeding bats above the Arctic Circle: northern bats at 68–70° N in Norway. J. Zool., Lond. 233: 335–339.10.1111/j.1469-7998.1994.tb08597.xSuche in Google Scholar
Rydell, J., A. Entwistle and P.A. Racey. 1996. Timing of foraging flights of three species of bats in relation to insect activity and predation risk. Oikos 76: 243–252.10.2307/3546196Suche in Google Scholar
Schönwiese, C.-D. and J. Rapp. 1997. Climate trend atlas of Europe. Kluwer Academic Press, London, England. pp. 228.Suche in Google Scholar
Siivonen, Y. and T. Wermundsen. 2008. Distribution and foraging habitats of bats in northern Finland: Myotis daubentonii occurs north of the Arctic Circle. Vespertilio 12: 41–48.Suche in Google Scholar
Skiba, R. 2009. Europäische fledermäuse. Kennzeichen, Echoortung und Detektoranwendung. Die Neue Brehm-Bücherei, Hohenwarsleben, Germany. pp. 220.Suche in Google Scholar
SonoChiro Team. 2013. Manual of SonoChiro 3.0. Biotope, Research and Development, Biotope Society, Mèze. http://www.leclub-biotope.com/.Suche in Google Scholar
Speakman, J.R. 1991. Why do insectivorous bats in Britain not fly in daylight more frequently? Funct. Ecol. 5: 518–524.10.2307/2389634Suche in Google Scholar
Stutz, H.P.B. 1989. Die Hohenverteilung der Wochenstuben einiger ausgewahlter schweizerischer Fledermausarten (Mammalia, Chiroptera). Rev. suisse Zool. 96: 651–661.10.5962/bhl.part.117772Suche in Google Scholar
Syvertsen, P.O., T.A. Stormark, M. Nordseth and T. Starholm. 1995. A tentative assessment of bat diversity and distribution in Norway. Myotis 32–33: 183–191.Suche in Google Scholar
Tveito, O.E., E.J. Førland, R. Heino, I. Hanssen-Bauer, H. Alexandersson, B. Dahlström, A. Drebs, C. Kern-Hansen, T. Jónsson, E. Vaarby Laursen and Y. Westman 2000. Nordic temperature maps DNMI Report Climate no. 9, The Norwegian Meteorological Institute, Oslo, Norway. pp. 55.Suche in Google Scholar
Ulrich, W., K. Sachanowicz and M. Michalak. 2007. Environmental correlates of species richness of European bats (Mammalia: Chiroptera). Acta Chiropterol. 9: 347–360.10.3161/1733-5329(2007)9[347:ECOSRO]2.0.CO;2Suche in Google Scholar
van der Kooij, J., K. Redford and L.C. Østerby. 2009. Natterer’s bat Myotis nattereri rediscovered in Norway. Fauna (Oslo) 62: 72–79 (in Norwegian with English summary).Suche in Google Scholar
©2016 by De Gruyter
Artikel in diesem Heft
- Frontmatter
- Original Studies
- Summer temperature and precipitation govern bat diversity at northern latitudes in Norway
- Structure of three subtropical bat assemblages (Chiroptera) in the Andean rainforests of Argentina
- Morphology, genetics and echolocation calls of the genus Kerivoula (Chiroptera: Vespertilionidae: Kerivoulinae) in Thailand
- Status and population structure of a hunted population of Marco Polo Argali Ovis ammon polii (Cetartiodactyla, Bovidae) in Southeastern Tajikistan
- Habitat use of Himalayan grey goral in relation to livestock grazing in Machiara National Park, Pakistan
- Characterization and selection of microhabitat of Microcavia australis (Rodentia: Caviidae): first data in a rocky habitat in the hyperarid Monte Desert of Argentina
- Pregastric and caecal fermentation pattern in Syrian hamsters
- Short Notes
- Barn owl pellets collected in coastal savannas yield two additional species of small mammals for French Guiana
- Wiedomys cerradensis (Gonçalves, Almeida, Bonvicino, 2003) (Rodentia, Cricetidae): first record from the state of Maranhão, Brazil
- Morpho-anatomical characteristics of Indian pangolin (Manis crassicaudata) from Potohar Plateau, Pakistan
- First confirmed records of two bat species for Iraq: Rhinolophus euryale and Myotis emarginatus (Chiroptera)
- An efficient timing device to record activity patterns of small mammals in the field
- First record of Leontopithecus chrysopygus (Primates: Callitrichidae) in Carlos Botelho State Park, São Miguel Arcanjo, São Paulo, Brazil