Comprehensive utilization of NMR spectra–evaluation of NMR-based quantification of amino acids for research and patient care
-
Karen Friederike Gauß

 ,
Ralph Krätzner
,
Ralph Krätzner

Abstract
Objectives
In 1H nuclear magnetic resonance spectroscopy (NMR), a single measurement can yield insights into hundreds of metabolites. The use of NMR is expanding in research, with comprehensive datasets readily available. To fully leverage the spectral data, e.g. for amino acid (AA) detection, evaluating the quality of NMR quantification is crucial. For this, we compared the results for 15 AAs obtained from 1H NMR and a clinical HPLC platform.
Methods
1H NMR and HPLC measurements of 15 AAs from 90 samples are compared by Spearman correlation coefficients and Passing-Bablok analysis. Imprecision is evaluated by coefficients of variation based on duplicates.
Results
1H NMR measurements of two AAs show high correlation and good agreement to HPLC measured levels (phenylalanine, alanine). Three more AA measurements reveal high correlation but systematic bias (tyrosine, valine, glycine). NMR results of six investigated AAs are less comparable (ornithine, threonine, histidine, isoleucine, leucine, lysine). Four measurands could not be evaluated (glutamine, glutamic acid, asparagine, methionine).
Conclusions
Analytical quality varies considerably among the investigated AAs. A limited number of AAs show good concordance with results from HPLC supporting selective use of NMR spectra for AA analysis. While NMR holds promise in both research and clinical settings, it is currently not suitable for comprehensive AA monitoring for diagnostic purpose.
Introduction
1H nuclear magnetic resonance spectroscopy (NMR) is one of the principal measurement techniques in detecting metabolites [1], 2]. Within one single measurement NMR spectroscopy is able to capture information on hundreds of metabolites. Some of these are well known in clinical chemistry and laboratory medicine, e.g. creatinine, glucose and lactate. 1H NMR is increasingly used in research settings and large NMR data sets of well-defined cohorts are already available. It is reasonable to make use of all the information contained in the spectra including for example amino acids (AA). Therefore in this study we aimed to investigate the quality of NMR measurements for this important substance class of AAs, especially in the light of a possible use of NMR methods in clinical routine.
AAs are molecules containing an amino group and a carboxyl group that are linked together in long chains and folded to secondary, tertiary and quaternary structures to form proteins. Beside their role as building blocks in protein biosynthesis, AAs serve as precursors for neurotransmitters, hormones and other metabolites [3]. Furthermore, in catabolic metabolism, AAs are utilized as an energy source [4]. Multiple studies show that dysregulated AA levels are found in a wide variety of diseases like cancer or diabetes [5], 6].
In patient care, AAs serve as diagnostic markers for diverse congenital rare diseases like phenylketonuria (PKU) or maple syrup urine disease (MSUD) [7], 8]. For this purpose, exact and reliable AA measurements are necessary. High performance liquid chromatography (HPLC) and mass spectrometry (MS) methods are successfully implemented for AA quantification, see [9], 10] for an overview on these methods. For example, MS-based methods are used in newborn screening [11] because of their high sensitivity. AA analyzed in newborn screening are for example phenylalanine, tyrosine, valine, leucine and isoleucine. Drawbacks for both MS and HPLC methods are a complex sample preparation, intensive maintenance needs and cost-intensive consumables [1], 2], 10].
So far, NMR is applied in research settings only. Drawbacks are high investment costs and the fact that only technicians with special training may operate the instruments. However, advantages like a non-destructive, robust and reproducible measurement with minimal preparation requirements [1], 12] and comparably low costs for maintenance and consumables make it a promising technology for clinical applications. In addition, in view of individualized medicine further medical needs for measuring AAs through NMR may become feasible as technology and knowledge improve.
In this study we compare measurement results for 15 AAs obtained with 1H NMR using automated quantification algorithms provided by the manufacturer to results obtained from a well-established clinical HPLC platform using EDTA-plasma samples from patient care. We aim to investigate the 1H NMR performance in view of clinical and research needs.
Materials and methods
Subjects
Ninety EDTA-plasma samples were collected from left over material of out-patients of a specialized clinic for metabolic diseases at the University Medicine Greifswald in July 2020 (Ethic votum: MN: BB 100/15).
Methods
All samples were subject to two freeze-thaw-cycles since the frozen original samples had to be aliquoted into two sample sets. One sample set was analysed at the University Medicine of Greifswald (1H NMR) and one at the University Medicine of Goettingen (HPLC). A panel of 15 AAs (alanine, asparagine, glutamic acid, glutamine, glycine, histidine, isoleucine, leucine, lysine, methionine, ornithine, phenylalanine, threonine, tyrosine and valine) was measured on both platforms.
Samples were stored at −80 °C until analysis. All measurements were performed in duplicates.
1H NMR measurements
After thawing, 300 μL of plasma were mixed with 300 μL of phosphate buffer [prepared with D2O and contained sodium 3-trimethylsilyl-(2,2,3,3-D4)-1-propionate (TSP) as reference, (pH 7.4)]. Spectra were recorded on a Bruker Avance IVDr system (AVANCE-III 600 NMR spectrometer operated by TOPSPIN 3.6 software (both Bruker Biospin, Ettlingen, Germany) and a 5-mm BBI probe, equipped with a z-gradient and an automated tuning and matching (ATMA) unit (Bruker Biospin, Ettlingen, Germany)). Specimens were automatically delivered to the spectrometer via Sample Jet (Bruker Biospin, Ettlingen, Germany) in standard 5 mm NMR tubes. The settings used correspond to those from the Bruker’s bodyfluid NMR methods package (B.I.Methods2.0, Bruker Biospin, Ettlingen, Germany). The acquisition temperature was set to 310K. A standard one-dimensional 1H NMR pulse sequence with suppression of the water peak (Bruker pulse sequence “noesygppr1d”; NOESY, Nuclear Overhauser and Exchange Spectroscopy) was used. The pulse sequence follows the scheme: RD–gz1–90°–t–90°–tm–gz2–90°–AQ, where RD is the relaxation delay (4 s), 90° denotes a hard 90° RF pulse, t is a short delay (4 µs), tm is the mixing time (10 m s), gz1 and gz2 are magnetic field gradients along the z-axis applied for 1 m s each, and AQ is the acquisition period (2.7 s), during which 98,304 data points are collected with a spectral width (SW) from −10 to 20 ppm.
A low power pulse is applied at the water resonance frequency to saturate the solvent signal during RD and tm. The receiver gain is set at 90.5 for all experiments. For pre-processing, a line broadening of 0.3 Hz, a zero filling to produce 128 k data points and zero order phase correction were applied. Automated quantification of small molecules was performed on the spectra using the Bruker IVDr Quantification in Plasma/Serum Analysis (B.I.Quant-PS2.0, Bruker Biospin, Ettlingen, Germany). The results obtained include, among other measurands, the substance group of AAs. Figure 1 visualizes an example for automated spectra evaluation.
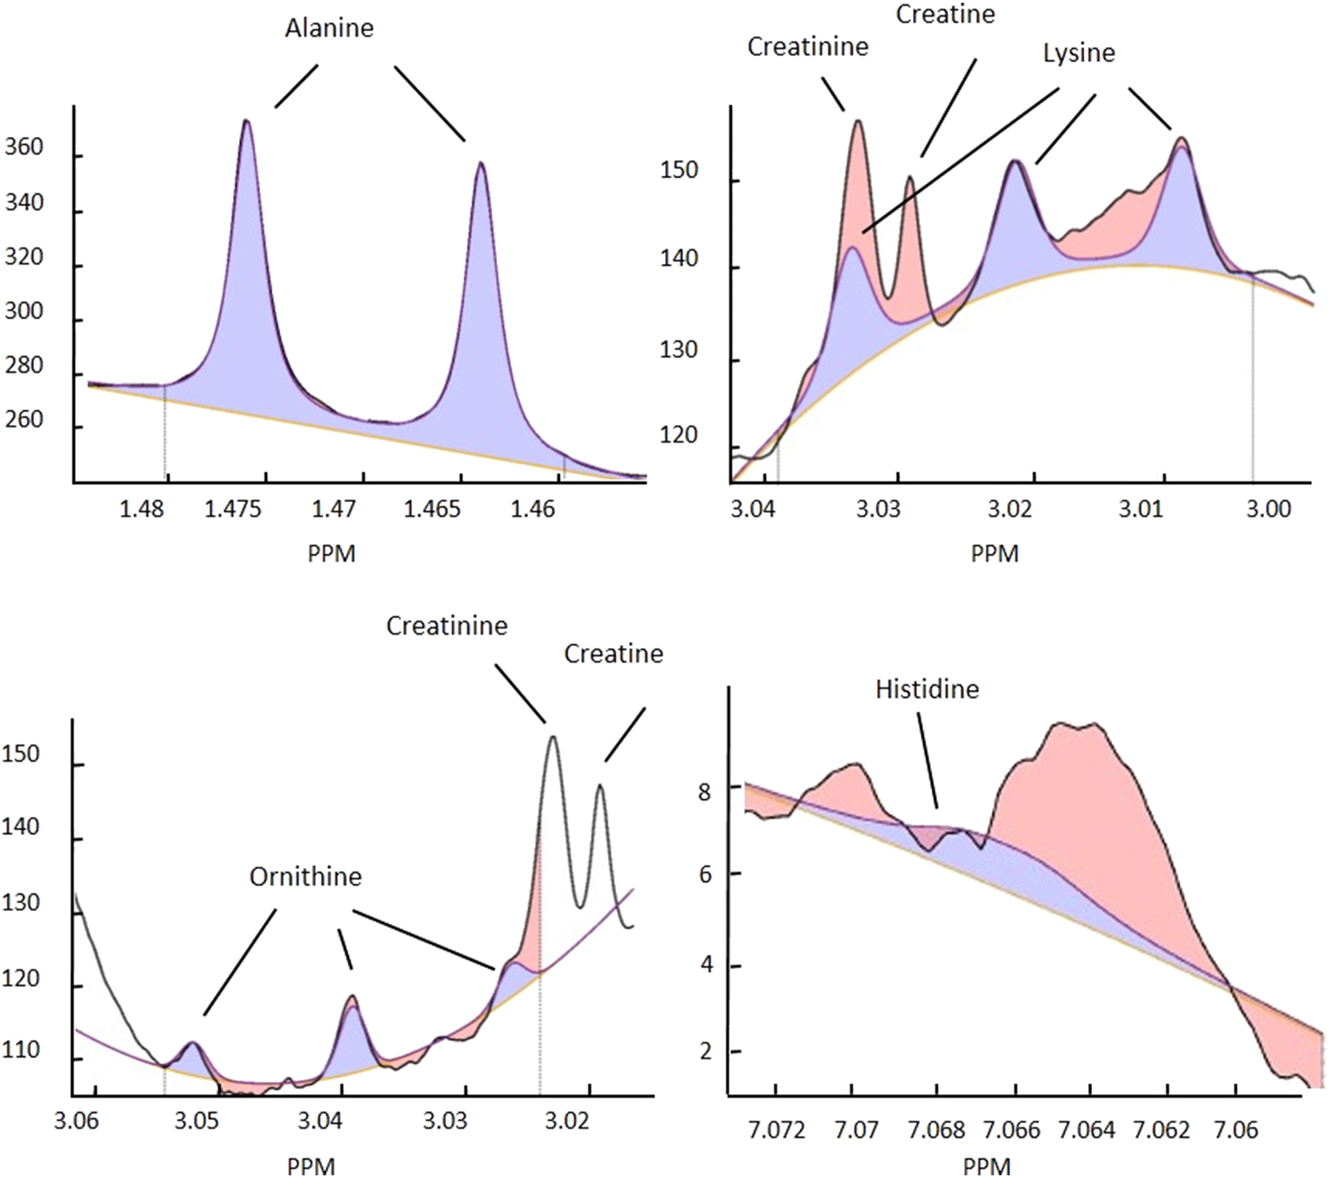
1H NMR signals for alanine, lysine, ornithine and histidine. Black line, original signal; blue line, calculated fit signal; yellow line, baseline. Blue area, area used for quantification; red area, residue (area not used for quantification); e.g. from another signal overlap. Figures modified from Bruker IVDr quantification in plasma/serum B.I.Quant-PS2.0 analysis report.
HPLC measurements
Liquid cationic exchange chromatography on a Biochrom 30 Plus system (Biochrom, Cambridge, UK), a widely established method in medical laboratories was used to measure the study samples. The calibration standard was prepared by mixing three commercially available standard solutions (AS-Kalib. Standard phys., Nr. 5.403.151, AS-Kalib. Standard phys. erg. Nr. 5.403.152, AS-Int. Standard Norleucine Nr. 5.403.156, all Laborservice Onken, Gruendau, Germany) with a freshly prepared solution of l-Glutamine (1 mmol/L, Sigma-Aldrich, G-8540) and l-Asparagine (1 mmol/L, Sigma-Aldrich, A-0844) in 0.1 N HCL. The solution was diluted with loading buffer (Biochrom, Cambrigde, UK) to final concentrations of 50 mmol/L for cystine and 100 mmol/L for the other AAs in the calibration standard. The commercially available ClinCheck plasma controls level I and level II (Recipe Chemicals, Munich, Germany) for AAs were used as internal quality control. 100 µL of patient plasma or quality control were mixed with 50 µL sample buffer for protein precipitation containing sulfosalicylic acid (373.7 mmol/L) and, as internal standard, Norleucine (300 μmol/L). Samples were stored at 4 °C for 30 min and then centrifuged for 4 min at about 21,000 g. For analysis a volume of 20 μL of supernatant was injected. AA concentrations were calculated using the software Agilent OpenLAB (EZChrom Edition), version A.04.09, Build 04.09.53 (Agilent Technologies, Santa Clara, USA).
Statistical analysis
Medians and interquartile ranges (IR: 1st–3rd quartile) were calculated per method and measurand. Duplicate measurements of each method were evaluated by calculation of coefficients of variation (CV in %) according to [13]. All other analyses were conducted with the first of the duplicate measurements each in order to reflect the clinical routine, where only one measurement is available. For comparison of 1H NMR and HPLC measurements, Spearman correlation coefficients were calculated and Passing-Bablok regression was carried out to assess constant differences (regression line intercept) and proportional differences (regression line slope) between the methods. Since concentration levels vary considerably between the different measurands, intercepts were expressed in relation to the median HPLC-measured value in order to assure comparability across the measurands (normalized intercept=100*intercept/medianHPLC [%]). For illustration, scatterplots with the according regression lines are plotted for selected AAs along with reference intervals according to Blau et al. [14]. Statistical analysis was performed using R version 4.3.2 (R Foundation for Statistical Computing, Vienna, Austria. URL https://www.R-project.org/.).
Results
Fifteen AAs were measured in 90 EDTA-plasma samples. In total 360 measurements were performed, 180 on each platform since the EDTA-plasma samples were measured in duplicate. Following recommendations from Bruker Quality Reports, two 1H NMR measurements were excluded. Measurements below the limit of detection (LOD, see Supplementary Table S1) were detected for glutamine (100 %), glutamic acid (98.9 %), asparagine (91.6 %), methionine (74.7 %), threonine (43.8 %), ornithine (34.8 %), lysine (5.6 %), isoleucine (4.5 %) and phenylalanine (0.6 %) on the NMR platform. No such values were found on the HPLC platform. Glutamine, glutamic acid, asparagine and methionine were excluded from further analysis as they exhibited too many values below the LOD in the NMR measurement.
AA concentrations for each of the duplicates for both methods and CV % based on the duplicates by method and measurand are given in Table 1. Median CV was higher for NMR: median CVs were 10.47 and 2.76 % for NMR and HPLC measurements, respectively, ranging from 2.96 % (alanine) to 20.95 % (threonine) for NMR and from 2.59 % (alanine) to 3.55 % (glycine) in HPLC measurements, respectively.
Medians (1st–3rd quartile) of AA levels measured with NMR and HPLC method for duplicate (first/second) measurements.
| AA | Median (1st–3rd quartile), mmol/L | CV % | n | |||||
|---|---|---|---|---|---|---|---|---|
| NMR (first) | NMR (second) | HPLC (first) | HPLC (second) | NMR | HPLC | NMR | HPLC | |
| Alanine | 0.506 (0.451–0.558) | 0.503 (0.450–0.561) | 0.487 (0.425–0.552) | 0.492 (0.425–0.560) | 2.96 | 2.59 | 89 | 90 |
| Glycine | 0.297 (0.273–0.371) | 0.301 (0.270–0.364) | 0.245 (0.217–0.303) | 0.245 (0.218–0.301) | 4.87 | 3.55 | 89 | 90 |
| Histidine | 0.119 (0.097–0.142) | 0.129 (0.109–0.147) | 0.077 (0.068–0.086) | 0.076 (0.069–0.087) | 20.56 | 3.34 | 89 | 90 |
| Isoleucine | 0.055 (0.042–0.064) | 0.055 (0.043–0.063) | 0.071 (0.063–0.083) | 0.071 (0.062–0.084) | 14.69 | 3.15 | 84 | 90 |
| Leucine | 0.107 (0.089–0.120 | 0.102 (0.090–0.116) | 0.130 (0.116–0.153) | 0.130 (0.115–0.155) | 13.07 | 2.75 | 89 | 90 |
| Lysine | 0.183 (0.153–0.211) | 0.170 (0.152–0.212) | 0.186 (0.166–0.217) | 0.187 (0.165–0.218) | 10.47 | 2.76 | 82 | 90 |
| Ornithine | 0.044 (0.032–0.057) | 0.044 (0.036–0.060) | 0.101 (0.091–0.117) | 0.102 (0.093–0.114) | 11.12 | 2.79 | 49 | 90 |
| Phenylalanine | 0.398 (0.185–0.647) | 0.390 (0.173–0.660) | 0.393 (0.204–0.663) | 0.390 (0.214–0.663) | 8.34 | 2.74 | 88 | 90 |
| Threonine | 0.149 (0.107–0.202) | 0.155 (0.117–0.189) | 0.140 (0.128–0.177) | 0.141 (0.129–0.177) | 20.95 | 2.91 | 42 | 90 |
| Tyrosine | 0.098 (0.078–0.132) | 0.102 (0.075–0.132) | 0.120 (0.087–0.158) | 0.121 (0.087–0.157) | 5.83 | 2.66 | 89 | 90 |
| Valine | 0.264 (0.232–0.297) | 0.258 (0.236–0.295) | 0.258 (0.230–0.286) | 0.256 (0.230–0.288) | 7.64 | 2.70 | 89 | 90 |
-
Coefficients of variation (CV %) calculated from duplicates per method; n, number of observations; AA, amino acid; NMR, nuclear magnetic resonance spectroscopy; HPLC, high performance liquid chromatography.
Comparisons between 1H NMR and HPLC measurements were performed based on the first of the duplicate measurements. Table 2 gives Spearman correlation coefficients as well as slopes and intercepts of the Passing-Bablok regression lines with the corresponding confidence interval (CI) as well as the normalized intercept (=100*intercept/medianHPLC [%]). Spearman correlation coefficients ranged from r=0.29 (histidine) to r=0.99 (phenylalanine) with a median correlation coefficient of r=0.75. Measurands with correlation coefficients above 0.8 were phenylalanine (r=0.99), tyrosine (r=0.97), alanine (r=0.90), glycine (r=0.86) and valine (r=0.81). In Passing-Bablok analysis, regression line slopes ranged from slope=1.02 (isoleucine) to slope=3.75 (histidine). An acceptable slope between 0.9<slope<1.1 was found for isoleucine (slope=1.02), phenylalanine (slope=1.03), alanine (slope=0.96), glycine (slope=1.08) and leucine (slope=0.91). Acceptable intercepts (normalized intercept<10 %) were found for tyrosine (norm. intercept=1.15 %), phenylalanine (4.39 %) and alanine (6.58 %).
Slopes and intercepts of Passing-Bablok regression line with the corresponding 95 % CI, normalized intercept, Spearman correlation coefficients r for comparison of HPLC† and 1H NMR measurements.
| Measurand | Slope, CI | Intercept (CI), mmol/L | Normalized intercept % | r | n |
|---|---|---|---|---|---|
| Alanine | 0.96 (0.89–1.02) | 0.03 (0.00–0.06) | 6.58 | 0.90 | 89 |
| Glycine | 1.08 (1.02–1.15) | 0.03 (0.01–0.05) | 13.49 | 0.86 | 89 |
| Histidine | 3.75 (2.75–5.44) | −0.17 (−0.30–−0.10) | −224 | 0.29 | 89 |
| Isoleucine | 1.02 (0.87–1.24) | −0.02 (−0.04–−0.01) | −29.53 | 0.75 | 85 |
| Leucine | 0.91 (0.75–1.15) | −0.02 (−0.05–0.00) | −13.27 | 0.69 | 89 |
| Lysine | 1.41 (1.23–1.68) | −0.09 (−0.14–−0.05) | −49.65 | 0.75 | 85 |
| Ornithine | 0.81 (0.70–0.97) | −0.05 (−0.07–−0.03) | −48.66 | 0.71 | 59 |
| Phenylalanine | 1.03 (1.01–1.04) | −0.02 (−0.02–−0.01) | −4.39 | 0.99 | 89 |
| Threonine | 2.16 (1.80–2.63) | −0.17 (−0.24–−0.12) | −120 | 0.69 | 57 |
| Tyrosine | 0.83 (0.80–0.86) | 0.00 (0.00–0.01) | 1.15 | 0.97 | 89 |
| Valine | 1.20 (1.08–1.36) | −0.04 (−0.09–−0.01) | −16.38 | 0.81 | 89 |
-
n, number of observations; CI, confidence interval; HPLC, high performance liquid chromatography; NMR, nuclear magnetic resonance spectroscopy.
Based on the results, we defined the following groups:
Correlation r>0.8, slope from 0.9 to 1.1 and norm. Intercept<10 % (alanine and phenylalanine)
Correlation r>0.8, slope below 0.9 or above 1.1 or norm. Intercept ≥ 10 % (tyrosine, valine, glycine)
Correlation r ≤ 0.8, slope below 0.9 or above 1.1 or norm. Intercept ≥ 10 % (ornithine, threonine, histidine, isoleucine, leucine, lysine)
not evaluable due to too many measurements below LOD (glutamine, glutamic acid, asparagine, methionine)
For illustration, Figure 2 shows scatterplots with the according regression lines and reference intervals for selected AAs from groups one to three (see Supplementary Figure S1 for all measurands).
![Figure 2:
Passing-Bablok plots of comparison of HPLC and NMR measurements for phenylalanine, tyrosine, isoleucine and histidine. The black line represents the regression line, the grey dashed line represents the main diagonal and the grey dotted line the reference intervals according to [14]. r, Spearman correlation coefficient; NMR, nuclear magnetic resonance spectroscopy; HPLC, high performance liquid chromatography.](/document/doi/10.1515/labmed-2025-0084/asset/graphic/j_labmed-2025-0084_fig_002.jpg)
Passing-Bablok plots of comparison of HPLC and NMR measurements for phenylalanine, tyrosine, isoleucine and histidine. The black line represents the regression line, the grey dashed line represents the main diagonal and the grey dotted line the reference intervals according to [14]. r, Spearman correlation coefficient; NMR, nuclear magnetic resonance spectroscopy; HPLC, high performance liquid chromatography.
Discussion
We evaluated the quantification of 15 AAs using 1H NMR and compared the results to a well-established HPLC method. We showed, that the comparability and thus the quality of the NMR measurement varies considerably among the measured AAs with two AAs showing a high comparability between NMR and HPLC results.
NMR produced several values below the LOD whereas HPLC measurements showed no such values. NMR measurements provided values below the LOD in nine AAs ranging from 100 % for glutamine to 0.6 % for phenylalanine. This is in line with previous studies that report lower sensitivity for AAs in NMR compared to other methods [1], 12]. However, as Figure 2 and Supplementary Figure S1 illustrate, the measuring intervals mainly cover the reference intervals for the investigated AAs showing that the current NMR technology is able to capture the diagnostically relevant ranges. Amongst others, the limit of detection depends on the chemical properties of the given AAs and the number of peaks and their respective position in the spectrum including possible overlays, as illustrated in Figure 1 for example measurands. Since human plasma represents a protein and metabolite rich material, overlays regarding the peaks occur frequently and furthermore vary among individuals, influencing detection of the investigated measurands.
Imprecision
Imprecision was higher in 1H NMR compared to HPLC measurements whereby the CVs of the HPLC method stayed well below 4 % for all investigated AAs. For NMR, CVs vary considerably among the investigated AA. While alanine, glycine and tyrosine showed low CVs, which would also be acceptable in clinical routine, histidine and threonine would not be usable in a clinical context due to their very high CVs. With respect to the latter, the high imprecision might be due to signal overlaps e.g. a lactate signal overlap with threonine [15] or of creatine as well as creatinine with lysine, see Figure 1. In case of ornithine not only signal overlap, but also a high number of rather small peaks complicates the quantification. Similar effects have been described by other authors [1], 12], 15]. Possible ways to improve imprecision and sensitivity may be application of additional NMR experiments such as 2D (JRES) or increasing magnetic field strengths and computational analysis after data collection [1], 2].
Wolak-Dinsmore et al. [16] reported CVs for inter-assay and intra-assay imprecision for valine, leucine and isoleucine, measuring three plasma pools by 1H NMR and using a newly developed deconvolution algorithm for the quantification of branched chain AAs (BCAA, i.e. valine, leucine and isoleucine) in plasma or serum. Jimenez et al. [15] reported CVs obtained in a multi-laboratory trial using 37 serum and 37 plasma commercially sourced samples analyzed in 11 600 MHz spectrometers. In another study, AAs were detected in honey, using a 500 MHz NMR platform [17]. Imprecision was assessed by measuring a standard solution containing the principal compounds of honey. All studies revealed CVs partly comparable to our values, depending on the material and quantification methods used. The authors argue [16], that some CVs are fairly high due to high concentrations of large proteins and lipoproteins which limits sensitivity of small molecules in low concentrations.
Method comparison
The method comparison of AA concentrations between 1H NMR and HPLC revealed highest correlation coefficients for phenylalanine (r=0.99), tyrosine (r=0.97) and alanine (r=0.90). Glycine (r=0.86) and valine (r=0.81) showed good correlation coefficients. Among these, phenylalanine and alanine also showed a low imprecision and only small bias to the HPLC measurements, suggesting their quantitative use in research and making them promising candidates for use as measurands in patient care. As an example, when applying a critical phenylalanine cut-off used in the newborn screening program to detect PKU, the concordance between the two analytical methods in classifying PKU was exceptionally high. Of the 177 samples for which phenylalanine concentrations from both methods were available, only two discordant classifications were observed when using a threshold of 115 μmol/L, which is the cut-off employed in our laboratory for routine newborn screening. It needs to be clearly pointed out, that for the use in patient care a CE-mark needs to be obtained, which is a costly and time-consuming process.
The remaining above-mentioned AAs, with a good correlation between 1H NMR and HPLC results, showed systematic bias. A systematic bias often occurs in different methods and can be handled in both settings, patient care and research, if well described. Consequently, these AAs are also candidates for measurements in research and patient care.
Correlation coefficients were small (r ≤ 0.8) mostly for those AAs displaying a high imprecision in NMR, namely ornithine, histidine, isoleucine, leucine, lysine and threonine. High imprecision, in this case of the NMR based results, negatively impacts the concordance between NMR and HPLC.
Still, those methods with high imprecision may deliver additional information in terms of qualitative results when applied as add-on in the course of NMR measurements for other purposes. For example, in epidemiological approaches with large numbers of probands, qualitative results like “negative and positive” or “low and high” may be used to distinguish between patients and healthy controls.
We therefore suggest that current NMR quantification algorithms for AAs may be used for:
quantitative use in research and candidate for quantitative use in patient care (alanine and phenylalanine)
quantitative use in research and candidate for quantitative use in patient care if the systematic bias is taken into account (tyrosine, valine, glycine)
qualitative results in epidemiological studies (ornithine, threonine, histidine, isoleucine, leucine, lysine)
not evaluable (glutamine, glutamic acid, asparagine, methionine)
To our knowledge, very few studies on the comparison of NMR-measured AA levels with HPLC-measured levels exist, none of these used human plasmas. In Nord et al. (18), two quantification methods for NMR-measured AA levels in beer, based on signal integration and on partial least-squares (PLS) regression, respectively, are described. The PLS method was applied to 19 AAs and the signal integration method was applied for five AAs. NMR based AA levels were compared to HPLC based results in 58 samples. Depending on the quantification method and the considered measurand, the quantification models showed varying quality: all AAs quantified by signal integration and eight AAs quantified by the PLS model showed high comparability between NMR and HPLC results (squared correlation coefficient>0.95 and regression line slope close to 1), whereas quality of PLS prediction models were lower for the remaining AAs. Possible explanations for the lower quality were lower concentration levels and signal overlap for some of the measurands. Correlation coefficients were partly comparable to the values found in our study (phenylalanine and tyrosine). Deviations in the results might be explained with the differences in the quantification methods and the material (beer vs. plasma). Also, in case of the signal integration method, the considered measurands were chosen such that their signals were lying in regions with few other signals in the beer spectrum, which might explain better correlation for some of the measurands than in our study.
The authors [18] assume a limit for quantification of AAs with the described methods of 5–10 mg/L (=0.03–0.06 mmol/L for phenylalanine, e.g.), which is mostly comparable to our values, see Supplementary Table S1. Interestingly, a decrease of detection limit by a factor of 10 was presumed by enhancement of technology such as higher field strength, cryoprobe technology or larger number of scans. Further comparison studies in human plasma from both, healthy and diseased probands, are needed to improve the data base.
Multiple studies show the potential of AAs to serve as biomarkers in prognosis and diagnosis of various diseases, e.g. diabetes [6], 19], cancer [5], 20] or cardiovascular disease [21], [22], [23]. NMR-platforms are increasingly used in metabolic profiling studies due to their inherent advantages like robust and reproducible measurements [1], 12], also revealing insights in the role of AAs in the aforementioned clinical outcomes [16], [24], [25], [26], [27], [28]. Our results strongly support the use of NMR-based measurements of AAs, not only in research, but some of the investigated AAs may be regarded as candidates for measurements in patient care. Of course, they still need to undergo the CE-marking process prior to clinical use. Improvement of knowledge of NMR-based measurement and improvement of NMR-technology, e.g. by including more peaks per measurand, adding further experiments next to NOESY or increasing field strength, may prepare the ground for a wider use of AAs in disease diagnosis and prognosis. However, it is important to point out that results should be handled with care since the analytical quality varies considerably among the investigated AAs. The above stated categories should be taken into account when using NMR quantification for scientific purposes.
Strengths and limitations
To our knowledge this is the first independent study based on human plasma samples from patient care to compare NMR AA measurements to an established patient care HPLC method. For AA analysis recommended LC-MS/MS was not available for this study. The used number of 90 sample may not be sufficient to cover all important metabolomic states that may interfere with reliable quantification of AAs. Samples were limited to a specialized clinic covering only a small number of diseases. So far, the manufacturer does not provide automated reports for all desirable AA and therefore e.g. citrulline, and arginine are missing. The report for glutamine, glutamic acid, asparagine and methionine did not produce enough results above the LOD. Different from classical laboratory medicine measurement procedures, calibration relies on one substance only (TSP) and controls for whole spectra are not available. Regarding NMR experiments, only the NOESY experiment was performed. Further experiments allowing for longer acquisition time and more data points were not conducted. Independent quality controls for each specific measurand were not available and therefore could not be included. Furthermore, the study relies on one HPLC and NMR device only and should be repeated using multiple devices for each method. While NMR is already quite often used in research contexts, it is so far not suitable for routine and especially not in emergency settings. While the short sample preparation and measurement of approximately 20–30 min represent an advantage, high investment costs and the considerably low through-put represent draw-backs that still need to be overcome. In the analysis, we used Spearman correlation (as most of the data was not normally distributed), which may level out relevant differences in the concentrations.
Conclusions
Our study shows, that the analytical quality of NMR measurements varies considerably among the investigated AAs. NMR is regarded as an advantageous, non-destructive technique, potentially allowing robust and reproducible measurements with minimal preparation requirements. Thus, NMR methods may be suitable for metabolomics screening in clinical context. In view of research, an application of NMR technology in metabolic profiling studies is highly suitable and is already extensively used, despite some drawbacks like modest sensitivity and high sample volume.
NMR measurements showed low imprecision and bias to HPLC results for a limited number of AAs, making them promising candidates for quantitative use in patient care. Moreover, depending on the imprecision and comparability, NMR-measured AA levels may serve as source of information in terms of quantitative or qualitative results in metabolic profiling studies. Due to the differing analytical quality, application of NMR methods has to be considered individually for each AA. Generally, our study implies, that NMR has the potential to be applied for AA detection both in research and medical laboratories, but so far are not suitable for AA monitoring in a diagnostic context.
-
Research ethics: The study was approved by the local Ethics Committee (BB 100/15).
-
Informed consent: Not applicable.
-
Author contributions: All authors have accepted responsibility for the entire content of this manuscript and approved its submission.
-
Use of Large Language Models, AI and Machine Learning Tools: None declared.
-
Conflict of interest: The authors state no conflict of interest.
-
Research funding: None declared.
-
Data availability: The datasets generated and analysed during the current study are available from the corresponding author on reasonable request.
References
1. Emwas, AH, Roy, R, McKay, RT, Tenori, L, Saccenti, E, Gan, G, et al.. NMR spectroscopy for metabolomics research. Metabolites 2019;9. https://doi.org/10.3390/metabo9070123.Search in Google Scholar PubMed PubMed Central
2. Song, Z, Wang, H, Yin, X, Deng, P, Jiang, W. Application of NMR metabolomics to search for human disease biomarkers in blood. Clin Chem Lab Med 2019;57:417–41. https://doi.org/10.1515/cclm-2018-0380.Search in Google Scholar PubMed
3. Plenis, A, Oledzka, I, Kowalski, P, Miekus, N, Baczek, T. Recent trends in the quantification of biogenic amines in biofluids as biomarkers of various disorders: a review. J Clin Med 2019;8. https://doi.org/10.3390/jcm8050640.Search in Google Scholar PubMed PubMed Central
4. Dimou, A, Tsimihodimos, V, Bairaktari, E. The critical role of the branched chain amino acids (BCAAs) catabolism-regulating enzymes, branched-chain aminotransferase (BCAT) and Branched-chain alpha-keto acid dehydrogenase (BCKD), in human pathophysiology. Int J Mol Sci 2022;23. https://doi.org/10.3390/ijms23074022.Search in Google Scholar PubMed PubMed Central
5. Lieu, EL, Nguyen, T, Rhyne, S, Kim, J. Amino acids in cancer. Exp Mol Med 2020;52:15–30. https://doi.org/10.1038/s12276-020-0375-3.Search in Google Scholar PubMed PubMed Central
6. Friedrich, N. Metabolomics in diabetes research. J Endocrinol 2012;215:29–42. https://doi.org/10.1530/joe-12-0120.Search in Google Scholar
7. Van Spronsen, FJ, Blau, N, Harding, C, Burlina, A, Longo, N, Bosch, AM. Phenylketonuria. Nat Rev Dis Primers 2021;7:36. https://doi.org/10.1038/s41572-021-00267-0.Search in Google Scholar PubMed PubMed Central
8. Strauss, KA, Puffenberger, EG, Carson, VJ. Maple syrup urine disease. In: Adam, MP, Everman, DB, Mirzaa, GM, Pagon, RA, Wallace, SE, Bean, LJH, editors, et al.. GeneReviews®. Seattle, WA: University of Washington; 2020:1993–2025 pp.Search in Google Scholar
9. Ferre, S, Gonzalez-Ruiz, V, Guillarme, D, Rudaz, S. Analytical strategies for the determination of amino acids: past, present and future trends. J Chromatogr, B: Anal Technol Biomed Life Sci 2019;1132:121819. https://doi.org/10.1016/j.jchromb.2019.121819.Search in Google Scholar PubMed
10. Galezowska, G, Ratajczyk, J, Wolska, L. Determination of amino acids in human biological fluids by high-performance liquid chromatography: critical review. Amino Acids 2021;53:993–1009. https://doi.org/10.1007/s00726-021-03002-x.Search in Google Scholar PubMed PubMed Central
11. Ombrone, D, Giocaliere, E, Forni, G, Malvagia, S, la Marca, G. Expanded newborn screening by mass spectrometry: new tests, future perspectives. Mass Spectrom Rev 2016;35:71–84. https://doi.org/10.1002/mas.21463.Search in Google Scholar PubMed
12. Crook, AA, Powers, R. Quantitative NMR-based biomedical metabolomics: current status and applications. Mol 2020;25. https://doi.org/10.3390/molecules25215128.Search in Google Scholar PubMed PubMed Central
13. Hyslop, NP, White, WH. Estimating precision using duplicate measurements. J Air Waste Manag Assoc 2009;59:1032–9. https://doi.org/10.3155/1047-3289.59.9.1032.Search in Google Scholar PubMed
14. Blau, N, Blau, N, Duran, M, Gibson, KM, SpringerLink. Laboratory guide to the methods in biochemical genetics. 1st 2008. ed. Berlin, London: Springer; 2008.10.1007/978-3-540-76698-8Search in Google Scholar
15. Jimenez, B, Holmes, E, Heude, C, Tolson, RF, Harvey, N, Lodge, SL, et al.. Quantitative lipoprotein subclass and low molecular weight metabolite analysis in human serum and plasma by (1)H NMR spectroscopy in a multilaboratory trial. Anal Chem 2018;90:11962–71. https://doi.org/10.1021/acs.analchem.8b02412.Search in Google Scholar PubMed
16. Wolak-Dinsmore, J, Gruppen, EG, Shalaurova, I, Matyus, SP, Grant, RP, Gegen, R, et al.. A novel NMR-based assay to measure circulating concentrations of branched-chain amino acids: elevation in subjects with type 2 diabetes mellitus and association with carotid intima media thickness. Clin Biochem 2018;54:92–9. https://doi.org/10.1016/j.clinbiochem.2018.02.001.Search in Google Scholar PubMed
17. del Campo, G, Zuriarrain, J, Zuriarrain, A, Berregi, I. Quantitative determination of carboxylic acids, amino acids, carbohydrates, ethanol and hydroxymethylfurfural in honey by (1)H NMR. Food Chem 2016;196:1031–9. https://doi.org/10.1016/j.foodchem.2015.10.036.Search in Google Scholar PubMed
18. Nord, LI, Vaag, P, Duus, JO. Quantification of organic and amino acids in beer by 1H NMR spectroscopy. Anal Chem 2004;76:4790–8. https://doi.org/10.1021/ac0496852.Search in Google Scholar PubMed
19. Arneth, B, Arneth, R, Shams, M. Metabolomics of type 1 and type 2 diabetes. Int J Mol Sci 2019;20. https://doi.org/10.3390/ijms20102467.Search in Google Scholar PubMed PubMed Central
20. Sivanand, S, Vander Heiden, MG. Emerging roles for branched-chain amino acid metabolism in cancer. Cancer Cell 2020;37:147–56. https://doi.org/10.1016/j.ccell.2019.12.011.Search in Google Scholar PubMed PubMed Central
21. Li, T, Luo, HH, Feng, XF, Bai, Y, Fang, ZZ, Wu, GG, et al.. Plasma free amino acids and risk of cardiovascular disease in Chinese patients with type 2 diabetes. Front Endocrinol 2020;11:519923. https://doi.org/10.3389/fendo.2020.519923.Search in Google Scholar PubMed PubMed Central
22. Ganguly, P, Alam, SF. Role of homocysteine in the development of cardiovascular disease. Nutr J 2015;14:6. https://doi.org/10.1186/1475-2891-14-6.Search in Google Scholar PubMed PubMed Central
23. Ruiz-Canela, M, Toledo, E, Clish, CB, Hruby, A, Liang, L, Salas-Salvado, J, et al.. Plasma branched-chain amino acids and incident cardiovascular disease in the PREDIMED trial. Clin Chem 2016;62:582–92. https://doi.org/10.1373/clinchem.2015.251710.Search in Google Scholar PubMed PubMed Central
24. Welsh, P, Rankin, N, Li, Q, Mark, PB, Wurtz, P, Ala-Korpela, M, et al.. Circulating amino acids and the risk of macrovascular, microvascular and mortality outcomes in individuals with type 2 diabetes: results from the ADVANCE trial. Diabetologia 2018;61:1581–91. https://doi.org/10.1007/s00125-018-4619-x.Search in Google Scholar PubMed PubMed Central
25. Liu, L, Liu, L, Wang, J, Zheng, Q, Jin, B, Sun, L. Differentiation of gestational diabetes mellitus by nuclear magnetic resonance-based metabolic plasma analysis. J Biomed Res 2021;35:351–60. https://doi.org/10.7555/jbr.35.20200191.Search in Google Scholar
26. Wen, S, Zhan, B, Feng, J, Hu, W, Lin, X, Bai, J, et al.. Non-invasively predicting differentiation of pancreatic cancer through comparative serum metabonomic profiling. BMC Cancer 2017;17:708. https://doi.org/10.1186/s12885-017-3703-9.Search in Google Scholar PubMed PubMed Central
27. Tobias, DK, Hazra, A, Lawler, PR, Chandler, PD, Chasman, DI, Buring, JE, et al.. Circulating branched-chain amino acids and long-term risk of obesity-related cancers in women. Sci Rep 2020;10:16534. https://doi.org/10.1038/s41598-020-73499-x.Search in Google Scholar PubMed PubMed Central
28. Wurtz, P, Havulinna, AS, Soininen, P, Tynkkynen, T, Prieto-Merino, D, Tillin, T, et al.. Metabolite profiling and cardiovascular event risk: a prospective study of 3 population-based cohorts. Circulation 2015;131:774–85. https://doi.org/10.1161/circulationaha.114.013116.Search in Google Scholar
Supplementary Material
This article contains supplementary material (https://doi.org/10.1515/labmed-2025-0084).
© 2025 the author(s), published by De Gruyter, Berlin/Boston
This work is licensed under the Creative Commons Attribution 4.0 International License.
Articles in the same Issue
- Frontmatter
- Mini Review
- Current status and future perspectives on standardized training for laboratory medicine resident physicians in China
- Original Articles
- Comprehensive utilization of NMR spectra–evaluation of NMR-based quantification of amino acids for research and patient care
- Establishing serum zinc reference intervals with two different photometric assays and evaluating their impact on zinc deficiency prevalence
- Diagnostic validation of the GAAD algorithm for hepatitis B virus-related hepatocellular carcinoma surveillance in Vietnam
- Effect of DNA input on analytical and clinical parameters of a circulating tumor DNA assay for comprehensive genomic profiling
- Application value of ddPCR in rapid detection of pathogens in abdominal sepsis
- Congress Abstracts
- German Congress of Laboratory Medicine: 20th Annual Congress of the DGKL and 7th Symposium of the Biomedical Analytics of the DVTA e. V.