Direct, age- and gender-specific reference intervals: applying a modified M-estimator of the Yeo-Johnson transformation to clinical real-world data
-

 ,
und
,
und

Abstract
Objectives
Reference intervals for the general clinical practice are expected to cover non-pathological values, but also reflect the underlying biological variation present in age- and gender-specific patient populations. Reference intervals can be inferred from routine patient data measured in high capacity using parametric approaches. Stratified reference distributions are obtained which may be transformed to normality via e.g. a Yeo-Johnson transformation. The estimation of the optimal transformation parameter for Yeo-Johnson through maximum likelihood can be highly influenced by the presence of outlying observations, resulting in biased reference interval estimates.
Methods
To reduce the influence of outlying observations on parametric reference interval estimation, a reweighted M-estimator approach for the Yeo-Johnson (YJ) transformation was utilised to achieve central normality in stratified reference populations for a variety of laboratory test results. The reweighted M-estimator for the YJ transformation offers a robust parametric approach to infer relevant reference intervals.
Results
The proposed method showcases robustness up to 15 % of outliers present in routine patient data, highlighting the applicability of the reweighted M-estimator in laboratory medicine. Furthermore, reference intervals are personalised based on the patients’ age and gender for a variety of analytes from routine patient data collected in a tertiary hospital, robustly reducing the dimensionality of the data for more data-driven approaches.
Conclusions
The method shows the advantages for estimating reference intervals directly and parametrically from routine patient data in order to provide expected reference ranges. This approach to locally inferred reference intervals allows a more nuanced comparison of patients’ test results.
Introduction
Reference intervals (RIs) are a fundamental tool in many disciplines in medicine, including clinical chemistry and haematology. They effectively allow the evaluation of laboratory test results to help physicians in decision making [1]. Often, clinical laboratories lack the necessary resources to determine RIs adapted to their local patient population and therefore refer to the manufacturers of laboratory devices and test kits. This poses challenges on the transferability of RIs: The laboratory is required to validate RIs from manufacturers or estimate appropriate RIs from the local population instead [2]. Historically, RIs have been estimated from laboratory test results of apparently healthy volunteers by a non-parametric approach, through calculating the 2.5th and 97.5th percentiles of sorted values [3]. While it has been acknowledged that recruiting a healthy patient cohort is a cumbersome effort with high associated costs, international guidelines stated the necessary considerations for local RI inference based on this “gold standard” [4]. More recently, the use of “real-world” data from laboratory routine testing together with a more complex approach to statistical inference has resulted in “indirect methods” [5]. Due to the complexity of the optimization in indirect methods, larger reference populations are required [6]. Still, the issue of selecting the most appropriate reference population for the inference of clinically relevant RIs has been persistent [7].
Direct parametric reference interval estimation
The aforementioned guideline proposed the estimation of RIs directly from the observed values or from a mathematical “normalisation” of said values, if either of them follow a Gaussian distribution [4]. The Box-Cox (BC) transformation family was proposed to find the most appropriate transformation for the observed distribution to a Gaussian one [8]. Under the mild assumption that the underlying data are non-uniformly distributed, it has been an established transformation method for handling data in direct RI studies [9], [10], [11], [12], [13]. The BC transformation is used to transform the data through:
The transformation parameter λ (lambda) can be estimated using maximum likelihood estimation (MLE), however this estimation can be highly affected by outlying observations from the main bulk of the distribution, frequent in real-world routine data. Various methods have been suggested to address the influence of outliers before transformation, such as evaluating the Dixon’s Q statistic, the Grubbs G statistic or the Tukey quantile range on suspected values [14], [15], [16]. These methods have a variety of limitations, such as limited power with large sample sizes, where the location and prevalence of outliers is not known a priori. Further, the distinction between a data point from the tail and an outlier in skewed distributions is even harder, biasing RI estimates [17, 18]. The re-evaluation of suspected outliers can help reduce their influence on the transformation to normality.
Aim
In this work, we propose using a robust transformation algorithm to achieve central normality in univariate blood analyte test distributions from routine laboratory data from which RIs can be estimated parametrically. Using an established reweighted M-estimator (rewME) approach for the Box-Cox and Yeo-Johnson transformations, the accuracy of the estimated transformation parameter lambda can be improved. This renders the direct parametric estimation of RIs from the resulting transformed distribution more robust to outliers that may be present in routine patient data. We can thus directly infer clinically relevant RIs as “expectation ranges” from gender- and age-stratified reference populations.
Materials and methods
Reweighted reference interval estimation
The proposed algorithm for robustly estimating RIs assumes that the reference population from routine patient data contains a majority of non-pathological test result values. The distribution can be closely approximated with a Box-Cox (BC) or a Yeo-Johnson (YJ) transformed Gaussian normal distribution. The YJ transformation is a generalisation of the BC transformation and also employs a single transformation parameter lambda as follows:
Patient data from the clinical routine contain an unknown prevalence of outliers, i.e. outlying observations that deviate from the majority of values in the distribution, that can skew the optimal estimated transformation if the transformation parameter lambda is estimated by MLE. However, the implemented algorithm for direct RIs (rewRI) uses a reweighted M-estimator (rewME) for the transformation parameter lambda to achieve central normality, as established by Raymaekers et al. [19]. The implemented algorithm adaptively adjusts the transformation parameter lambda with associated weights, incorporates machine learning principles to minimise the impact of outliers and achieve a more robust, data-driven normalisation of the real-world data. With this, the influence of outliers on the direct RI inference can be reduced compared to the traditional one-step Box-Cox transformation approaches. This is achieved by minimising a robust M-estimate criterion for the parameter λ for the BC or the YJ transformation. In robust linear regression, M-estimators are usually computed by iteratively applying classical weighted regression, i.e. using the standard maximum likelihood estimator incorporating the weights, where the weights are recalculated in each iteration step. A similar scheme is adapted here to estimate the parameters for the Box-Cox or YJ transformation and the parameters of the normal distribution of the transformed non-pathological values. In the scheme proposed here, binary instead of the continuous weights in robust regression are used. A detailed description of the heuristic algorithm can be found in the Supplementary material. The resulting optimal λ can be used to transform the data to robustly achieve a close approximation of a Gaussian distribution, from which the appropriate (1 − α) RI with the lower reference limit (LL) and the upper reference limit (UL) can be estimated. Using bootstrap, confidence intervals (CIs) are estimated to infer precision by drawing n-sized samples with replacement from the reference population, repeating this methodology for a reasonable number of times (e.g. 400), and calculating CIs from the quantiles of the bootstrap distribution. The full method has been implemented in an R package called rewRI. The package supports the fully automated estimation of direct RIs from clinical cohort data, with an accompanying graphical output to further help to assess the accuracy of the inferred estimates.
Method evaluation on simulated data
A direct parametric RI approach from clinical data tries to leverage the mean and standard deviation of the estimated Gaussian distribution from the underlying data. Both of these metrics can become inaccurate if the presence of outliers and residual skewness is not addressed properly. Generally, the presence of either erroneous or significantly differing (potentially pathological) test results in routine patient data can vary. To evaluate the performance of the “rewRI”, a rewME of the best fitting BC/YJ transformation to estimate RIs, different approaches have been performed to evaluate the robust RI estimation.
Firstly while minimising the rewME for the transformation parameter λ, local convergence can be obtained with the resulting λ̂ estimate not necessarily being the global minimum. Especially in lower sample sizes, where the influence of individual data points on the overall variance is much bigger, this can lead to substantially biased estimates. To assess the accuracy of the rewME of the optimal lambda for the reweighted YJ and BC transformation algorithms in absence of significant outliers, simulated datasets were created based on a normal distribution X∼N(µ=5, σ2=1), which were transformed with the inverse of the corresponding transformation using a grid of lambda values λ ∈ {0, 0.001, 0.1, 0.2, 0.5, 1} at varying sample sizes n [18]. The distributions were then used to estimate λ̂ by bootstrapping the algorithm b=400 times with the reweighting CI τ=0.99 across the chosen grid of expected lambda values for both the BC and YJ transformation.
Secondly to evaluate the method’s robustness in presence of outliers, different prevalences of outlying observations have been simulated. Again, simulated datasets were created based on the inversely transformed distribution based on X∼N(µ=5, σ2=1) using the grid of lambda values λ ∈ {0, 0.001, 0.1, 0.2, 0.5, 1} of various sample sizes n. To introduce outliers in both the lower and upper tail of the distribution (X left and X right ), a number of outliers representing 1, 5 and 10 % of the overall sample sizes were randomly drawn. Higher prevalence of outliers (>15 %) was not considered during the simulations, as more than 15 % of outlying observations would significantly alter the overall skewness of the data, making it impossible to robustly optimise the criterion [19]. Outliers were added before the inverse transformation. The amount of values added to each side was randomly assigned, totalling in the percentage set, and the values were drawn from uniform distributions, as:
These outliers therefore solely contribute to the tails of the inverse transformed distribution, for which an estimate on their effect on the inferred RIs was calculated. For the application in robust RI estimation, this was quantified as the change in the estimated LL and UL, as well as the width of the accompanying CIs. With an increased presence of outliers in the tails of the distributions, the reweighting step of the rewME (τ) was carefully evaluated at various sample sizes relevant for robust direct estimation.
Method evaluation on reference data
The rewRI algorithm with the YJ transformation was further tested on an available reference data, the stratified HCV dataset. The dataset contains test results of 238 female and 377 male participants, where in addition to test laboratory results the person’s age (in years), gender (female and male) and the patient’s eligibility for blood donation (categorical value) is recorded. The non-qualification for blood donation is likely due to the underlying medical condition, which resulted in potentially pathological measurement for some analytes. The HVC dataset is beneficial for evaluating the efficiency of the rewRI approach as we can first estimate 95 % RIs as target ranges directly from the seemingly healthy blood donors by nonparametric quantile bootstrapping of the data. The obtained RIs can be further compared to RIs obtained using an indirect RI estimation method based on truncated QQ-plots [20, 21]. An effective implementation of the latter method is done in the reflimR package, which allows the indirect estimation of RIs from routine patient data [22, 23].
Direct gender- and age-stratified RIs
Finally, the performance of the rewRI algorithm was reviewed on a retrospective dataset of routine patient data from a tertiary care hospital. The inferred RIs can be compared against estimates obtained using a non-parametric quantile bootstrapping approach and from the reflimR algorithm. The data used were collected between January 2014 and December 2022 at the University Hospital of Bern, CH, from adult inpatients, who have given general consent for the re-use of their health data. In the extracted data, each laboratory test result is accompanied with the demographic patient factors (gender and age) as well as factors from the (pre-)analytical phase (device/test kit information), resulting in a highly standardised and interoperable clinical dataset [24]. The dataset has been prepared for the inference of RIs, with only the first measurement per administrative case included during the extraction. The dataset has been anonymized according to the ethical waiver granted by the Bern cantonal Ethics Committee (Req-2020-00630).
Results
Reweighted lambda estimation
The M-estimate of the transformation parameter λ for the reweighted YJ and BC transformation algorithms exhibited high accuracy in the obtained λ due to the focus on obtaining central normality. With a sample size of n=1,000 values, the resulting lambda estimates from the bootstrap replicates retained various degrees of variability for both the reweighted BC and YJ transformation (Figure 1A and C respectively). However, this variability did not significantly hinder the inference of the respective RIs by the rewRI algorithm, as the estimated LL/UL were contained in the CIs of the expected “true” lower limits (LL) and “true” upper limits (UL), or the “true” CIs overlapped with the estimated CIs (Figure 1B and D). In absence of distinct outlying observations, the BC did resolve more accurate RIs from the distributions with various skewness, as the estimated RIs were more closely to their true value (Figure 1B). In contrast, the rewME for the YJ transformation appeared to be better equipped to distinguish between significant positive skewness (λ<0.5) and mild skewness (λ≥0.5) in the transformed distributions compared to the rewME of the BC transformation, as there was no overlap between the obtained 90 % CIs (Figure 1C and A respectively).
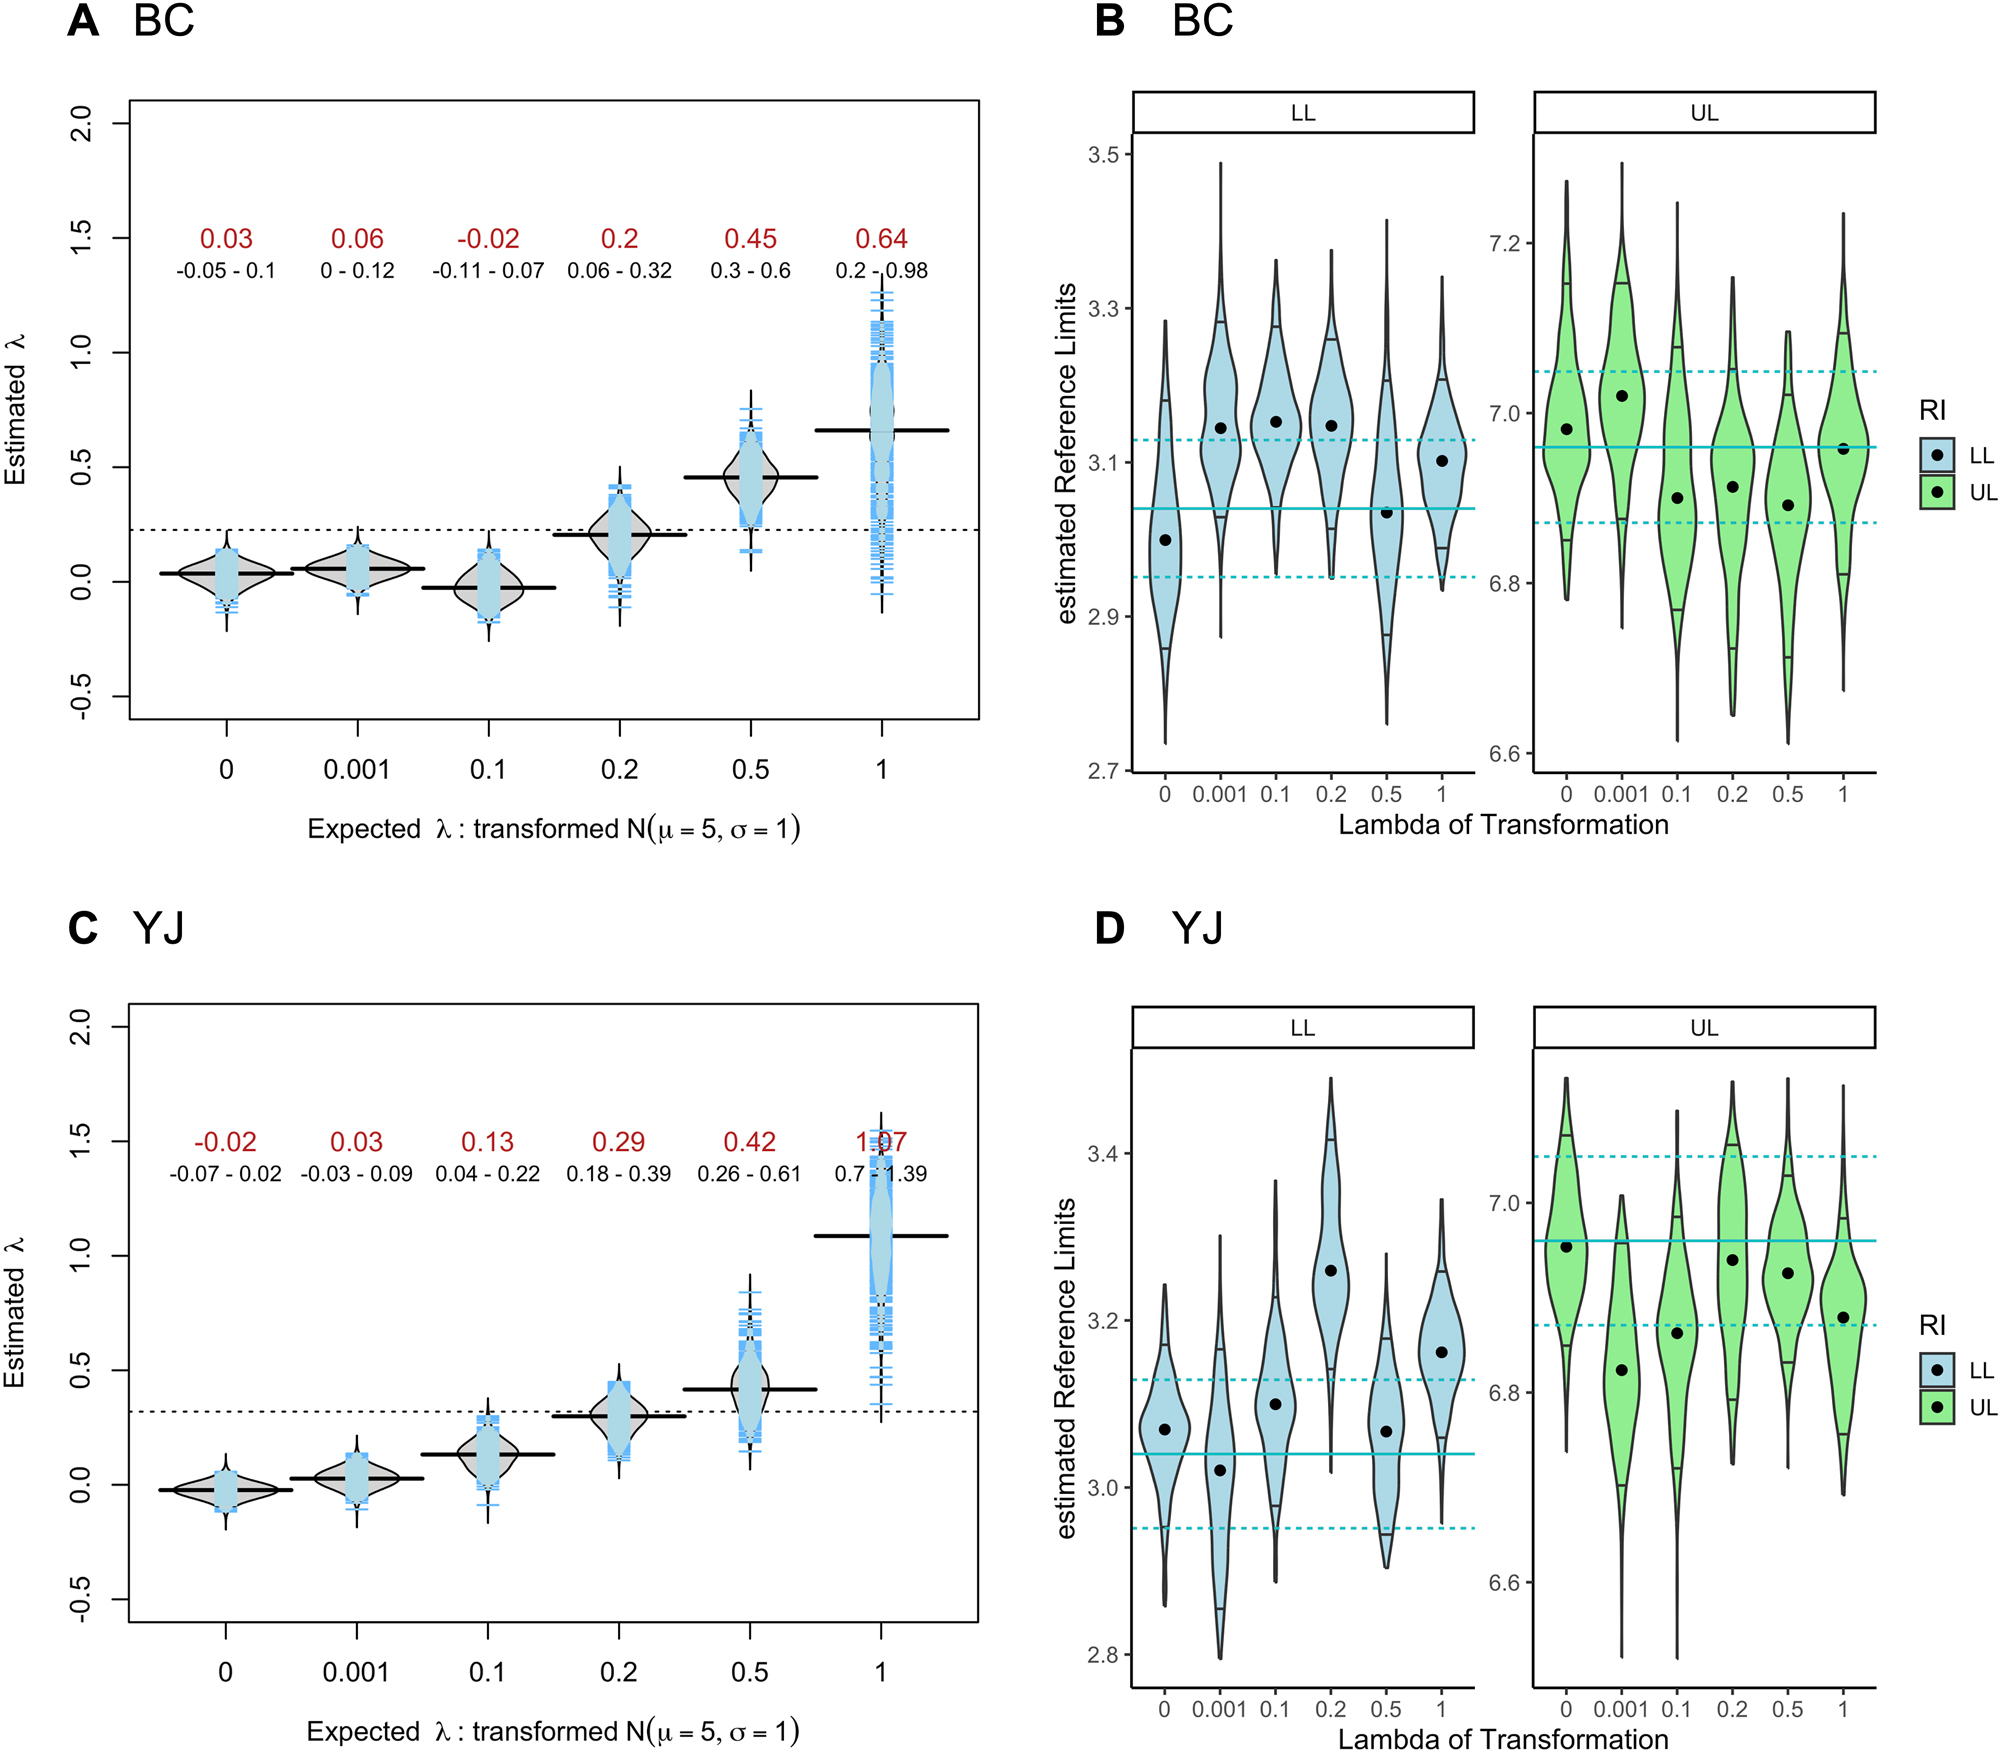
Estimated lambdas of reweighted M-estimator and its influence on the 95 % reference interval inference. (A) Estimated lambdas for the grid of expected lambda values (red: median value, black: 90 % confidence interval) for the reweighted M-estimator for the Box–Cox (BC) transformation. (B) Estimated limits of the 95 % reference interval (LL: lower limit, UL: upper limit) for the various transformed distributions using the rewRI algorithm using the reweighted BC transformation. The expected LL and UL limit (with 90 % CI) are shown as vertical blue lines. The median estimate is shown as a dot point and the 90 % CI as vertical lines. (C) Estimated lambda values for the reweighted M-estimator for the Yeo-Johnson (YJ) transformation. (D) Estimated limits of the 95 % reference interval (LL: lower limit, UL: upper limit) from the rewRI algorithm using the reweighted YJ transformation. Sample size n=1,000, number of bootstrap replicates b=400, τ=0.99.
In larger sample sizes the overall precision of the estimated lambda increases, allowing a continuous distinction between variously skewed distributions for both the YJ and BC transformation. However, in sample sizes below n=1,000, the distinction between mild and more severe skewness in the transformed distribution for both the YJ and BC became less pronounced, as seen in sample sizes of n=200 values, which is around the recommended minimal number for RI inference (Figure 2A and C respectively). Due to the low sample sizes, individual values present in the transformed distributions disproportionately influence the estimation of lambda during the rewME. However the reweighting step during the rewME focuses on achieving central normality, making the RI estimation with the rewRI algorithm still possible at sample sizes of n=200 – although with an increase in the observed CIs (Figure 2B and D). Again, in absence of clear outlying observations the BC did resolve more accurate RIs (i.e. closely to their true values), yet all estimated CIs overlapped with the true CIs (Figure 2B and D).

Estimated lambdas of reweighted M-estimator and its influence on the 95 % reference interval inference. (A) Estimated lambdas for the grid of expected lambda values (red: median value, black: 90 % confidence interval) for the reweighted M-estimator for the Box–Cox (BC) transformation. (B) Estimated limits of the 95 % reference interval (LL: lower limit, UL: upper limit) for the various transformed distributions using the rewRI algorithm using the reweighted BC transformation. The expected LL and UL limit (with 90 % CI) are shown as vertical blue lines. The median estimate is shown as a dot point and the 90 % CI as vertical lines. (C) Estimated lambda values for the reweighted M-estimator for the Yeo-Johnson (YJ) transformation. (D) Estimated limits of the 95 % reference interval (LL: lower limit, UL: upper limit) from the rewRI algorithm using the reweighted YJ transformation. Sample size n=200, number of bootstrap replicates b=400, τ=0.99.
Presence of outliers
The reweighting step of the rewME (τ) was carefully evaluated at various sample sizes to address the increased presence of outliers in the tails of the distributions. The robustness of the rewRI algorithm with the YJ transformation is demonstrated at simulated sample sizes of 1,000 and 200 (Figure 3). In the presence of >1 % of outliers, the estimates of the LL and UL obtained by the reweighted YJ transformation were more precise than the reweighted BC transformation for the distributions with the various skewnesses. It was generally observed that <10 % outliers, the CI of the reweighting set to τ=0.99 resulted in accurate UL and LL estimates. With 10 % of outliers, and especially in bigger sample sizes (n≥1,000), the estimates obtained with τ=0.95 were more precise. In lower sample sizes (n=200) with 1 % outliers, it was observed that the LL/UL estimates were more accurate with a wider CI during reweighting (τ=0.995).

Yeo-Johnson transformation: Influence of different amounts (1 , 5 and 10 %) of outliers on the estimation of the 95 % reference limits. The rewRI algorithm with the YJ transformation was bootstrapped 400 times, which resulted in a median reference limit estimate (LL=lower limit, UL=upper limit) (dot point) and a 90 % CI (vertical line). Confidence interval of the reweighting (τ) top: sample size of 1,000 values with 10 (1 %), 50 (5 %), and 100 (10 %) values as outliers in the transformed distributions. Bottom: Sample size of 200 values with 2 (1 %), 10 (5 %), and 20 (10 %) values as outliers in the transformed distributions.
The rewRI algorithm did perform better in larger sample sizes with the rewME for the YJ transformation compared to the BC transformations (Supplementary Figure 1). This could be seen in distributions with a higher prevalence of outliers (>5 %), as lower estimates for both the LL and UL with bigger CIs were obtained with the reweighted BC transformation, resulting in right-shifted RIs. Also a lower precision was observed for both the LL and UL.
Evaluation on reference data
The rewRI algorithm with the YJ transformation was further tested on the stratified HCV dataset (Table 1). In almost all cases, the obtained LL and UL of the 95 % RI estimated with the rewRI algorithm were consistent with the target values, meaning that the CI of the target values included the inferred values. Further, the estimates obtained were comparable with estimates obtained with the reflimR method. The rewRI algorithm performed the best with τ=0.99 during the reweighting step, which labelled and downweighted an average of 2.9 % (IQR: 1.72–3.75 %) of the data as outliers in the defined patient strata. In most considered populations, there was seemingly a clear separation between in- and out-lying observation possible. In rare cases, where a clear separation was not possible during reweighting, this usually affected only the UL. Such is the case in the UL of Alanine Aminotransferase (AST) in male patients, where 14.3 % of the total values in this stratum exceeded the target UL. In contrast, only 9.2 % of the total values in female patients were above the target UL, which enabled the robust estimation of the UL with the rewRI algorithm. Furthermore, the UL obtained for both male and female patients for Gamma-Glutamyl Transferase (GGT) was highly biased, as there was a significant overlap between values from apparently healthy individuals and pathological values, which the rewRI algorithm could not clearly separate during the reweighting, resulting in much higher ULs.
Estimated 95 % reference intervals for analytes from the modified HCV dataset.
| Gender |
Target | rewRI | reflimR | |||
|---|---|---|---|---|---|---|
| Female | LL | UL | LL | UL | LL | UL |
| ALB, g/L | 32.1 | 50.4 | 34.0 | 49.1 | 33.3 | 47.1 |
| ALT, U/L | 9.9 | 44.2 | 9.6 | 47.1 | 9.7 | 31.8 |
| ALP, U/L | 36.7 | 106.8 | 35.3 | 101.2 | 36.8 | 114.3 |
| AST, U/L | 14.8 | 42.1 | 14.6 | 46.5 | 13.8 | 35.2 |
| BIL, µmol/L | 2.3 | 17.6 | 2.4 | 16.9 | 2.3 | 15.8 |
| CHE, kU/L | 4.61 | 11.10 | 4.75 | 10.81 | 5.3 | 11.72 |
| CHOL, mg/dL | 3.64 | 7.55 | 3.70 | 7.42 | 3.69 | 7.82 |
| CREA, µmol/L | 52.0 | 93.3 | 51.8 | 90.5 | 53.5 | 81.5 |
| GGT, U/L | 7.4 | 74.9 | 7.2 | 118.3 | 6.8 | 38.7 |
| PROT, g/L | 62.7 | 79.4 | 64.6 | 80.7 | 64.7 | 78.9 |
|
|
||||||
| Male | LL | UL | LL | UL | LL | UL |
|
|
||||||
| ALB, g/L | 34.3 | 51.0 | 33.8 | 49.3 | 35.0 | 51.1 |
| ALT, U/L | 11.5 | 70.8 | 7.1 | 61.3 | 10.7 | 66.0 |
| ALP, U/L | 41.0 | 106.0 | 32.6 | 105.9 | 30.0 | 101.2 |
| AST, U/L | 17.0 | 47.2 | 17.1 | 77.4 | 17.1 | 42.0 |
| BIL, µmol/L | 2.9 | 25.0 | 2.8 | 31.6 | 3.3 | 19.7 |
| CHE, kU/L | 5.45 | 12.41 | 4.51 | 11.55 | 4.91 | 12.38 |
| CHOL, mg/dL | 3.71 | 7.74 | 3.46 | 7.32 | 3.55 | 7.87 |
| CREA, µmol/L | 63.0 | 111.0 | 60.7 | 109.7 | 60.7 | 115.9 |
| GGT, U/L | 10.5 | 99.6 | 10.4 | 194.6 | 9.4 | 61.2 |
| PROT, g/L | 64.1 | 80.7 | 64.7 | 80.9 | 64.0 | 81.6 |
-
LL, lower reference limit; UL, upper reference limit; methods, target, target reference intervals estimated using a non-parametric bootstrapped quantile estimator (n bootstrapping=400); rewRI, reweighted reference intervals with the Yeo-Johnson transformation (quantile=0.99, n bootstrapping=400); reflimR, reference limits from routine laboratory results; analytes, ALB, albumin; ALT, alanine aminotransferase; ALP, alkaline phosphatase; AST, aspartate transferase; BIL, bilirubin; CHE, cholinesterase; CHOL, cholesterol; CREA, creatinine; GGT, gamma-glutamyl transferase; PROT, total protein.
Direct gender- and age-stratified RIs
The rewRI algorithm was finally applied to a set of laboratory analytes from a real-world patient dataset, which was collected during routine monitoring in a tertiary hospital. The patient data for the following analytes was used: Creatinine (LOINC: 14682-9), Leukocytes (LOINC: 6690-2), Sodium (LOINC: 2951-2), and Potassium (LOINC: 2823-3). With a preliminary outlier exclusion, extreme and likely implausible values were excluded from the dataset. This resulted in the various sizes for the gender-stratified reference populations used for the analysis (Table 2).
The list of analytes used for estimation of direct RIs. For each analyte, their associated LOINC code, measurement unit, and the number of included test results (stratified by the administrative gender).
| Analyte | Loinc | Unit | Boundsa | n Femaleb | n Maleb |
|---|---|---|---|---|---|
| Creatinine | 14682-9 | µmol/L | [0, 150] | 95,929 | 113,674 |
| Potassium | 2823-3 | mmol/L | [2.5, 6] | 116,141 | 143,291 |
| Sodium | 2951-2 | mmol/L | [100, 180] | 112,749 | 136,049 |
| Leukocytes | 6690-2 | 109/L | [0, 20] | 102,097 | 113,312 |
-
aBounds set during the preliminary outlier exclusion, bnumber of test results included for the analysis. LOINC, logical observation identifiers names and code.
For each analyte, test results from patients, ages 18–90 years, were stratified by the administrative gender and a specific age (in years). Specifically, RIs were calculated using a sliding window approach for each three-year age band, as established by Zierk et al. [25]. This meant for example that the inferred RI for 57-year-old male patients included data from males ages 56 to 58. Iteratively, the rewRI algorithm for the YJ transformation (400 bootstrap replicas, τ ∈ {0.99, 0.95}) was run on each gender- and age-stratum, resulting in quasi-continuous RIs. To compare the estimated results for each obtained stratum, the analysis was repeated to estimate RIs by a nonparametric quantile approach with 400 bootstrap replicates, as well as estimating RIs by the reflimR method. Estimates obtained with the non-parametric quantile bootstrapping shows where 95 % of the clinical data fall without considering outliers. This essentially provides a safeguard, as estimated reference limits by the rewRI algorithm falling outside would be considered not improved. All estimated reference limits (UL/LL) were shown superimposed on 2D heatmaps (based on kernel density estimates of the age-stratified data used for the analysis [26]) to visualise their position relative to the distribution and concentration of data points across different age groups. The gender- and age-stratified RIs for creatinine as well as leukocytes from the rewRI algorithm were similar yet more precise than reflimR estimates, and they were consistently narrower than the non-parametric ones (Figure 4).

Gender- and age-stratified reference intervals for creatinine and leukocytes. Inferred estimates for the upper and lower limits of the RIs are provided with a 90 % confidence band for the rewRI algorithm (with τ ∈ {0.99, 0.95}, 400 bootstrap replicas), the reflimR method, and the nonparametric quantile bootstrapping (np-quantile, 400 bootstrap replicas). 2D kernel density estimates with the colour intensity representing the density of available measurement for each age year (x-axis) and the respective measurement level (y-axis).
For creatinine, the rewRI algorithm with τ=0.99 identified an average of 5.3 % of the data as outliers in each stratum, and with τ=0.95 an average of 8.0 % as outliers per stratum. The latter result was comparable to the reflimR method, which labelled an average of 8.7 % of the data as “pathological” values per stratum. Similarly for leukocytes, the rewRI algorithm with τ=0.99 labelled an average of 5.7 % of the data as outliers and with τ=0.95 an average of 6.2 % were labelled per stratum. In this analyte, the reflimR method labelled an average of 6.6 % of the data as pathological values per stratum. In most cases, the estimated results from the rewRI with τ=0.99 were only marginal improvements over the non-parametric quantile bootstrapping. If however rewRI is supplied with τ=0.95, which optimises the central 95 % of the total values, narrower age-and sex-stratified RIs were obtained. As these RIs are optimised for the underlying central 95 % range, they can be used as personalised expectation ranges, highlighting where values from a comparable homogeneous reference population come from.
Age- and gender-adjusted estimates obtained for sodium and potassium inferred by the rewRI algorithm (with τ=0.95) were comparable to the reflimR estimates (Figure 5). For sodium, the rewRI algorithm (τ=0.95) labelled an average of 11.1 % of the data as outliers per stratum. Results obtained by the reflimR method, estimated an average of 19 % of the data as pathological values per stratum. For potassium, the rewRI algorithm (τ=0.95), labelled an average of 11.7 % of the data as outliers. Estimates obtained by the reflimR method labelled an average of 15.8 % of the data as pathological values.

Gender- and age-stratified reference intervals for sodium and potassium. Inferred estimates for the upper and lower limits of the RIs are provided with a 90 % confidence band for the rewRI algorithm (with τ=0.95, 400 bootstrap replicas), the reflimR, and the nonparametric quantile bootstrapping (np-quantile, 400 bootstrap replicas). 2D kernel density estimates with the colour intensity representing the density of available measurement for each age year (x-axis) and the respective measurement level (y-axis).
Discussion
Establishing RIs for use in general clinical contexts can be a futile task, as these patients likely present pathological states, which increases the false positive rate of detecting truly pathological states by physicians during routine testing. Using test results from a general population has long been advocated for in providing a better foundation of establishing clinically relevant RIs [27]. This is not without limitations, as it is often not known a priori which exact range of measurements to consider for RI estimation from this real-world data, and which should be excluded. Identifying and removing outliers is an essential step during direct RI inference, arguably contributing more to the obtained estimates than the statistical inference method [28]. If a transformation is applied to the data, the robustness of a direct approach requires a more sophisticated treatment of outliers such as a reweighted transformation function based on a generalised Box-Cox transformation [19]. This is the approach proposed by the rewRI algorithm, where suspected outliers are down-weighted during the minimization of the M-estimate criterion of the transformation parameter lambda to infer RIs from closely normalised routine data. This is in favour of achieving central normality in the stratified reference populations, where expectation ranges for various laboratory analytes can be inferred. In the various simulations, the rewRI algorithm demonstrated strong robustness in the presence of outlying observations and adequate robustness in their absence. The latter is arguably not highly relevant when using real-world data, as the likelihood of having no outliers is very slim, even in homogeneous populations [17]. Yet, with a set choice of τ (being the CI during the reweighting scheme), a sampled reference distribution containing solely non-pathological values might be arbitrarily truncated to the interval [μ − σΦ − 1(τ), μ + σΦ − 1(τ)], resulting in narrower RIs. This effect could potentially be mitigated by introducing a corresponding factor that depends on the choice of τ, correcting the narrowing of the RIs. Further research is necessary to assess this.
The rewME relying on the YJ transformation seemed more capable in differentiating between significant positive skewness and mild skewness in the transformed distributions. This is a clear strength of applying a reweighted M-estimator criterion, that downweights values with high deviation from the bulk of the data, while retaining the specific characteristics of the underlying data during the linear transformation [18]. In the presence of even 10 % of outliers added to the tails of the distribution, the estimated reference limits were precise yet showed marginal bias. When applied on the HCV reference data, the rewRI performed best with the YJ transformation, as the precision of RI estimates with uneven distributions of outlying observations, and the accuracy of RIs with right-censored data were comparable to the target RIs and reflimR RIs without any preliminary outlier removal. This is important, as it allows the direct estimation of reference intervals even at low sample sizes, compared to other indirect reference estimation efforts which require larger reference populations. The real-world routine patient data, where the sample sizes of the age- and gender-stratified reference population were larger, and the suspected prevalence of outliers was bigger, the estimates obtained showcased a large variability across strata, yet they demonstrated ranges deemed clinically significant, as they offer to interpret the patients test result in a more personalised context. These are essentially personalised “expectation ranges”. The benefit of the rewRI method is that it combines the simplicity of parametric RI methods (which rely only on the three parameters: weighted mean, variance, and transformation parameter) with the complexity of real-world data. Further, the rewRI algorithm makes robust normalisation of clinical data possible by reducing the age- and gender-stratified populations into their weighted mean and variance that represent the underlying distribution closely. This simplifies the complexity of the data, clarifying how individual data points contribute to or associate with the optimised model. The normalisation is a critical step in many machine learning applications, as in scaling the data to a common input feature scale. This is inherently required for Support Vector Machine (SVMs) or Principal Component Analysis (PCA), which assume that features are centred around zero. The Yeo-Johnson (YJ) transformation as implemented in the rewRI method allows a robust normalisation and standardisation of real-world data, addressing various degrees of skewness, thus enabling algorithms to process data more uniformly.
Conclusions
To our knowledge this is the first approach in laboratory medicine that employs a reweighted M-estimator (rewME), based on machine learning, for the estimation of the transformation parameter of either the BC or the YJ transformation in RI estimation efforts. Our work showcases that even with a residual variability in the estimation of the optimal λ parameter with a reweighted MLE, it only marginally influences the precision and accuracy of the inferred RI in presence of outliers. With less than 15 % of outliers, the influence of these outliers on the MLE can be substantially mitigated, which enables the direct RI estimation approach. On one hand, this allows the reduction of dimensionality in routine real-world data by robustly estimating the population mean and variance of the appropriate Gaussian normalisation. In the era of personalised and data-driven machine learning approaches in clinical diagnostics, our method facilitates the reduction of clinical data into their most distinct features. On the other hand, the use of a robust methodology allows physicians to directly infer clinically viable and personalised expectation ranges. This can be helpful in older patients, where the rewRI method included values in RI estimation from ranges that would be considered pathological in younger and healthier patients, resulting in wider RIs. However, with increasing age, there seemingly is no clear definition of what is strictly “healthy” and what can be used as “reference”. This is why presenting expectation ranges allows us to fill the role of clinically relevant RIs in more and more multimorbid patients.
Funding source: Swiss Personalized Health Network
Award Identifier / Grant number: 2018DEV22
Acknowledgments
Collaborators: Prof. Dr. Jivko Stoyanov, Swiss Paraplegic Research, Nottwil, Switzerland; Prof. Dr. Martin Hersberger, University Children’s Hospital Zurich, Switzerland, Nicolas Rosat, Centre Hospitalier Universitaire Vaudois, Lausanne, Switzerland. The authors would like to thank the University Hospital Bern and the Swiss Personalized Health Network (SPHN) for funding, the SPHN Data Coordination Center and the team of the BioMedIT node at ETH Zürich for support, and most importantly all patients sharing their data.
-
Research ethics: The use of the anonymized dataset has been granted by the ethical waiver from the Bern cantonal Ethics Committee (Req-2020-00630), Switzerland.
-
Informed consent: Not applicable.
-
Author contributions: All authors have accepted responsibility for the entire content of this manuscript and approved its submission.
-
Competing interests: Alexander B. Leichtle is a member of the Task Force on Global Interval Database (TF-GRID) of the International Federation of Clinical Chemistry (IFCC). All other authors state no conflict of interest.
-
Research funding: This research has been funded by the Swiss Personalized Health Network (SPHN) grant number 2018DEV22.
-
Data availability: The raw data are not publicly available as they are subject to compliance with the General Data Protection Regulation (GDPR) but are available on reasonable request and conditional on ethics committee clearance from the corresponding author.
References
1. Koerbin, G, Sikaris, KA, Jones, GRD, Ryan, J, Reed, M, Tate, J, et al.. Evidence-based approach to harmonised reference intervals. Clin Chim Acta 2014;432:99–107. https://doi.org/10.1016/j.cca.2013.10.021.Suche in Google Scholar PubMed
2. Ceriotti, F, Hinzmann, R, Panteghini, M. Reference intervals: the way forward. Ann Clin Biochem 2009;46:8–17. https://doi.org/10.1258/acb.2008.008170.Suche in Google Scholar PubMed
3. Solberg, HE. International Federation of Clinical Chemistry. Scientific Committee, Clinical Section. Expert panel on theory of reference values and international committee for standardization in haematology standing committee on reference values. Approved recommendation (1986) on the theory of reference values. Part 1. The concept of reference values. Clin Chim Acta 1987;165:111–8. https://doi.org/10.1016/0009-8981(87)90224-5.Suche in Google Scholar PubMed
4. Clinical and Laboratory Standards Institute. Defining, establishing, and verifying reference intervals in the clinical laboratory: approved guideline, 3rd 3d. CLSI document EP28-A3c. Wayne, PA: Clinical Laboratory Standards Institute; 2008, 28:61 p.Suche in Google Scholar
5. Martinez-Sanchez, L, Marques-Garcia, F, Ozarda, Y, Blanco, A, Brouwer, N, Canalias, F, et al.. Big data and reference intervals: rationale, current practices, harmonization and standardization prerequisites and future perspectives of indirect determination of reference intervals using routine data. Adv Lab Med 2021;2:9–25. https://doi.org/10.1515/almed-2020-0034.Suche in Google Scholar PubMed PubMed Central
6. Jones, GRD, Haeckel, R, Loh, TP, Sikaris, K, Streichert, T, Katayev, A, et al.. Indirect methods for reference interval determination–review and recommendations. Clin Chem Lab Med 2018;57:20–9. https://doi.org/10.1515/cclm-2018-0073.Suche in Google Scholar PubMed
7. Henny, J. The IFCC recommendations for determining reference intervals: strengths and limitations/Die IFCC-Empfehlungen für die Bestimmung von Referenzbereichen: Stärken und Schwächen. J Lab Med 2009;33:45–51. https://doi.org/10.1515/jlm.2009.016.Suche in Google Scholar
8. Box, GEP, Cox, DR. An analysis of transformations. J R Stat Soc 1964;26:211–43. https://doi.org/10.1111/j.2517-6161.1964.tb00553.x.Suche in Google Scholar
9. Shine, B. Use of routine clinical laboratory data to define reference intervals. Ann Clin Biochem 2008;45:467–75. https://doi.org/10.1258/acb.2008.008028.Suche in Google Scholar PubMed
10. Geffré, A, Braun, JP, Trumel, C, Concordet, D. Estimation of reference intervals from small samples: an example using canine plasma creatinine. Vet Clin Pathol 2009;38:477–84. https://doi.org/10.1111/j.1939-165x.2009.00155.x.Suche in Google Scholar PubMed
11. Gillard, J. A generalised Box–Cox transformation for the parametric estimation of clinical reference intervals. J Appl Stat 2012;39:2231–45. https://doi.org/10.1080/02664763.2012.706266.Suche in Google Scholar
12. Ichihara, K, Ozarda, Y, Barth, JH, Klee, G, Qiu, L, Erasmus, R, et al.. A global multicenter study on reference values: 1. Assessment of methods for derivation and comparison of reference intervals. Clin Chim Acta 2017;467:70–82. https://doi.org/10.1016/j.cca.2016.09.016.Suche in Google Scholar PubMed
13. Ichihara, K, Yamashita, T, Kataoka, H, Sato, S. Critical appraisal of two Box-Cox formulae for their utility in determining reference intervals by realistic simulation and extensive real-world data analyses. Comput Methods Programs Biomed 2023;242:107820. https://doi.org/10.1016/j.cmpb.2023.107820.Suche in Google Scholar PubMed
14. Dean, RB, Dixon, WJ. Simplified statistics for small numbers of observations. Anal Chem 1951;23:636–8. https://doi.org/10.1021/ac60052a025.Suche in Google Scholar
15. Grubbs, FE. Procedures for detecting outlying observations in samples. Technometrics 1969;11:1–21. https://doi.org/10.1080/00401706.1969.10490657.Suche in Google Scholar
16. Tukey, JW. Exploratory data analysis. Reading, MA: Addison-Wesley Publishing Company; 1977:688 p.Suche in Google Scholar
17. Horn, PS, Feng, L, Li, Y, Pesce, AJ. Effect of outliers and nonhealthy individuals on reference interval estimation. Clin Chem 2001;47:2137–45. https://doi.org/10.1093/clinchem/47.12.2137.Suche in Google Scholar
18. Klawonn, F, Riekeberg, N, Hoffmann, G. Importance and uncertainty of λ-estimation for Box–Cox transformations to compute and verify reference intervals in laboratory medicine. Stats 2024;7:172–84. https://doi.org/10.3390/stats7010011.Suche in Google Scholar
19. Raymaekers, J, Rousseeuw, PJ. Transforming variables to central normality. Mach Learn 2021 Mar 21. https://doi.org/10.1007/s10994-021-05960-5 [Epub ahead of print].Suche in Google Scholar
20. Hoffmann, RG. Statistics in the practice of medicine. JAMA 1963;185:864–73. https://doi.org/10.1001/jama.1963.03060110068020.Suche in Google Scholar PubMed
21. Katayev, A, Fleming, JK, Luo, D, Fisher, AH, Sharp, TM. Reference intervals data mining: no longer a probability paper method. Am J Clin Pathol 2015;143:134–42. https://doi.org/10.1309/ajcpqprnib54wfkj.Suche in Google Scholar
22. Georg, H, Sandra, K, Frank, K. Reference limit estimation using routine laboratory data [R package reflimR version 1.0.6]. 2024 [cited 2024 Apr 15]. Available from: https://cran.r-project.org/web/packages/reflimR/index.html.Suche in Google Scholar
23. Hoffmann, G, Klawitter, S, Trulson, I, Adler, J, Holdenrieder, S, Klawonn, F. A novel tool for the rapid and transparent verification of reference intervals in clinical laboratories. J Clin Med 2024;13:4397. https://doi.org/10.3390/jcm13154397.Suche in Google Scholar PubMed PubMed Central
24. Blatter, TU, Witte, H, Fasquelle-Lopez, J, Raisaro, JL, Leichtle, AB. The BioRef infrastructure, a framework for real-time, federated, privacy-preserving, and personalized reference intervals: design, development, and application. J Med Internet Res 2023;25:e47254. https://doi.org/10.2196/47254.Suche in Google Scholar PubMed PubMed Central
25. Zierk, J, Arzideh, F, Haeckel, R, Rascher, W, Rauh, M, Metzler, M. Indirect determination of pediatric blood count reference intervals. Clin Chem Lab Med 2013;51:863–72. https://doi.org/10.1515/cclm-2012-0684.Suche in Google Scholar PubMed
26. Brian, R. Support functions and datasets for Venables and Ripley’s MASS [R package MASS version 7.3-61]. [Internet]. 2024 [cited 2024 Jun 18]. Available from: https://cran.r-project.org/web/packages/MASS/index.html.Suche in Google Scholar
27. Kouri, T, Kairisto, V, Virtanen, A, Uusipaikka, E, Koivula, T, Näntö, V. Reliability and adequacy of discharge diagnosis databases in the production of reference values. Scand J Clin Lab Invest Suppl 1995;222:69–73. https://doi.org/10.3109/00365519509088452.Suche in Google Scholar PubMed
28. Zellner, A, Richardson, AM, Lidbury, BA, Hobson, P, Badrick, T. An investigation into outlier elimination and calculation methods in the determination of reference intervals using serum immunoglobulin A as a model data collection. arXiv [stat. AP]. 2019. [Internet]. Available from: http://arxiv.org/abs/1907.0963.Suche in Google Scholar
Supplementary Material
This article contains supplementary material (https://doi.org/10.1515/labmed-2024-0076).
© 2024 the author(s), published by De Gruyter, Berlin/Boston
This work is licensed under the Creative Commons Attribution 4.0 International License.
Artikel in diesem Heft
- Frontmatter
- Editorial
- At the crossroads between statistics and artificial intelligence: statistical learning in laboratory medicine
- Articles
- Dear ChatGPT – can you teach me how to program an app for laboratory medicine?
- Using machine learning techniques for exploration and classification of laboratory data
- Standardization with zlog values improves exploratory data analysis and machine learning for laboratory data
- Automated sex and age partitioning for the estimation of reference intervals using a regression tree model
- Direct, age- and gender-specific reference intervals: applying a modified M-estimator of the Yeo-Johnson transformation to clinical real-world data
- How Gaussian mixture modelling can help to verify reference intervals from laboratory data with a high proportion of pathological values