Hematology instruments don’t speak the same language: a comparison study between flagging messages of sysmex XN-1000 and alinity H
-
Oana Roxana Oprea
 ,
Elena-Cristina Preda
,
Elena-Cristina Preda
 ,
Bogdana Dorcioman
,
Bogdana Dorcioman

Abstract
Objectives
While manual review is the gold standard, automated hematology analyzers are increasingly used. This study assessed the efficiency of white blood cell (WBC)-related flagging messages from the Sysmex XN-1000 and Alinity hq analyzers compared to peripheral blood smear (PBS) findings and evaluated their inter-platform agreement.
Methods
K3EDTA blood samples from hospitalized patients were analyzed using the Sysmex XN-1000. Samples triggering a morphology flag were reanalyzed on the Alinity hq, with PBS reviewed per CLSI protocol H20-A2-2007.
Results
Of 5530 samples, 196 had morphology-related flags requiring PBS review. Sysmex flagged 144 samples with leukocyte-related messages; Alinity flagged 120. The positive predictive value (PPV) for the Left Shift flag was 100 % for Sysmex and 77.5 % for Alinity; for Immature Granulocytes, it was 19.4 % for Sysmex and 94.6 % for Alinity. The Blast Flag’s PPVs were 9.3 % for Sysmex and 17.9 % for Alinity. Left Shift specificities were high (>94 %), but sensitivities varied. Sysmex showed 100 % sensitivity for the Blast flag but moderate specificity (53 %), while Alinity performed well (77–82 %). Agreement between platforms ranged from poor to good.
Conclusions
Tailored SOPs are crucial for optimizing laboratory workflow based on different flagging performances. Understanding each analyzer’s strengths and limitations improves interpretation and workflow management.
Introduction
The International Society for Laboratory Hematology (ISLH) has published guidelines for the management of flagged samples, however, in some cases, laboratories should follow their own Standard Operating Procedures (SOP) [1]. The complexity of interpreting complete blood count (CBC) flags is increasingly more challenging in multi-site clinical laboratories where two different platforms, each employing distinct technologies are used. A high rate of false positive flags will imply a significant number of blood smears that need to be prepared and reviewed, while a high false negative flag rate may lead to misguided interpretation of the results. Both situations are to the disadvantage of the patient either by increasing the turnaround time (TAT) of the results or by delaying the diagnosis if peripheral blood smear (PBS) is not performed. In order to meet the rigorous requirements of quality, time and high sample throughput the SOP must optimize as efficiently as possible the workflow in the laboratory and make the most out of the capabilities of the analyzers.
According to CLSI guidelines, the flagging performance of the hematology analyzers is evaluated in comparison either to the reference method or to another type of instrument [2]. In our laboratory two automated hematology analyzers are used: Sysmex XN-1000i (Sysmex, Kobe, Japan) and Alinity Hq (Abbott, Chicago, IL, USA). The Sysmex instrument analyses white blood cells (WBC) by fluorescent flow cytometry. The control unit converts cell-signals into scattergram and sends the data to the Information processing unit, where the system provides easy-to-understand flags/messages indicating the instrument’s findings [3]. Alinity Hq is a fully optical analyzer relying on MAPSS technology (multi-angle polarized scatter separation). Flags notify the operator when parameter results fail to meet the algorithm’s acceptance criteria, often attributed to abnormal cell morphology [4]. Therefore, not only the technology behind cell counting and characterization is different, but also the “language” used by the flagging system is particular. Questioning which of the analyzers is right may be fundamentally inappropriate, as both analyzers may be accurate but communicate the information very differently.
The aim of this study was to evaluate the efficiency of WBC-related flagging messages when two hematology platforms are used, by comparing the flagging messages both inter-platform and against gold standard method findings, the manual reviewed PBS.
Materials and methods
The study was performed between June-October 2022 in the Hematology Laboratory and Emergency Laboratory of the County Emergency Clinical Hospital (tertiary care) of Targu Mures, Romania. The study was approved by the Institutional Ethics Committee (No. Ad.16856/04.07.2022).
Blood samples from hospitalized patients were collected in K3EDTA tubes, then sent to the laboratory in biohazard bags in controlled conditions to preserve their integrity, via couriers, within the hospital. Samples were analyzed on Sysmex XN-1000 (software version 00.22-16) and all the samples with positive flag were reanalysed on Alinity hq (software version 4.3) within 2 h from collection. Also, PBS were stained with May–Grunwald–Giemsa (Merck) for all samples that triggered a morphology flag on Sysmex instrument regardless of cellular line and reviewed by two experienced laboratory doctors according to CLSI protocol H20-A2-2007 [5]. Efficiency of flagging performance was evaluated for Sysmex XN-1000 and Alinity hq hematology analyzers compared to PBS as the “gold standard” and between the two analyzers. PBS results were aligned with flag information following ISLH Guidelines for positive smear findings [1]. Additional data from CBC and scatter plots were integrated. For Immature Granulocyte (IG) the absolute number obtained was also compared between the two instruments.
Samples with WBC morphology-related flags (details with exact number of each flag are shown in Figure 1), appropriate PBS, and sufficient residual sample volume for further investigation were included. Exclusion criteria consisted of inadequate collection or transport, presence of clots, absence of flags, and short volume samples.
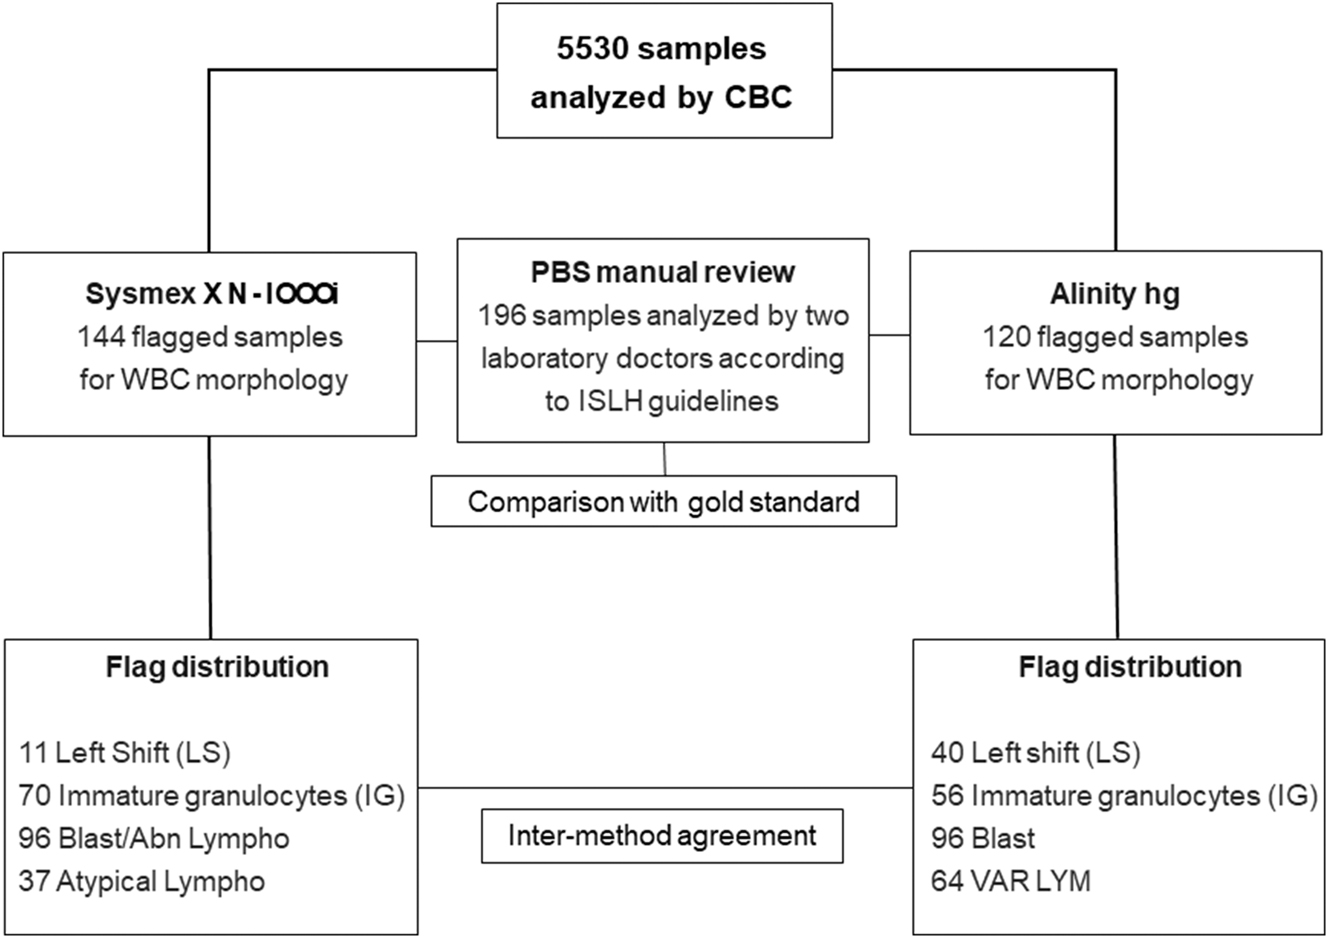
Graphical representation of the samples included in the study and the number of WBC flags. Blast/abnormal lymphocytes (Blast/Abn Lympho), variant lymphocytes (VAR LYM), atypical lymphocytes (Atypical Lympho).
The data was compiled using Microsoft Excel (Microsoft Corporation 2018). Statistical analyses, including sensitivity (Se), specificity (Sp), positive predictive value (PPV), negative predictive value (NPV), diagnostic accuracy, Chi-square and Fisher’s exact tests for evaluating the flags against PBS, were conducted using the “R” statistical program (version 4.1.3). Combined analyses of the flags against the PBS findings were also performed: Blast + VAR LYM and Left shift + IG for Alinity and Blast/Abn Lympho + Atypical Lympho and Left shift + IG for Sysmex. In this case a combined flag or PBS finding was considered positive if either one or both of its components were positive.
Kappa coefficient of agreement was used to compare flags between the two instruments, the results interpretation was made according to Cohen rules [6]. Bland-Altman and Passing-Bablok Regression analyses were performed using MedCalc software for the IG count comparison, and the mean of both methods was used.
Results
A total of 5530 CBCs were performed and for 196 (3.4 %) samples the PBS was stained and evaluated (including samples with RBC or PLT related flags–data not shown). Most samples were either from pediatric patients (n=120, 61.2 %) or from patients with hematological disorders (n=66, 33.6 %). Out of the 196 flagged samples, WBC-related flags occurred in 144 samples on Sysmex and in 120 samples on Alinity. Specificity of the WBC flags ranged from 53.4 % (for the Blast/Abn Lymphocytes) to 97.7 % (for IG flag). The diagnostic accuracy was over 77.5 % for most of the flags. Moderate accuracies were observed for the Blast/Abn Lympho flag of Sysmex (55.6 %) and VAR LYM of Alinity (68.3 %). The detailed results for WBC-related flags compared to PBS findings are shown in Figure 1 and Table 1, while the results of combination of flags against PBS findings are presented in Table 2.
WBC-related flagging performance of Sysmex XN-1000 and Alinity hq in comparison with peripheral blood smear findings.
| Sysmex XN-1000/PBS | Alinity hq/PBS | |||||||
|---|---|---|---|---|---|---|---|---|
| Left shift | IG present | Blast/Abn lympho | Atypical lympho | Left shift | IG count | Blast | VAR LYM | |
| TP | 11 | 54 | 9 | 14 | 31 | 53 | 7 | 20 |
| TN | 162 | 113 | 100 | 138 | 142 | 128 | 155 | 114 |
| FP | 0 | 16 | 87 | 23 | 9 | 3 | 32 | 44 |
| FN | 23 | 13 | 0 | 21 | 14 | 12 | 2 | 18 |
| Se, % | 32.35 (17.39–50.53) | 80.60 (69.11–89.24) | 100 (66.37–100) | 40 (23.87–57.89) | 68.89 (53.35–81.83) | 81.54 (69.97–90.80) | 77.78 (39.99–97.19) | 52.63 (35.82–69.02) |
| Sp, % | 100 (96.63–100) | 87.60 (80.64–92.74) | 53.48 (46.05–60.79) | 85.71 (79.34–90.72) | 94.04 (88.99–97.24) | 97.71 (93.45–99.53) | 82.9 (76.71–87.99) | 72.15 (64.47–78.98) |
| PPV, % | 100 (61.52–100) | 19.48 (7.94–38.32) | 9.38 (4.38–17.05) | 37.84 (22.46–55.24) | 77.5 (61.55–89.16) | 94.64 (85.13–98.88) | 17.95 (7.54–33.53) | 31.25 (20.24–44.06) |
| NPV, % | 87.57 (81.93–91.95) | 99.18 (96.34–99.95) | 100 (96.38–100) | 86.79 (80.52–91.63) | 91.03 (85.4–95.01) | 91.43 (85.51–95.49) | 98.73 (95.47–99.85) | 86.36 (79.31–91.71 |
| p-Value | <0.01a | <0.01 | <0.01a | <0.01 | <0.01 | <0.01a | <0.01a | <0.01 |
| Accuracy, % | 88.27 (82.91–92.41) | 85.20 (79.45–89.86) | 55.61 (48.36–62.69) | 77.55 (71.06–83.19) | 88.27 (82.91–92.41) | 92.35 (87.69–95.65) | 82.65 (76.61–87.68) | 68.37 (61.36–74.81) |
-
PBS, peripheral blood smear; TP, true positive; TN, true negative; FP, false positive; FN, false negative; PPV, positive predictive value; NPV, negative predictive value; Se, sensitivity; Sp, specificity; IG, immature granulocytes; Abn Lympho, abnormal lymphocytes; Atypical Lympho, atypical lymphocytes; VAR LYM, variant lymphocytes. aValue computed with Fisher’s exact test.
Combined WBC-related flagging performance of Sysmex XN-1000 and Alinity hq in comparison with peripheral blood smear findings.
| Sysmex XN-1000/PBS | Alinity hq/PBS | |||
|---|---|---|---|---|
| Left shift + IG present | Blast/Abn lympho + Atypical lympho | Left shift + IG count | Blast + VAR LYM | |
| TP | 55 | 41 | 56 | 30 |
| TN | 109 | 151 | 117 | 97 |
| FP | 16 | 70 | 6 | 50 |
| FN | 16 | 4 | 17 | 19 |
| Se, % | 77.46 (66.00–86.54) | 91.11 (78.78–97.52) | 76.71 (65.35–85.81) | 61.22 (46.24–74.80) |
| Sp, % | 87.20 (80.05–92.50) | 68.33 (61.75–74.40) | 95.12 (89.68–98.19) | 65.99 (57.72–73.59) |
| PPV, % | 77.46 (66.00–86.54) | 36.94 (27.97–46.62) | 90.32 (80.12–96.37) | 37.50 (26.92–49.04) |
| NPV, % | 87.20 (80.05–92.50) | 97.42 (93.52–99.29) | 87.31 (80.47–92.43) | 83.62 (75.61–89.84) |
| p-Value | <0.01 | <0.01a | <0.01 | <0.01 |
| Accuracy, % | 83.67 (78.50–88.85) | 72.20 (68.00–74.20) | 88.27 (82.91–92.41) | 64.80 (58.11–71.48) |
-
PBS, peripheral blood smear; TP, true positive; TN, true negative; FP, false positive; FN, false negative; PPV, positive predictive value; NPV, negative predictive value; Se, sensitivity; Sp, specificity; IG, immature granulocytes; Abn Lympho, abnormal lymphocytes; atypical Lympho, atypical lymphocytes; VAR LYM, variant lymphocytes. aValue computed with Fisher’s exact test.
The flag inter-agreement between the two instruments varied from poor, regarding lymphocyte morphology flags, to good for the IG flag. The Kappa coefficients for the flag messages of the two instruments are shown in Table 3.
Kappa Coefficients for the agreement of the two instruments.
| Flag | Kappa | Confidence interval | Interpretation |
|---|---|---|---|
| Left Shift + left shift | 0.33 | 0.17–0.49 | Fair agreement |
| IG | 0.67 | 0.56–0.78 | Good agreement |
| Blast + blast/Abn. Lymph | 0.34 | 0.24–0.45 | Fair agreement |
| VAR LYM + Atypical lympho | 0.18 | 0.04–0.32 | Poor agreement |
| VAR LYM + blast/Abn. Lympho | 0.50 | 0.39–0.62 | Moderate agreement |
-
IG, immature granulocytes; Abn Lympho, abnormal lymphocytes; Atypical Lympho, atypical lymphocytes; VAR LYM, variant lymphocytes.
For the IG count the samples were divided into two groups: group A with IG count ≤0.1 × 10⁹/L and group B with>0.1 × 10⁹/L. This separation of the group was performed after the statistical analysis of the data and considering the thresholds for flag messages of the instruments. Group A included 125 samples, revealing a mean difference of 0.01 (−0.06 to 0.08) *109/L according to Bland Altman analysis. In group B, which consisted of 71 samples, a mean difference of 0.14 (−0.46 to 0.74) was found.
The regression equation for IG count Group A was y=0.010 + 1.000*x (CI for intercept 0.010–0.012, CI Slope 0.731–1.400, and p<0.01 significant deviation from linearity), with R2=0.224, and Group B y=0.098+1.058*x (CI for Intercept 0.085–0.101, CI for Slope 0.979–1.211, and p=0.45, no significant deviation from linearity), with R2=0.992. The graphics are represented in Figure 2.
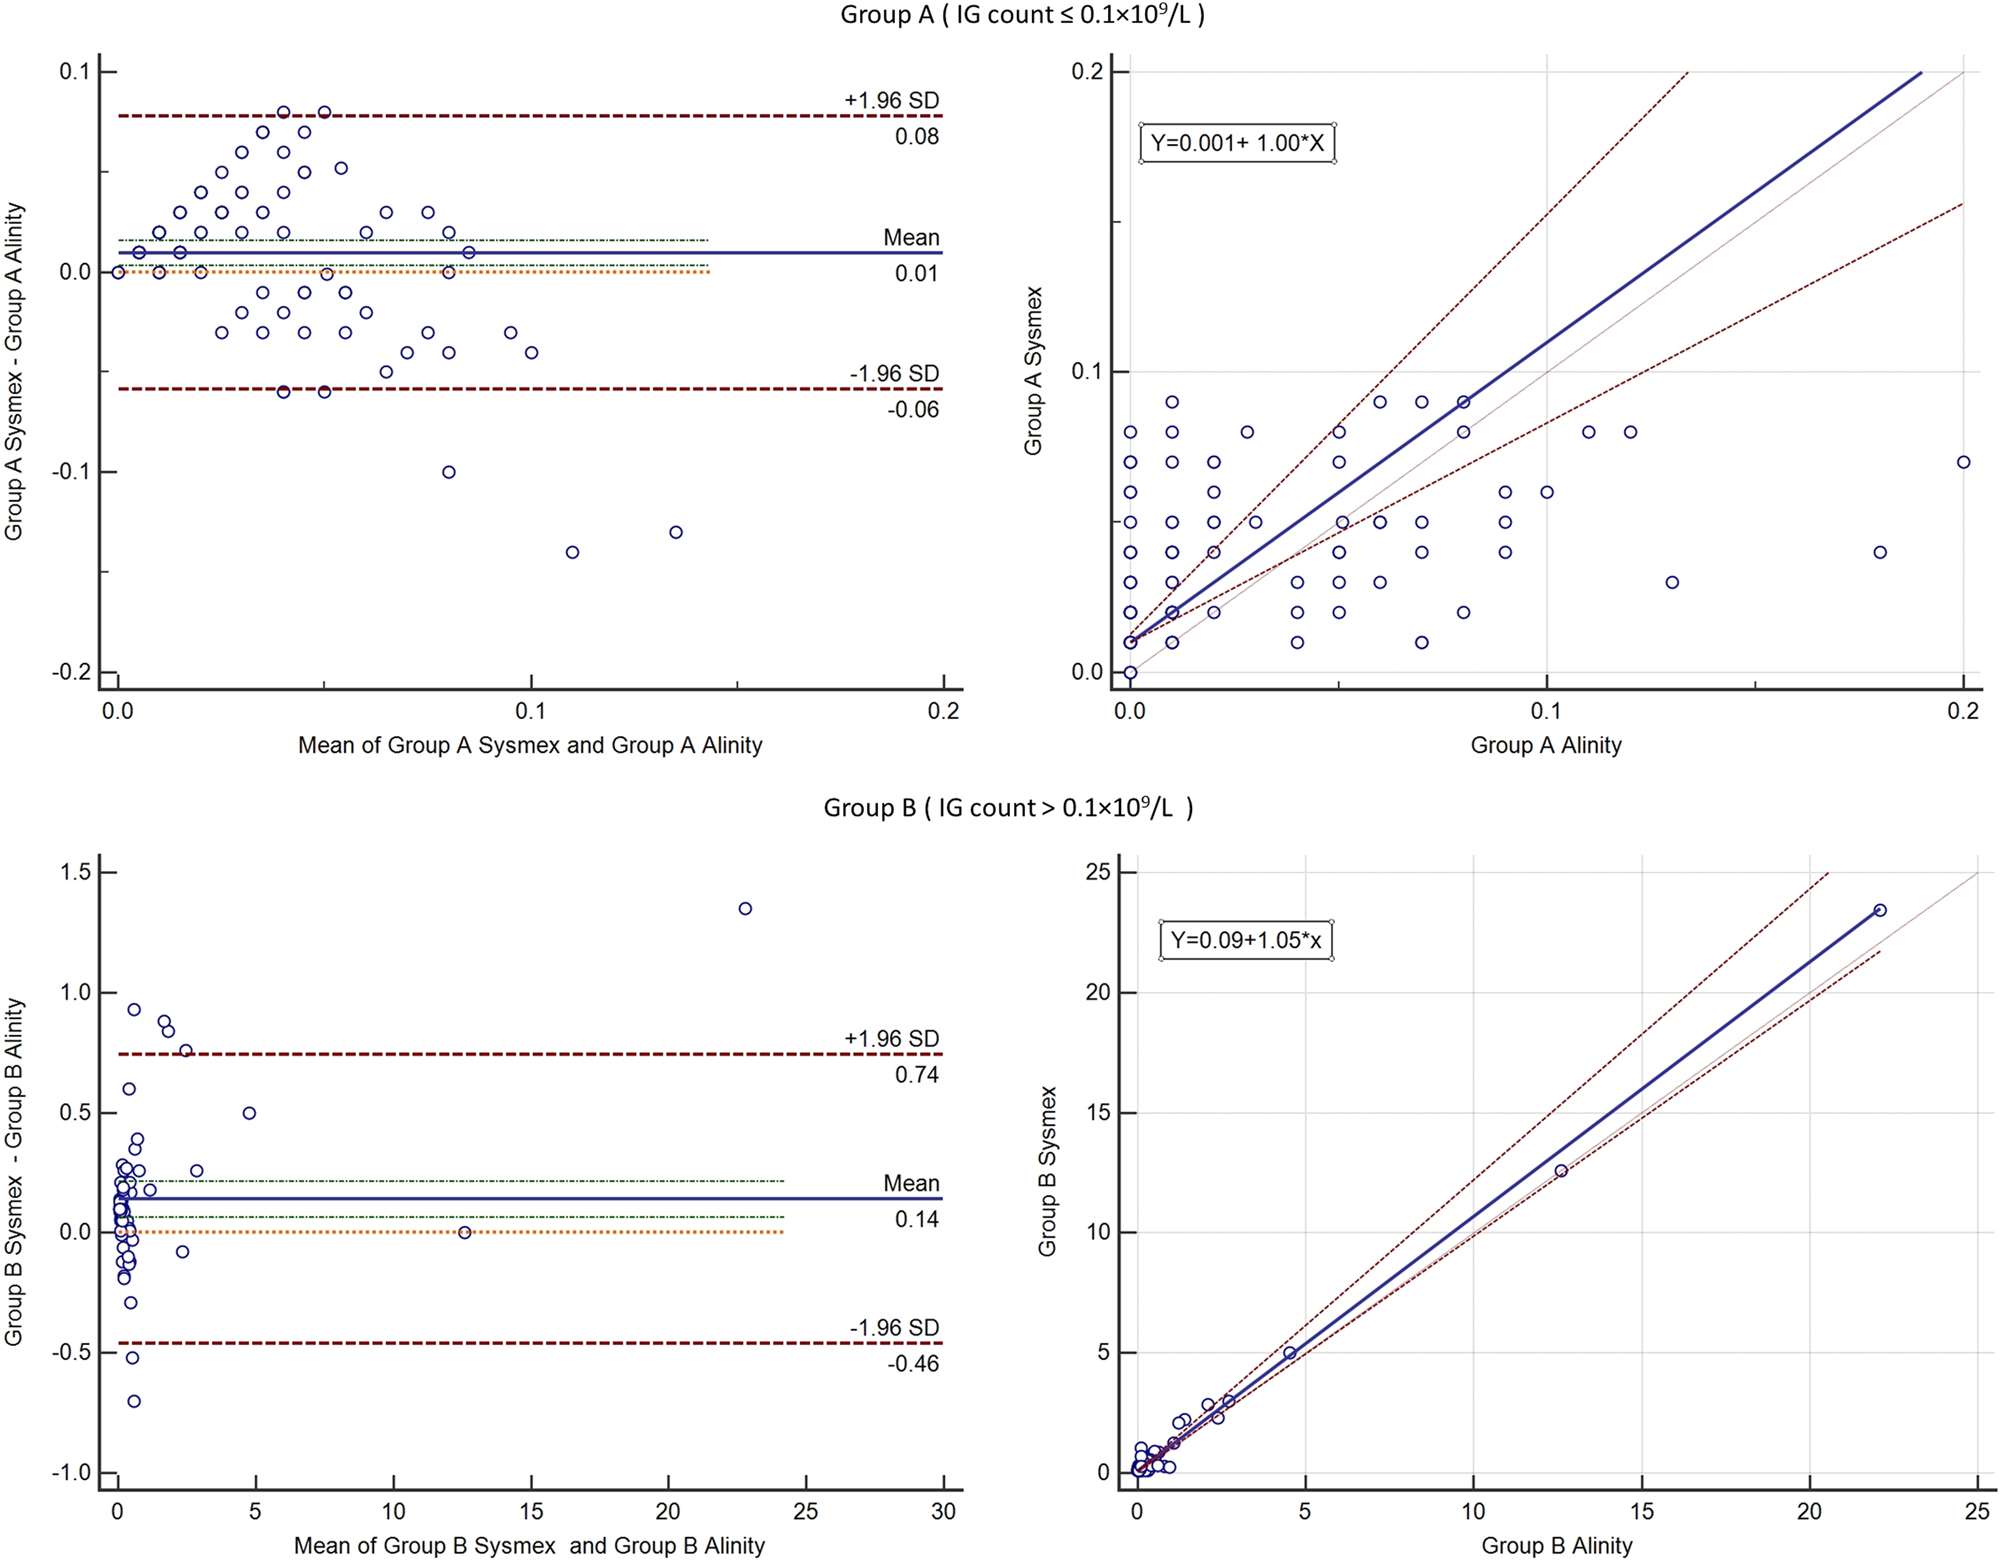
Results of the Bland Altman analysis (left) and Passing-Bablok regression (right) for immature granulocytes on sysmex XN-1000 and alinity hq. The upper half shows the analysis for group A and the lower half analysis for group B.
Discussion
Main findings
Previously was reported that, despite using different technologies, there is a good agreement regarding cell differentiation and counting between the Alinity hq hematology analyzer and the Sysmex platforms [7]. This study aimed to further explore the comparability of these two platforms by investigating the accuracy and agreement of WBC-related flagging messages. In the present study, the agreement between the two instruments ranged from poor (for the Abnormal Lymphocytes) to good agreement (for IG flags). The high degree of agreement for IG between the instruments is also demonstrated by the results of the Bland Altman test and Passing-Bablok regression analysis.
Left shift
According to the ISLH guidelines, the laboratory should follow its own SOP when samples are flagged as “Left shift”. For this flag, a Se of 32.3 % was obtained for the Sysmex analyzer, and in 10/11 flagged samples, there was also an “Immature granulocyte” (IG) flag. A study investigating the flagging performance of the Sysmex XN series instruments reported that 7/15 samples flagged as “Left shift” also presented a secondary flag indicating atypical lymphocytes or blasts. However, the authors did not provide information regarding the number of samples with increased IG counts or IG flags [8]. In another study, the Se reported was 59.7 % with a Sp of 95.1 % for the Sysmex instrument but the population included were mostly patients undergoing chemotherapy or with known haematological malignancies [9].
For the Alinity analyzer, the Se was 68.8 %. In our study, a much higher PPV was found compared with the initial evaluation of the Alinity prototype (77.5 versus 61.4 %) [10]. This result may be explained by the different software version used by our Alinity hq.
Only a fair agreement was obtained between the two analyzers. Consequently, in cases where samples flagged positively on the Sysmex system, repeating the analysis on the Alinity platform may reduce the necessity for PBS needed. However, it is essential to note that when data concerning “Left shift” are concomitant with IG flags or values, the SOP should follow the recommendations for IG from ISLH.
Immature granulocytes
A PBS positive finding for immature granulocytes is defined by the ISLH guidelines as either >2 % metamyelocytes or >1 % (pro)myelocytes. In the present study, Sysmex XN-1000 showed a good Sp of 87.6 %. A study where Sysmex XN series instruments were compared with the Advia hematology analyzer platform, reported a specificity that is comparable to the one observed in the actual study (82.0 %) [11]. In a comparison between Sysmex analyzer and PBS, a Sp of 98.9 % was reported [9].
Alinity hq showed a similar Sp (97.7 %). An 81.5 % Se for the IG count with a flagging threshold >1 % was found independently of left shift flags. In a previous evaluation, Alinity hq prototype showed an identical left shift Se of 58.2 % and a slightly higher left shift Sp (92.7 vs. 97.7 %) compared to the CELL-DYN Sapphire automated hematology system [10]. However, in that study, the left shift and IG count >1 % were evaluated together [10].
It is important to understand that, while Alinity hq also counts IGs, the two analyzers have different flagging criteria: IG >0.1 × 10⁹/L for Sysmex and IG >1 % for Alinity. Thus, at least in theory, flagging differences between the two analyzers may be a result of just that: different approaches to flagging thresholds (absolute count vs. percentages).
In six samples from group B (IG>0.1 × 10⁹/L), the difference of the IG count between the two instruments was outside the confidence interval of the mean difference. However, all six samples were from patients with hematological disorders (Acute Myeloid Leukemia or Myelofibrosis), three samples with >20 % monocytic blast cells and three samples with erythroblasts.
In other study, a small difference (−0.6 %) was found between results of the IG obtained with Alinity hq in comparison with flowcytometry and manual differential count [12]. Similarly, for the Sysmex instrument and the manual review comparison, small and clinically insignificant differences (less than 3 %) was found in samples with IG ≤6 % [13]. In samples with IG >6 % it is expected to have supplementary flags triggered which should prompt a PBS evaluation. Group’s A deviation from linearity may be explained by a high number of samples with “0” values (52 samples) on Alinity, such small values could not be successfully correlated by a regression equation, the coefficient of determination of the regression being small (0.2). In the study [13] that compared the Sysmex IG with PBS findings, the regression equation was y=1.011 + 0.2039*x; the difference may be explained that in our group only samples with IG<0.1 × 10⁹/L were included while in the referenced study samples with a high range of values were included. Also, the regression was performed with PBS not between two instruments. The group B regression equation is more suited for absolute value comparation, with no significant deviation from linearity. Although the intercept can be considered statistically significant (CI: 0.085–0.101), it is reasonable to accept this difference as not medically significant.
Left shift and immature granulocytes
For Sysmex combining the two flags resulted in an improved Se and lower Sp compared to Left shift alone, while for Alinity improvement was noted in Se compared to Left shift alone. The performance of the combined flags overcame the insufficiencies of each flag individually, the only exception was for NPV (87.3 %) where on Alinity both flags had higher NPVs independently.
Blasts and abnormal lymphocytes
On the Sysmex instrument, 96 samples were flagged as “Blast/Abn Lympho”. Of these, 22 also had an “Atypical lympho” flag, 27 showed positive IG findings on PBS, 47 had lymphocytosis and/or monocytosis, and only 9 samples were confirmed with blast cells after PBS review, resulting in a Sp of 53.4 %. A similar result was reported by another study evaluating the Sysmex XN series instruments by PBS reviews and reflex WPC channel testing, where only 4/55 flagged samples presented blast cells, while 30 exhibited abnormal or atypical lymphocytes [8]. Other studies that assessed the performance of other instruments in XN series showed high specificities of 84.9 and 97.0 % [9], 14]. In the present study, the Se of Sysmex vs. manual review was 100 %, aligning with the reported Se of Sysmex XN series (100 %) when compared to the Advia platform [14].
Alinity hq flagged 39 samples as “Blast?” Among the 32 false-positive samples, 20 displayed a “VAR LYM” flag, 10 had lymphocytosis and/or monocytosis, and 2 were from patients with malignant pathologies. In a previous evaluation of Alinity hq’s prototype, the highest Se achieved was 70 %, focusing on samples with >5 % blasts [10]. In the current study, even when assessing a more diverse sample set, a slightly higher Se (77.7 %) was recorded, which could also be explained by the differences in the software version used.
Regarding the comparison between analyzers, out of the 96 samples flagged by Sysmex, 60 were negative on Alinity hq and only a fair agreement was obtained. Therefore, a sample flagged as “Blast/Abn Lympho” by Sysmex may be retested on Alinity in order to reduce the need for manual PBS reviews. This divergence in results between the two analyzers is attributed to their distinct technologies and the wide morphological variety of abnormal/atypical lymphocytes.
Atypical lymphocytes
“Atypical Lympho” and “VAR LYM” are similar flags for both analyzers. Sysmex’s “Atypical Lymphocytes” flag showed a low Se (40.0 %). Out of 37 samples with a positive manual review finding (>5 % atypical/reactive lymphocytes [1]), 14 were flagged with “Atypical Lymphocytes” and 21 with “Blast/Abn Lympho”. While Sysmex effectively identified atypical/abnormal lymphocytes, the presence of a flag expressed as “Blast?Abn Lympho” can be confusing, despite ISLH guidelines mandating slide reviews in both cases.
The Alinity analyzer’s “VAR LYM ” flag showed a Sp of 72.1 %, but its Se may be impacted by the presence of lymphocytosis or monocytosis in nearly half of the samples. Even if the two instruments have different technologies, it seems that when atypical lymphocytes are present, much like in manual review, an agreement is not easily reached. The agreement between the two instruments was moderate.
Blasts, abnormal lymphocytes and atypical lymphocytes
Considering the morphology of blasts (myeloblasts or lymphoblasts), reactive lymphocytes and the technology challenges in identifying them, an analysis combining the flags regarding these cells seemed mandatory. As well known, the Sysmex instrument already has a flag “Blast?Abn Lympho” which may include the blast cells or abnormal lymphocytes. Combining this flag with the “Atypical lymph” did not bring an overall improvement. The Alinity instrument has designated flags for blasts and atypical lymphocytes. Combining the “Blast” and “VAR LYM” resulted in a better performance regarding PPV (37.5 %), but lower Sp (65.9 %) than each flag individually.
Using two CBC platforms may not apply to all laboratories, it is common in large hospitals with multi-site labs. Based on our experience in an emergency laboratory, reanalyzing samples flagged as Blast/Abnormal Lymphocytes by the Sysmex instrument, on the Alinity platform may be beneficial. Despite ISLH recommendations to perform PBS for initial samples and not ignore any flags, performing PBS tests for this flag is inefficient compared to rerunning the sample on another platform.
Study limitations
The interpretation of Atypical Lymphocytes was not strictly guided by ISLH standards, given the subjectivity of these terms among laboratory personnel and the difficulty in reaching a consensus. Another study limitation is the low number of blast cells that were confirmed by PBS although we had a high proportion of patients with hematological pathology. The Q value (probability of presence of abnormal cells on an arbitrary scale) for the Sysmex instrument was not included in the evaluation since the Alinity Instrument does not provide a Q value and the aim of the study was to compare the performance of the instruments in laboratories that use simultaneously the two platforms. Although samples included in the study referred to multiple morphological abnormalities, regardless of cell lineage, the sample selection based on flags triggered by the Sysmex instrument is an important limitation.
Conclusions
The Sysmex XN-1000 and Alinity hq hematology analyzers employ different technologies for cell counting and differentiation. This study demonstrates that utilizing both analyzers within the same laboratory presents challenges, as their flag results may sometimes overlap or conflict. In the absence of clear ISLH guidelines, such situations require the laboratory to established evidence-based SOP, according to own laboratory flagging performance.
The PBS serves as the gold standard for assessing cell morphology and identifying atypical blood cells. However, this method is more elaborate and time-consuming than an automated CBC. Therefore, it is crucial for laboratories to evaluate the flagging performance of their hematology analyzers in order to fully comprehend their strengths and limitations so that they can be appropriately incorporated into SOP aimed at improving the workflow and overall performance of the laboratory.
Acknowledgments
We thank our colleague Dr. Molnar Eniko for helping us review the blood smears and the laboratory personnel that helped maintain a good workflow in our research.
-
Research ethics: The study was approved by the Institutional Ethics Committee (No. Ad.16856/ 04.07.2022).
-
Informed consent: Not applicable.
-
Author contributions: The authors have accepted responsibility for the entire content of this manuscript and approved its submission. OO and DM contributed to the conception and design of the study; PEC, BHD were involved in sample and data collection; DB reviewed the PBS; OO performed the statistical analysis; OO and PEC drafted the manuscript; and DM supervised the study. All authors read and approved the final manuscript.
-
Use of Large Language Models, AI and Machine Learning Tools: None declared.
-
Conflict of interest: The authors state no conflict of interest.
-
Research funding: None declared.
-
Data availability: The raw data can be obtained on request from the corresponding author.
References
1. Barnes, PW, McFadden, SL, Machin, SJ, Simson, E, International Consensus Group for Hematology. The international consensus group for hematology review: guidelines: suggested criteria for action following CBC and WBC differential analysis. Int J Lab Hematol 2005;11:83–90. https://doi.org/10.1532/lh96.05019.Suche in Google Scholar
2. CLSI. Validation, verification, and quality assurance of automated hematology analyzers Approved Standard, 2nd ed. Wayne PA: Clinical and Laboratory Standard Institute; 2010. CLSI Document H26:A2.Suche in Google Scholar
3. Sysmex Corporation. Automated hematology analyzer XN series (XN-1000) instructions for use. 2012: 417–424 pp.Suche in Google Scholar
4. Abbott. Principles of operation. In: Abbott Alinity h-series operations manual. Santa Clara: Abbott Laboratories; 2019:275–304 pp.Suche in Google Scholar
5. CLSI Reference Leukocytes (WBC). Differential count and evaluation of instrumental methods. Approved Standard, 2nd ed. Wayne PA: Clinical and Laboratory Standard Institute; 2007. CLSI Document H20:A2.Suche in Google Scholar
6. McHugh, ML. Interrater reliability: the kappa statistic. Biochem Med 2012;22:276–82. https://doi.org/10.11613/bm.2012.031.Suche in Google Scholar
7. Preda, CE, Oprea, OR, Manescu, IB, Dobreanu, M. Method comparison between Alinity hq and Sysmex XT-4000i in an emergency laboratory. Scand J Clin Lab Invest 2023;83:31–7. https://doi.org/10.1080/00365513.2022.2164516.Suche in Google Scholar PubMed
8. Schoorl, M, Schoorl, M, Chevallier, M, Elout, J, van Pelt, J. Flagging performance of the XN-2000 hematology analyzer. Int J Lab Hematol 2016;38:160–6. https://doi.org/10.1111/ijlh.12461.Suche in Google Scholar PubMed
9. Ramiah, J, Pillay, D, Rapiti, N. Performance of the automated sysmex XN-3000 analyser for detecting white blood cell abnormalities in South Africa. Afr J Lab Med 2023;12:2140. https://doi.org/10.4102/ajlm.v12i1.2140.Suche in Google Scholar PubMed PubMed Central
10. Slim, CL, Wevers, BA, Demmers, MWHJ, Lakos, G, Hoffmann, JJML, Adriaansen, HJ, et al.. Multicenter performance evaluation of the Abbott Alinity Hq hematology analyzer. Clin Chem Lab Med 2019;57:1988–98. https://doi.org/10.1515/cclm-2019-0155.Suche in Google Scholar PubMed
11. Schapkaitz, E, Raburabu, S. Performance evaluation of the new measurement channels on the automated Sysmex XN-9000 hematology analyzer. Clin Biochem 2018;53:132–8. https://doi.org/10.1016/j.clinbiochem.2018.01.014.Suche in Google Scholar PubMed
12. Gambell, P, Rowley, G, Pham, TAT, Dang, TL, Mulumba, H, Smith, L, et al.. Accurate white blood cell differential by Alinity hq: a comparison with flow cytometry and manual differential. Int J Lab Hematol 2022;44:288–95.10.1111/ijlh.13764Suche in Google Scholar PubMed
13. Linko-Parvinen, AM, Kurvinen, K, Tienhaara, A. Accuracy of Sysmex XN immature granulocyte percentage compared to manual microscopy. J Lab Precis Med 2021;6:27.10.21037/jlpm-21-33Suche in Google Scholar
14. Seo, JY, Lee, S-T, Kim, S-H. Performance evaluation of the new hematology analyzer Sysmex XN-series. Int J Lab Hematol 2015;37:155–64.10.1111/ijlh.12254Suche in Google Scholar PubMed
© 2024 the author(s), published by De Gruyter, Berlin/Boston
This work is licensed under the Creative Commons Attribution 4.0 International License.
Artikel in diesem Heft
- Frontmatter
- Editorial
- Can a digital smear review be helpful in the routine haematology laboratory?
- Original Articles
- The impact of mutational burden, spliceosome and epigenetic regulator mutations on transfusion dependency in dysplastic neoplasms
- Improving turn-around times in low-throughput distributed hematology laboratory settings with the CellaVision® DC-1 instrument
- Hematology instruments don’t speak the same language: a comparison study between flagging messages of sysmex XN-1000 and alinity H
- Platelet clump assessment using the Cellavision peripherical blood application – do we need manual microscopy?
- Short Communication
- Development of a peripheral blood morphology proficiency assessment program using the CellaVision® Proficiency Software
- Images From the Medical Laboratory
- Giant granules in white blood cells