Age-and sex-specific reference intervals of total cholesterol, LDL cholesterol, HDL cholesterol and non-HDL cholesterol. Comparison of two algorithms for the indirect estimation of reference intervals
-
Rainer Haeckel

 ,
Tatjana Ammer
,
Tatjana Ammer

Abstract
Objectives
Reference intervals of total cholesterol concentrations in plasma and of their fractions low-density lipoprotein (LDL)-, high-density lipoprotein (HDL)-and non-HDL concentrations are seldom studied with respect to the relevance of age and sex. Therefore, the effect of age and sex on the reference intervals was reinvestigated with 2 indirect procedures.
Methods
As an indirect approach, the truncated minimum chi-square method was applied. All analyses were performed by computer programs available. The script published on the homepage of the German Society of Clinical Chemistry and Laboratory Medicine (DGKL) allows to derive a continuous age dependency of reference intervals together with their confidence and equivalence limits. The results of this approach were compared with those obtained by an indirect method developed more recently, the refineR algorithm.
Results
In the present study, the upper reference limits of total cholesterol varied from 5.1 to 7.8 mmol/L (197–302 mg/dL) depending on various biological variables (as age, sex, inpatients versus outpatients). These upper limits increased with age. Differences between sexes can be neglected except for the age above 80 years. The pattern of reference limits of LDL cholesterol and non-HDL cholesterol paralleled those of total cholesterol. The reference limits of HDL cholesterol were higher in women than in men but were independent of age.
Conclusions
Reference limits for the concentrations of total cholesterol and their fractions LDL-, HDL-and non-HDL concentrations should be stratified for age and sex.
Introduction
The concept of risk factors for the occurrence of coronary heart disease (CHD) has been extensively described in several international guidelines and recommendations [1, 2]. One well established risk factor is the lipid status, most often measured as plasma concentrations of total cholesterol (TC), low-density lipoprotein cholesterol (LDLC), high-density lipoprotein cholesterol (HDLC) and non-HDL cholesterol (non-HDLC).
It is common practice and even requested by the Guidelines of the German Medical Association on Quality Assurance in Medical Laboratory Examinations (RiliBAEK) [3] that test results from medical laboratories are provided to requesters together with some kind of guidance to assist medical decisions. Guide limits may be either reference limits (RLs), decision limits, action limits, or therapeutic limits [4]. In the case of plasma cholesterol most laboratories apply action limits. These limits are usually taken from studies published several decades ago. A well-known and still often used action limit is 5.17 mmol/L (200 mg/dl) [5, 6]. Newer recommendations reduced this limit to 5.0 mmol/l (193 mg/dl) [7, 8]. Age and sex dependency were often neglected. However, current prevention guidelines recognized the importance of integrating sex and age [8]. With the upcoming popularity of indirect approaches for estimating RLs it has become evident that more stratification strategies are required to avoid false classifications of patients [9]. The most relevant biological variables are age and sex.
Action limits are only designed for preventing heart disease or cerebral stroke. For all other situations reference limits (RLs) as limits of reference intervals (RIs) may be required. Ridefelt et al. [10] also emphasized the need for reference intervals of lipid fractions. The present study was undertaken to investigate the influence of sex and age on the RLs of TC, LDLC, HDLC and non-HDLC in plasma and serum obtained by two indirect approaches. The script of one algorithm allows a continuous determination of RLs with increasing age and the estimation of equivalence limits.
Materials and methods
Cholesterol concentrations were determined on instruments from Roche Diagnostics International Ltd (Rotkreuz, Switzerland) in two primary care laboratories, laboratory 1 (Labor Dr. Volkmann, Karlsruhe, Germany, Cobas c701, serum, n=700,794, collection time 2014–2021,) and laboratory 2 (Amedes, Hanover, Germany, Cobas c701, heparin plasma, n=112,973, 2018–2021) and in 2 university hospitals, laboratory 3 (Kiel, Germany, Cobas c702, heparin plasma, outpatients n=98,129, inpatients n=112,973, 2015–2021) and laboratory 4 (Bochum, Germany, inpatients, n=38,847, 2010–2021). Laboratory 1 and laboratory 2 received fewer than 5% samples from hospitalized patients (inpatients). Laboratory 3 excluded in-patients from special wards (e.g. intensive care units and gynaecological units to minimize the number of pregnant women in the data analysed). Laboratory 4 received more than 90% samples from hospitalized patients and, thus, excluded outpatients from further analyses. Subpopulations of the primary health care sector usually have lower prevalences (lower percentage of diseased subjects) than hospitalized patients. Therefore, no subjects were excluded from primary health care data.
All laboratories applied the same enzymatic procedure [11] and were accredited according to ISO 15189 and followed the RiliBAEK [3]. The analytical methods were applied as described by the manufacturers. Non-HDLC was calculated as the difference between the concentrations of TC and HDLC [12, 13]. The laboratories used either heparin-plasma or serum.
Algorithms for the indirect determination of reference limits
Reference limits were estimated indirectly from “big data” pools stored in laboratory information systems applying the truncated minimum chi-square approach (TMC) and the refineR method. These methods are described more detailed in the Supplementary Appendix.
Confidence limits were calculated automatically [14]. For most cases, these limits were relatively narrow due to the large data sets. The confidence limits describe the statistical uncertainty of the estimated RLs, but not the medically relevant uncertainty. Therefore, we calculated equivalence limits (EL) as described recently [15]. These limits are based on the permissible analytical standard deviation at the corresponding RL (psA,RL) calculated automatically by the software program for each particular age interval at the mean of the age interval chosen (EL=RL ± psA,RL ∙ 1.28) [16]. The factor 1.28 is the 90% quantile of the standard normal distribution (one-sided confidence interval of about 95%). Two RLs were considered clinically equivalent if their equivalence intervals overlapped.
Data selection and sources
The laboratory results of patients were selected as described earlier [17]: only first values were used if several results from the same patient were obtained during a hospital stay or during the data selection time. First values were chosen to avoid ties (correlated observations from the same patient, which is against the assumptions of both direct and indirect methods).
The time period for collecting the data (data acquisition time) was either one or several years. The stability of the analytical procedure during the data acquisition time was verified by plotting the monthly medians with confidence limits as described previously [15, 17].
Results
Total cholesterol
The RIs of TC found in the 4 laboratories were very similar and the two algorithms agreed within the equivalence limits (Supplementary Table 1). The upper RLs (uRLs) were nearly identical for men and women between 16 and 29 years. The mean values of the uRLs slightly increased in men up to the age of about 40 years and stayed constant up to 65 years (Figure 1A–C). Beyond that age, the uRLs decreased (convex pattern). In women, the uRLs were lower than in men up to 40 years and higher than in men above 50–60 years (postmenopausal) than in men. This sigmoid pattern in women was observed in all laboratories. Despite these slight differences between women and men, sex stratification appeared not relevant because the equivalence limits between men and women overlapped between 18 and 80 years. Beyond 80 years, the uRLs for men decreased and were lower than those for women. In laboratory 3, the uRLs were similar between outpatients and inpatients. As the RIs were similar in all laboratories, the uRLs from laboratory 3 (hospitalized) were used as the median between all laboratories: the uRL (16–24 years) for both sexes was 5.8 mmol/L (224 mg/dL), and the uRL (25–90 years) for women was 7.7 mmol/L (298 mg/dL). For men the uRL (25–80) was 7.3 mmol/L (282 mg/dL) and the uRL (80–90 years) was 6.5 mmol/L (251 mg/dL).
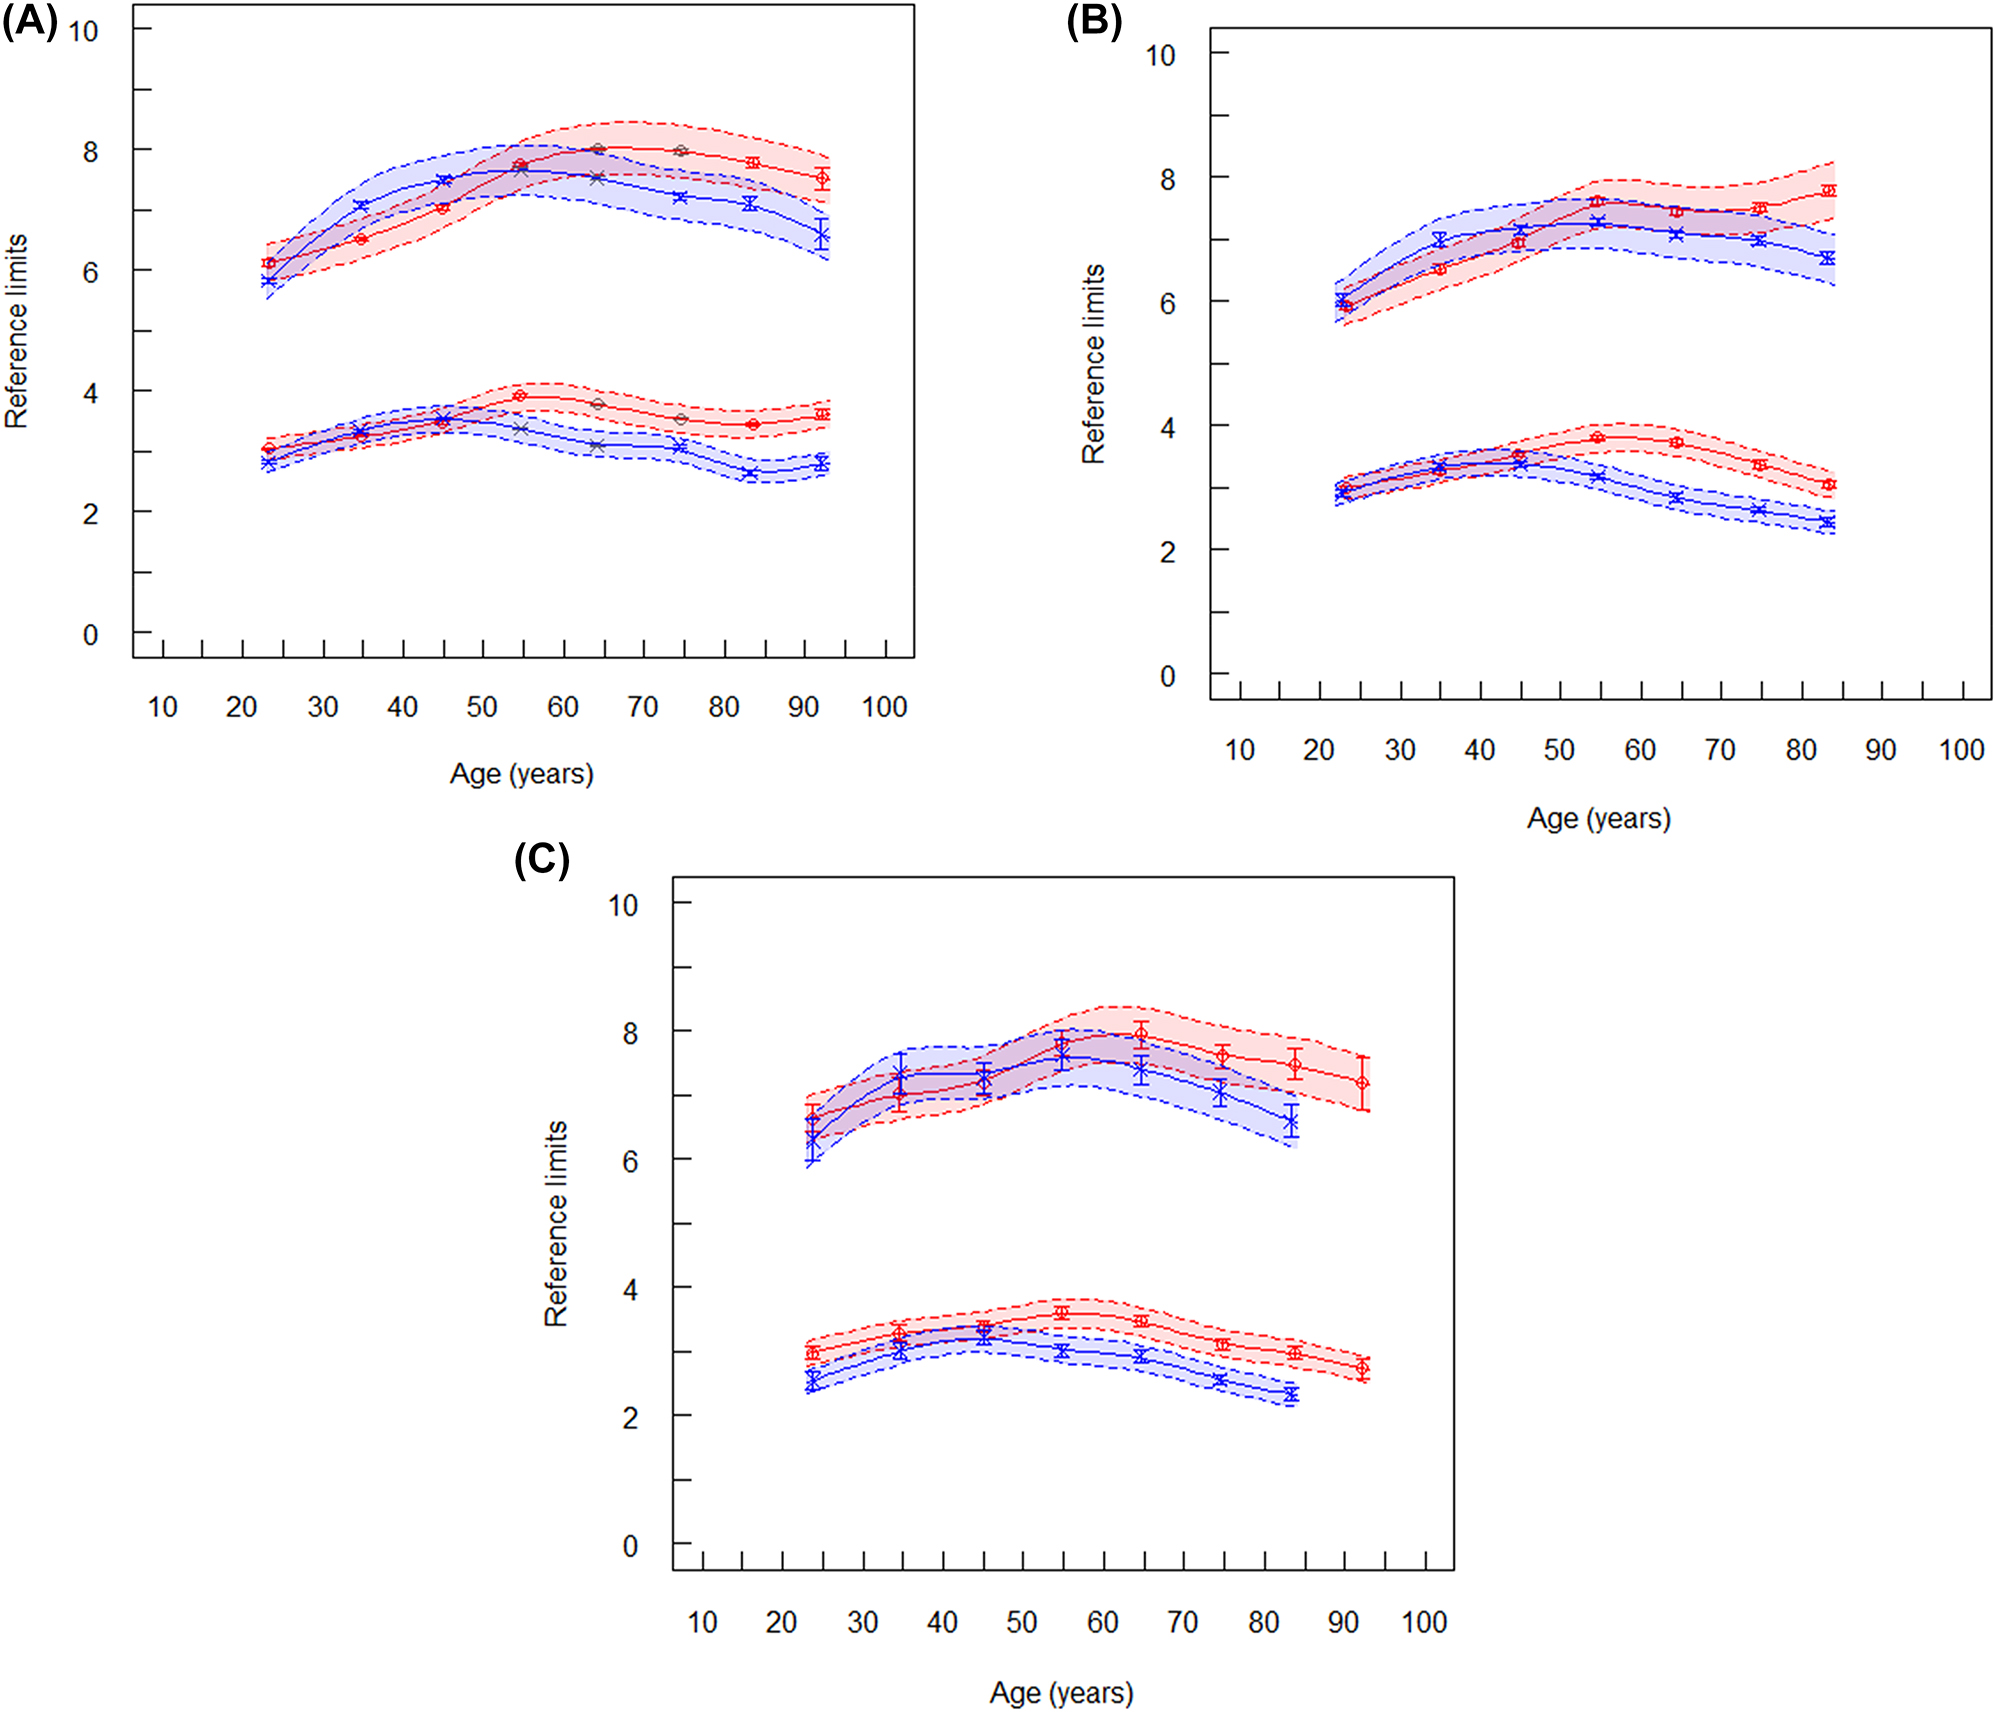
Reference limits of total cholesterol (mmol/L). The lower spline lines represent lower reference limits and the upper spline lines represent upper reference limits. Broken lines are lower and upper equivalence limits. Vertical lines at the mean values are confidence limits. (A) Reference limits of total cholesterol for laboratory 1 (ambulant, serum), red symbols are women (n=344,764), blue symbols are men (n=317,644). (B) Reference limits of total cholesterol for laboratory 2 (ambulant, plasma), red symbols are women (n=89,407), blue symbols are men (n=69,785). (C) Reference limits of total cholesterol (mmol/L) for laboratory 4 (hospitalized patients), red symbols are women (n=18,731), blue symbols are men (n=19,364).
The lower RLs were equivalent for men and women between 18 and 50 years. Above 50 years, the lower RLs were slightly higher in women than in men (Figure 1).
The age-dependent lines in Figure 1 (spline functions) fitted to RLs which were estimated from age intervals of 10 years. Inspecting the graphs, it was decided to choose larger age intervals if the equivalence limits overlapped between succeeding intervals or to neglect sex stratification. Intervals larger than 10 years were selected as shown in Supplementary Table 2. These intervals were slightly different from those recommended by EAS/EFLM [8]. When we applied the TMC approach to the age intervals recommended by EAS/EFLM, our RIs were about 6% lower (Table 1).
Comparison of reference intervals determined by the TMC approach and those reported by ESA/EFLM [8].
| Total cholesterol, mmol/L | |||||||
|---|---|---|---|---|---|---|---|
| Laboratory 3 (hospitalized patients) | |||||||
| TMC | EAS/EFLM | ||||||
| Years | na | Lower RL | Higher RL | Lower RL | Higher RL | ||
| Women | 20–39 | 4,714 | 3.02 | 6.89 | 3.3 | 6.9 | |
| 40–65 | 20,296 | 2.82 | 7.46 | 3.8 | 7.9 | ||
| 66–100 | 24,171 | 2.68 | 7.82 | 4.3 | 8.2 | ||
| Men | 20–39 | 4,509 | 2.67 | 6.67 | 3.3 | 7.2 | |
| 40–65 | 25,932 | 2.35 | 7.26 | 3.9 | 7.9 | ||
| 66–100 | 30,302 | 2.26 | 6.79 | 3.8 | 7.6 | ||
| LDL cholesterol, mmol/L | |||||||
| Women | 20–39 | 5,110 | 1.38 | 4.86 | 1.4 | 4.4 | |
| 40–65 | 23,548 | 1.32 | 5.47 | 1.7 | 5.3 | ||
| 66–100 | 34,491 | 1.14 | 5.50 | 1.9 | 5.5 | ||
| Men | 20–39 | 4,894 | 1.22 | 4.74 | 1.5 | 5.0 | |
| 40–65 | 31,293 | 0.96 | 5.22 | 1.8 | 5.4 | ||
| 66–100 | 40,518 | 0.97 | 4.91 | 1.8 | 5.0 | ||
| HDL cholesterol, mmol/L | |||||||
| Women | 18–100 | 47,998 | 0.72 | 2.59 | |||
| 20–39 | 3,651 | 0.75 | 2.67 | 0.91 | 2.5 | ||
| 40–65 | 19,535 | 0.77 | 2.65 | 0.93 | 2.8 | ||
| 66–100 | 24,578 | 0.74 | 2.68 | 0.98 | 3.0 | ||
| Men | 18–100 | 60,856 | 0.64 | 1.84 | |||
| 20–39 | 3,782 | 0.62 | 2.04 | 0.67 | 2.0 | ||
| 40–65 | 26,212 | 0.63 | 1.88 | 0.72 | 2.4 | ||
| 66–100 | 30,722 | 0.65 | 2.01 | 0.76 | 2.6 | ||
|
|
|||||||
| Laboratory 4 (hospitalised patients) | |||||||
|
|
|||||||
| Non-HDL cholesterol, mmol/L | |||||||
| Women | 20–39 | 2,054 | 1.82 | 6.14 | 1.7 | 5.3 | |
| 40–65 | 5,611 | 1.77 | 6.55 | 2.1 | 6.3 | ||
| 66–100 | 8,262 | 1.66 | 6.25 | 2.4 | 6.5 | ||
| Men | 20–39 | 1,824 | 1.83 | 6.65 | 2.0 | 6.2 | |
| 40–65 | 6,737 | 1.60 | 6.97 | 2.4 | 6.6 | ||
| 66–100 | 7,540 | 1.45 | 6.31 | 2.3 | 6.1 | ||
-
aNumber of data.
LDL cholesterol
The RIs of LDLC also agreed across all laboratories and between the two algorithms applied. The pattern of age dependency was similar to that observed for TC (Figure 2). Although, the RIs were similar in all laboratories (Supplementary Table 2) with the RIs in laboratory 1 representing approximately the median between all laboratories: the uRL (16–24 years) for both sexes was 4.14 mmol/L (160 mg/dL), and the uRL (25–80) was 5.16 mmol/L (200 mg/dL).
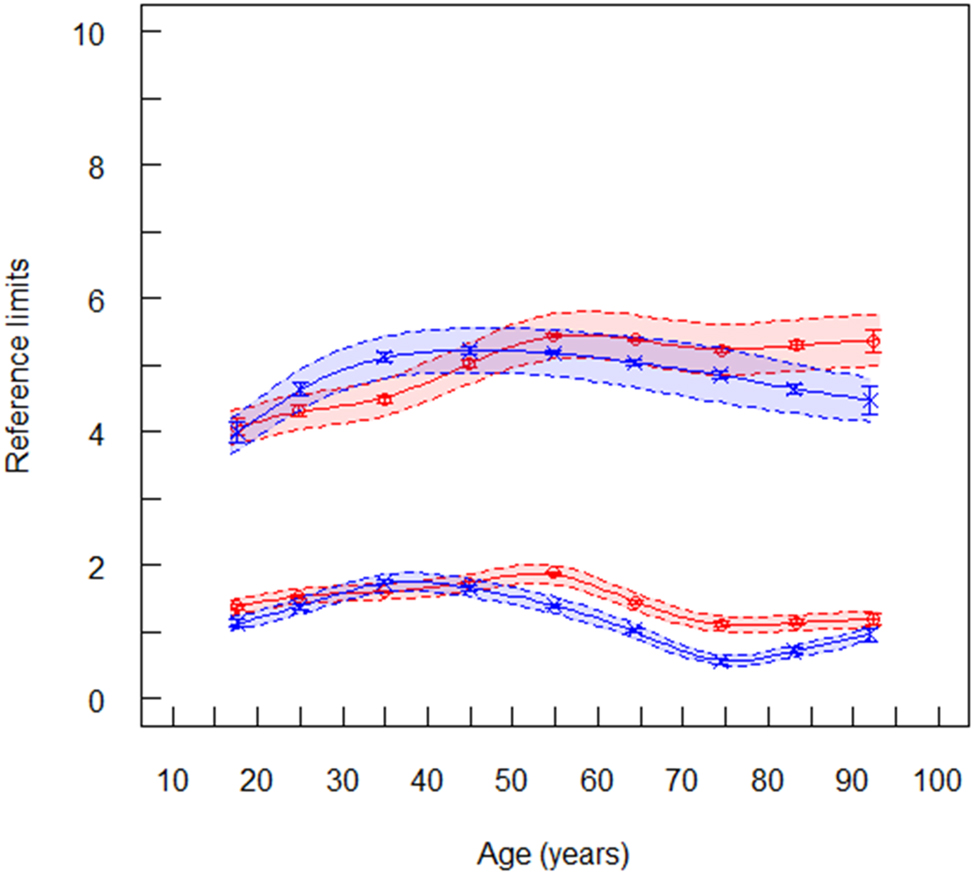
Reference limits of LDL cholesterol (mmol/L) for laboratory 1 (ambulant, serum), red symbols are women (n=170,173), blue symbols are men (n=159,296). The lower spline line represents lower reference limits and the upper spline line represents upper reference limits. Broken lines are lower and upper equivalence limits. Vertical lines at the mean values are confidence limits.
HDL cholesterol
The RLs of HDLC also agreed between all laboratories and between the two algorithms. The uRLs were higher in women than in men (Supplementary Table 3) as also reported by Rustad et al. [18]. An age dependency was not observed (Figure 3). The mean values may be chosen as common RI for laboratory 1–4: 0.62–1.98 mmol/L (24–77 mg/dL) in men and 0.80–2.61 mmol/L (31–101 mg/dL) in women. Rustad et al. [18] reported slightly higher values: 0.83–2.13 in men and 1.03–2.61 mmol/L in women.
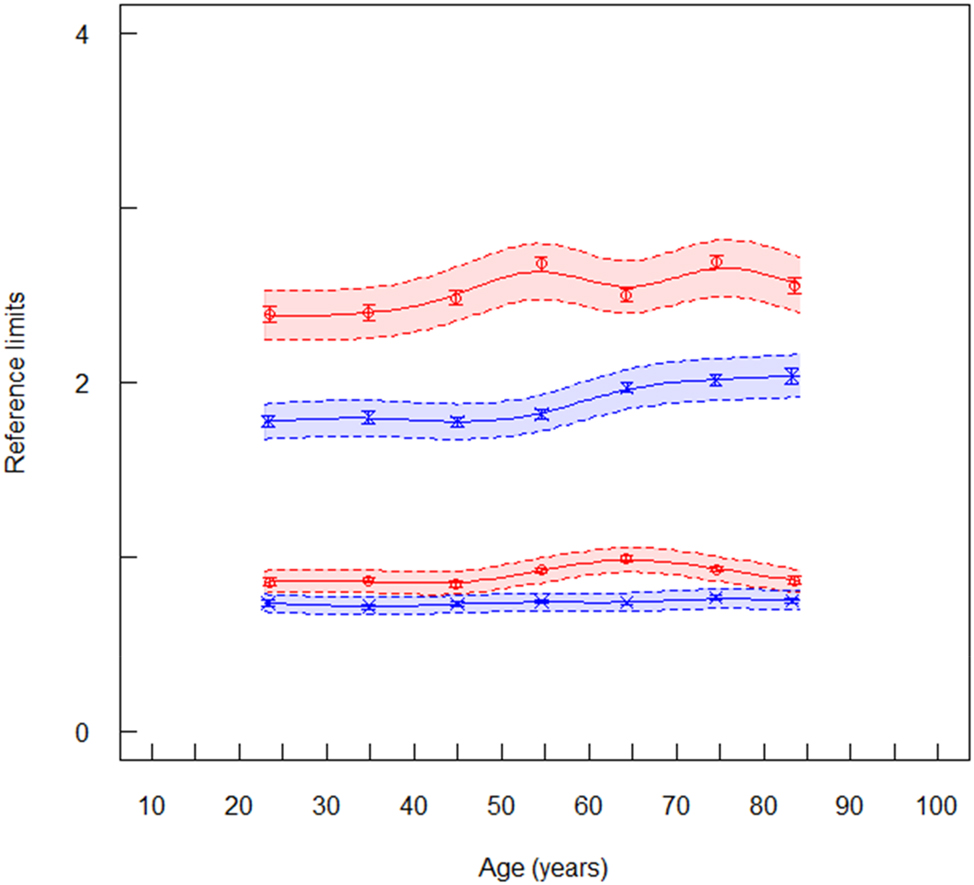
Reference limits of HDL cholesterol (mmol/L) for laboratory 1 (ambulant, serum), red symbols are women (n=150,732), blue symbols are men (n=140,715). The lower spline line represents lower reference limits and the upper spline line represents upper reference limits. Broken lines are lower and upper equivalence limits. Vertical lines at the mean values are confidence limits.
Non-HDL cholesterol
Jointly measured TC and HDLC values from the same patient were only available for the data set from laboratory 4 (Supplementary Table 4). Thus, the RLs of non-HDLC could only be determined with the data provided by laboratory 4. The age dependent trend of RLs were similar as those of TC and LDLC (Figure 4). In women, the uRLs were constant up to an age of about 50 years, and then increased continuously. In men, the uRLs decreased after the age of 80 years. The same behavior was reported in the EAS/EFLM study [8, 19].
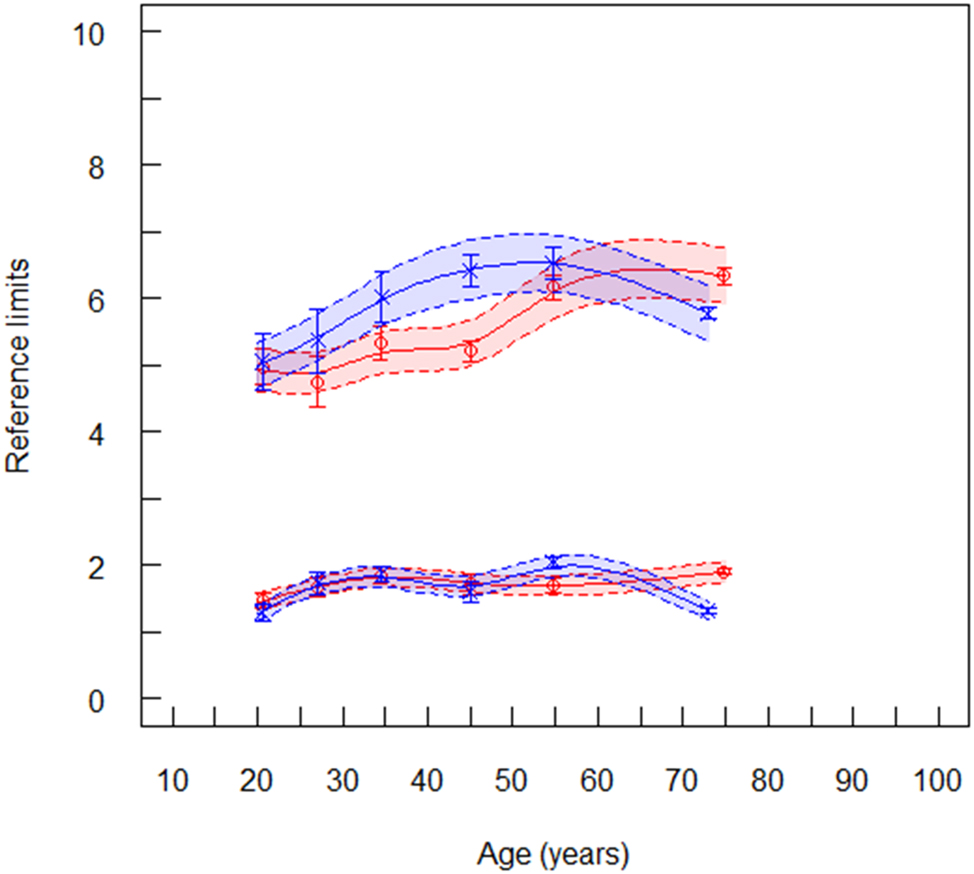
Reference limits of non-HDL cholesterol (mmol/L) for laboratory 4, red symbols are women (n=15,815), blue symbols are men (n=16,189). The lower spline line represents lower reference limits and the upper spline line represents upper reference limits. Broken lines are lower and upper equivalence limits. Vertical lines at the mean values are confidence limits.
In summary, both indirect approaches led to very similar RLs for all cholesterol fractions. The differences between the 2 algorithms were within the equivalence limits (Supplementary Table 2). In the EAS/EFLM study [19] different age intervals were used. We repeated the calculations of RIs for the various cholesterol fractions with these age intervals and obtained similar RIs which were only about 6% lower. This difference may be due to methodological variations. No relevant differences were observed between the results of laboratories using plasma or serum were observed (Supplementary Table 1). One limitation of the present study is that the RIs were only determined by data obtained with the same analytical system.
The influence of lipid lowering drugs on lipid reference limits
Many drugs lowering, but also increasing the concentrations of blood lipids are known [19]. Therefore, approaches for estimating RIs may be questioned in the case of cholesterol fractions. In laboratory 4, the use of lipid lowering drugs could be attributed to particular patients. About 29% of hospitalized patients were treated. Statins were the most often applied lipid lowering drugs. The RLs of LDLC was not lower in treated patients than in non-treated subjects (Supplementary Table 5). Therefore, it can be assumed that the estimated RLs found in this study were not relevantly influenced by lipid lowering medication.
Discussion
Reference limits of cholesterol concentrations were discussed controversially in the literature due to several biological variables. Many variability factors may influence the reference limits of cholesterol fractions [20] among seasonal effects [21], dietary habits, position during sample collection, geographical origin, etc. In the present study, only age-and sex-specific RIs were estimated, because these factors are always available in modern laboratory information systems. Cholesterol is bound to lipoproteins in blood, therefore, the cholesterol concentration should be lower in hospitalized patients (usually lying position) than in ambulant patients (mostly sitting position during sample collection). This effect could not be observed in the present study (see results from laboratory 3 in Supplementary Table 2). However, other conditions (e.g. by lipid lowering drugs, acute phase effects, etc.) may also explain this finding.
The present study is focused on reference limits for individuals with unknown and probably low risk for CHD. It does not intend to interfere with action limits proposed by numerous recommendations and guidelines for the treatment of patients with a significant risk for CHD.
Total cholesterol
The total cholesterol concentration in blood was questioned [1, 2] as a risk indicator for coronary heart disease (CHD). After the recent adjustment of the SCORE to SCORE 2 [22], TC will be further requested from medical laboratories to calculate non-HDLC. Age and sex dependency can be neglected in the age range from 18 to 80 years.
The slight decrease of the upper reference limit in men may be explained by a higher survival rate of those individuals with lower cholesterol levels or metabolic changes in the senescent liver. The same effect was also observed in the EAS/EFLM recommendation (Table 1) and a recent Korean study [23].
LDL cholesterol
LDLC is the major form of atherogenic cholesterol [1, 2]. Most recent recommendations favor the LDL cholesterol concentration as a risk factor for CHD [1, 2, 5]. The age and sex dependency paralleled those of total cholesterol. The mean uRL of laboratory 3 was identical to that reported in the EAS/EFLM study (Table 1).
HDL cholesterol
Strong evidence from epidemiological studies exists that there is an inverse association between plasma HDLC and the risk of subsequent CHD events. This inverse association applies to both men and women [1]. The lower RLs for HDLC are more relevant as clinical decision limits than upper RLs. The lower RLs of women were about 20% lower than the values found in the EAS/EFLM study [19] and about 30% lower than in the NORIP study [17]. In men, the corresponding lower percentage values were 13 and 23.
The age trends of the uRLs of all 3 cholesterol fractions observed in both sexes were similar as the mean concentrations recently reported in a large Korean population [23].
Non-HDL cholesterol
The concentration of non-HDLC has been found to be more efficient in reflecting the cardiovascular risk than LDLC [9, 10, 23]. Non-HDLC is considered as an estimate of total concentrations of all Apo B containing lipoproteins [24]. The low-risk goal for non-HDLC is proposed to be 0.8 mmol/L (30 mg/dL) higher than the corresponding LDLC goal [25]. In the present study, the average of the uRLs was about 4.3% higher than the uRLs reported by EAS/EFLM [8] (Table 1).
The indirect approaches for estimating RIs assume that the data follow a power normal distribution. Theoretically, this assumption is not fulfilled for the difference of two power normal distributions with shape parameter lambdas different from 1 as in the case of non-HDLC. However, the application of the present methods led to plausible RIs with trends similar as TC. Numerical comparison showed that in the present data the distribution of the difference TC – HDLC is very near to a power-normal distribution.
Comparison of the TMC and refineR methods
Recently, the TMC and refineR methods have shown to achieve more accurate results for simulated data than other indirect methods [26], and now showed to achieve highly similar results for real-world data.
Conclusions
RIs should be determined locally or regionally and should not be used globally. We recommend the use of continuous age-dependent graphs of RIs as shown in Figures 1–3. Then, the graphs should be inspected to decide if greater age intervals are possible or whether age-and/or sex-specific RIs are not required. In those cases where RLs should be stratified for age and/or sex, the corresponding RLs improve the diagnostic efficiency.
-
Research funding: None declared.
-
Author contributions: All authors have accepted responsibility for the entire content of this manuscript and approved its submission.
-
Competing interests: Authors state no conflict of interest.
-
Informed consent: Informed consent was obtained from all individuals included in this study.
-
Ethical approval: Not applicable.
References
1. Pyörälä, K, de Backer, S, Graham, I, Poole-Wilson, P, Wood, D. Prevention of coronary of heart disease in clinical practices. Recommendations of the task force of the European Society of Cardiology, European Atherosclerosis Society and European Society of Hypertension. Eur Heart J 1994;15:1300–31. https://doi.org/10.1093/oxfordjournals.eurheartj.a060388.Suche in Google Scholar PubMed
2. Grundy, SM, Stone, NJ. 2018 Guideline on the management of blood cholesterol. Circulation 2019;139:e1082–143. https://doi.org/10.1161/CIR.0000000000000625.Suche in Google Scholar PubMed PubMed Central
3. Richtlinie der Bundesärztekammer zur Qualitätssicherung laboratoriumsmedizinischer Untersuchungen (RiliBÄK). Dtsch Aerzteblatt 2019;116:A2397–430. https://doi.org/10.328/arzteblatt2019.Suche in Google Scholar
4. Haeckel, R, Wosniok, W, Arzideh, F. Proposed classification of various limit values (guide values) used in assisting the interpretation of quantitative laboratory test results. Clin Chem Lab Med 2009;47:494–74. https://doi.org/10.1515/CCLM.2009.043.Suche in Google Scholar PubMed
5. Simons, LA. Interrelation of lipids and lipoproteins with coronary artery disease mortality in 19 countries. Am J Cardiol 1986;57:5G–10G. https://doi.org/10.1016/0002-9149(86)90659-4.Suche in Google Scholar PubMed
6. Cleeman, JI. Executive summary of the third report of the national cholesterol education program (NCEP) of the expert panel on detection, evaluation and treatment of high blood cholesterol in adults (adult treatment panel III). J Am Med Assoc 2001;285:2486–97.10.1001/jama.285.19.2486Suche in Google Scholar PubMed
7. Langlois, MR, Nordestgaard, BG, Langsted, A, Chapman, MJ, Aakre, KM, Baum, H, et al.. Quantifying atherogenic lipoproteins for lipid-lowering strategies: consensus-based recommendations from EAS and EFLM. Clin Chem Lab Med 2020;58:496–517. https://doi.org/10.1515/cclm-2019-1253.Suche in Google Scholar PubMed
8. Visseren, FLJ, Mach, F, Smulders, YM, Carballo, YM, Koshinas, KC, Bäck, R, et al.. 2021 ESC guidelines on cardiovascular disease prevention clinical practice. Eur Heart J 2021;42:3227–337. https://doi.org/10.1093/eurheartj/ehab484.Suche in Google Scholar PubMed
9. Haeckel, R, Adeli, K, Graham, J, Sikaris, K, Wosniok, W. Definitions and major prerequisites of direct and indirect approaches for estimating reference limits. Clin Chem Lab Med 2023;61:402–6. https://doi.org/10.1515/cclm-2022-1061.Suche in Google Scholar PubMed
10. Ridefelt, P, Hagström, E, Svensson, MK, Äkerfeldt, T, Larsson, A. Age-and sex-specific reference values for non-HDL cholesterol and remnant cholesterol derived from the Nordic Reference Interval Report (NORIP). Scand J Clin Lab Invest 2019;79:39–42. https://doi.org/10.1080/00365513.2018.1550809.Suche in Google Scholar PubMed
11. Alain, CC, Poon, LS, Chen, CS. Enzymatic determination of total serum cholesterol. Clin Chem 1974;2004:470–5.10.1093/clinchem/20.4.470Suche in Google Scholar
12. Lu, W, Resnik, HE, Jablonski, KA, Jones, KL, Jain, AK, Howard, WJ, et al.. Non-HDL cholesterol as a predictor of cardiovascular disease in type 2 diabetes: the strong heart study. Diabetes Care 2003;26:16–23. https://doi.org/10.2337/diacare.26.1.16.Suche in Google Scholar PubMed
13. Brunner, F, Waldeyer, C, Ojeda, F, Salomaa, V, Klee, F, Sans, G, et al.. Application of Non-HDL cholesterol for population-based cardiovascular risk stratification: results from the multinational cardiovascular risk consortium. Lancet 2019;394:2173–83. https://doi.org/10.1016/s0140-6736(19)32519-x.Suche in Google Scholar PubMed PubMed Central
14. Wosniok, W, Haeckel, R. A new indirect estimation of reference intervals: truncated minimum chi-square (TMC) approach. Clin Chem Lab Med 2019;57:1933–47. https://doi.org/10.1515/cclm-2018-1341.Suche in Google Scholar PubMed
15. Haeckel, R, Wosniok, W, Arzideh, F. Equivalence limits of reference limits for partitioning of population data. Relevant differences of reference intervals. J Lab Med 2016;40:199–205. https://doi.org/10.1515/labmed-2016-0002.Suche in Google Scholar
16. German Society of Clinical Chemistry and Laboratory Medicine. Decision limits/guideline values; 2022. Available from: https://www.dgkl.de/verbandsarbeit/sektionen/entscheidungsgrenzen-richtwerte/ [Accessed 19 May 2022].Suche in Google Scholar
17. Arzideh, F, Wosniok, W, Gurr, E, Hinsch, W, Schumann, G, Weinstock, N, et al.. A plea for intra-laboratory reference limits. Part 2. A bimodal retrospective concept for determining reference intervals from intra-laboratory data bases demonstrated by catalytic activity concentrations of enzymes. Clin Chem Lab Med 2007;45:1043–57. https://doi.org/10.1515/CCLM.2007.250.Suche in Google Scholar PubMed
18. Rustad, P, Felding, P, Franzson, L, Kairisto, V, Lahti, A, Martensson, A, et al.. The NORDIC reference project 2000: recommended reference intervals for 25 common biochemical properties. Scand J Clin Lab Invest 2004;64:271–84. https://doi.org/10.1080/00365510410006324.Suche in Google Scholar PubMed
19. Mach, F, Baigent, C, Catapano, AL, Koskinas, KC, Casula, M, Badimon, L, et al.. 2019 ESC/EAS guidelines for the management of dyslipidaemias: lipid modification to reduce vascular risk. Eur Heart J 2020;41:111–88. https://doi.org/10.1093/eurheartj/ehz455.Suche in Google Scholar PubMed
20. Özcürümez, MK, Haeckel, R. Biological variables influencing the estimation of reference limits. Scand J Clin Invest Lab Med 2018;78:337–45.10.1080/00365513.2018.1471617Suche in Google Scholar PubMed
21. Vedel-Krogh, S, Kobylecki, CJ, Nordestgaard, BG, Langsted, A. The Christmas holidays are immediately followed by a period of hypercholesterolemia. Atherosclerosis 2019;281:121–7. https://doi.org/10.1016/j.atherosclerosis.2018.12.011.Suche in Google Scholar PubMed
22. SCORE2 working group and ESC Cardiovascular risk collaboration. SCORE2 risk prediction algorithms: new models to estimate 10-year risk of cardiovascular disease in Europe. Eur Heart J 2021;42:2439-54.https://doi.org/10.1093/eurheartj/ehab309Suche in Google Scholar PubMed PubMed Central
23. Rhee, EJ, Kim, HC, Kim, JH, Lee, EY, Kim, BJ, Kim, EM, et al.. 2018 Guidelines for the management of dyslipidemia in Korea. J Lipd Atheroscler 2019;8:78–131.10.12997/jla.2019.8.2.78Suche in Google Scholar PubMed PubMed Central
24. Johannesen, CDL, Mortensen, MB, Langsted, A, Nordestgaard, BG. Apolipoprotein B and Non-HDL cholesterol better reflect residual risk than LDL cholesterol in statin-treated patients. J Am Coll Cardiol 2021;77:1439–50. https://doi.org/10.1016/j.jacc.2021.01.027.Suche in Google Scholar PubMed
25. Pencina, KM, Thanassoulis, G, Wilkins, JT, Vasan, RS, Novar, AM, Petersen, ED, et al.. Trajectories of Non-HADLC across midlife: implications of cardiovascular prevention. J Am Coll Cardiol 2019;74:70–9. https://doi.org/10.1016/j.jacc.2019.04.047.Suche in Google Scholar PubMed PubMed Central
26. Ammer, T, Schützenmeier, A, Prokosch, HU, Zierk, J, Rank, CM, RIbench, RM. A proposed benchmark for the standardized evaluation of indirect methods for reference interval estimation. Clin Chem 2022;68:1410–24. https://doi.org/10.1095/clinchem/hvac142.Suche in Google Scholar
Supplementary Material
This article contains supplementary material (https://doi.org/10.1515/labmed-2022-0147).
© 2023 the author(s), published by De Gruyter, Berlin/Boston
This work is licensed under the Creative Commons Attribution 4.0 International License.
Artikel in diesem Heft
- Frontmatter
- Original Articles
- Age-and sex-specific reference intervals of total cholesterol, LDL cholesterol, HDL cholesterol and non-HDL cholesterol. Comparison of two algorithms for the indirect estimation of reference intervals
- Increased hemolysis rate in plasma tubes after implementation of a fully automated sample delivery and acceptance system
- Keep cool! Observed temperature variations at different process stages of the biobanking workflow – examples from the Leipzig medical biobank
- Laboratory Case Report
- A case report of pseudoleukopenia: playing hide-and-seek
- Congress Report
- Congress report: 5th Munich POCT Symposium, September 27–29, 2022, Klinikum rechts der Isar der TU München