Keep cool! Observed temperature variations at different process stages of the biobanking workflow – examples from the Leipzig medical biobank
-
Juliane Weikert
 ,
Angelina Mehrländer
,
Angelina Mehrländer

Abstract
Objectives
Biobanked samples are becoming increasingly important for research outcomes. Most of the biobanking processes (from preparation to storage) are affected by temperature in a time-dependent manner and have a high impact on sample quality. We aimed to validate time and temperature sensitive processes such as sample preparation, transport, sorting, and storage, which have a high impact on sample quality.
Methods
Temperature was measured using internal or external temperature data loggers. We analysed the temperature and present real data from our sample transport on dry ice and with the CryoPod, from our ultra-low temperature freezers (UTFs) of different manufacturers and cryostores. We also tested sample sorting on dry ice and in a cryogenic workbench.
Results
In the UTFs, we identified temperature zones with a temperature difference from 4.7 °C up to 20.8 °C across the whole UTF. For sample transport within approximately 30 min we observed temperatures of −80.2 °C ± 4.0 °C and −173.9 °C ± 16.9 °C for dry ice boxes and the CryoPod, respectively. Sorting on dry ice was best in a polystyrene box half-filled with dry ice pellets, although the temperature increased by 7.5 °C within the first 5 min, whereas the temperature in the cryogenic workbench remained stable below −100 °C for hours.
Conclusions
Time and temperature play a crucial role in the entire biobanking process, with sometimes immense temperature fluctuations in some equipment. We recommend the validation or verification of all equipment and processes used to avoid pre-analytical errors in accordance with DIN EN ISO 20387.
Introduction
Biobanks have grown in importance over the last decade, but most quality-related errors occur in the pre-analytical phase of the overall testing process [1], [2], [3], where biobanks are typically involved. There is growing evidence that research outcomes are dramatically affected by the quality of these samples, as poor sample quality can lead to non-reproducible results [4, 5]. Numerous factors have been identified that affect the biomarker quality, ranging from endogenous factors [6, 7], to sampling errors [8], or sample processing [4].
In biobanks, time and temperature of storage processes can affect metabolites in samples [9], [10], [11], [12], including freezing [13], door opening of ultra-low temperature freezers (UTFs) [14, 15], or storage temperatures [12, 16]. For many biological samples, the recommended storage temperature is −80 °C [9]. However, some studies have reported temperature variability and temperature zones in −80 °C UTFs [14, 17].
Undesired freeze-thaw cycles are an additional source of errors and can occur during storage, sorting, and transport [2, 10, 18]. Researchers are therefore working to find quality biomarkers, such as time to freeze (TTF) [19, 20], time to centrifugation (TTC) [21], [22], [23], or freeze-thaw-cycles [24]. This is a good option for samples stored in biobanks where detailed information on sample processing is incomplete or lacking. However, the development, measurement, and interpretation of such quality markers are not yet fully established. Therefore, keeping all processes under control through the use of timestamps and temperature protocols is the best way to ensure the quality of samples for downstream analysis in the biobank workflow, as suggested by the DIN EN ISO 20387 [25], which defines general requirements for biobanking and biotechnology.
In this study, we investigated different techniques and devices used in processes such as sample transport, storage, and sorting and their influence on the temperature of samples stored in biobanks over time. We present our experience in cold chain management and data collected from our daily work and from specific validation experiments. This may also be helpful in setting up validation or verification protocols according to DIN EN ISO 20387.
Materials and methods
The life cycle of a sample in the Leipzig Medical Biobank is shown in Figure 1. After sampling at the collection site, liquid samples are sent to our pre-analytical laboratory for processing. They are then temporarily stored at −80 °C in UTFs and transported every two weeks to our storage site for long-term storage at −80 °C in UTFs or <−130 °C in the vapour phase of liquid nitrogen in our hermetic storage devices.
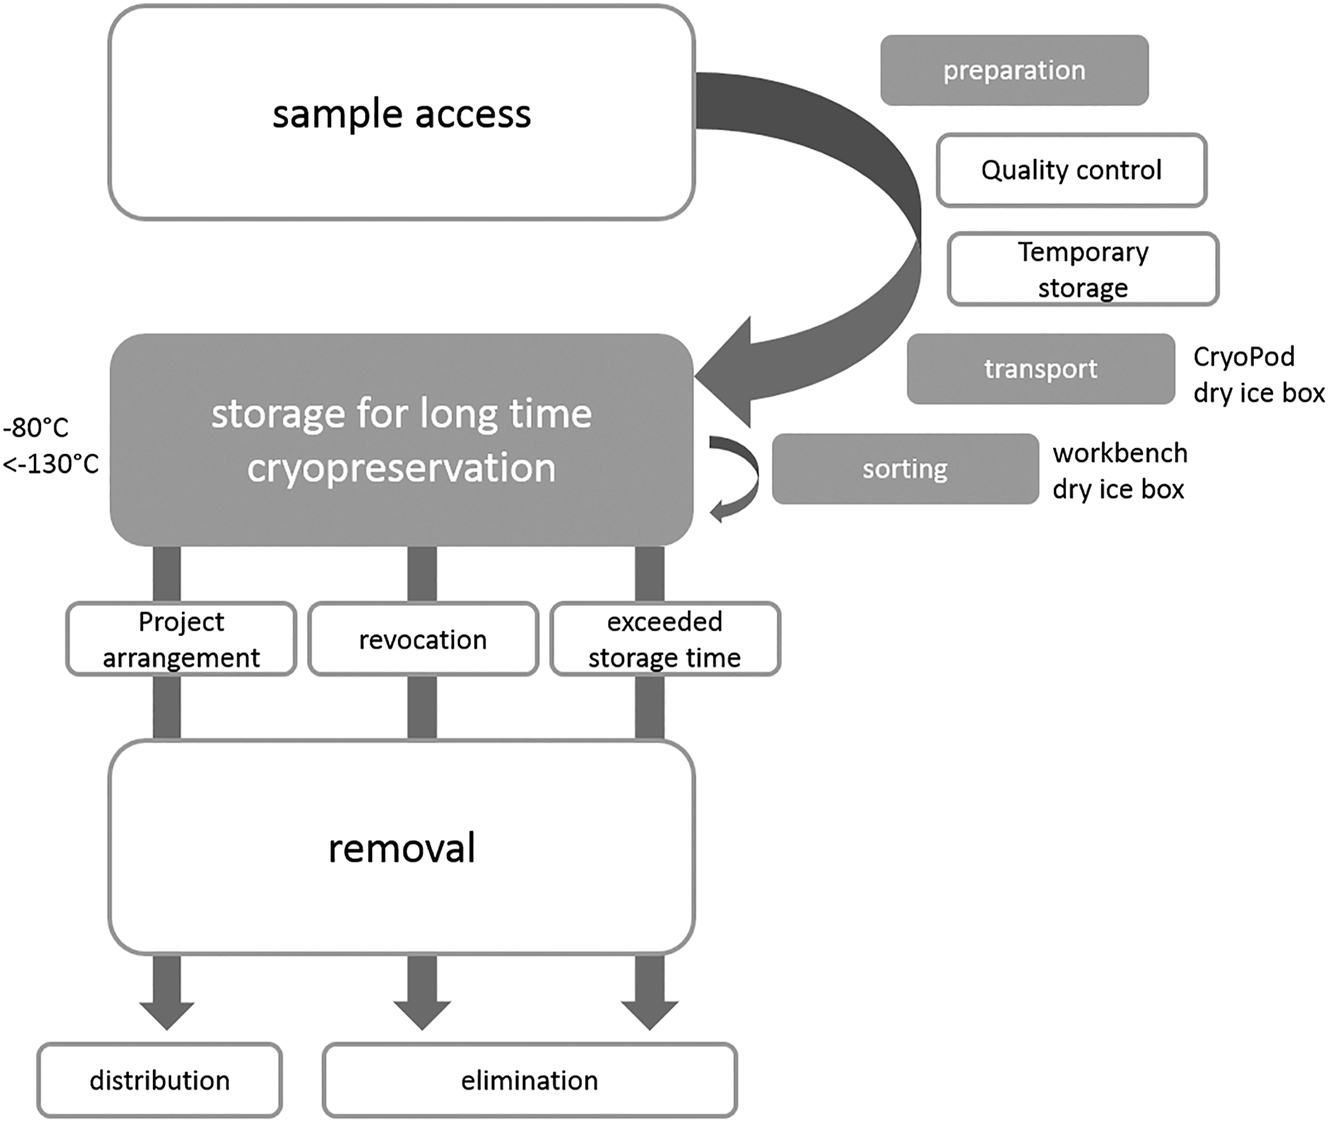
Lifecycle of a sample in the Leipzig medical biobank. The steps printed in grey have been addressed in this study.
Materials
We used portable USB temperature data loggers (TDL) testo 184 T1 (Testo SE & Co. KGaA, Lenzkirch, Germany) for temperature measurements at −80 °C in UTFs. We tested various UTF models from Thermo Scientific (HeraFreeze HFU700TV, HeraFreeze 586 Top, HeraFreeze HFU3280HDTOP, TSX70086V – Thermo Scientific™, Waltham, Massachusetts), Ewald (V86-500. 1 – EWALD Innovationstechnik GmbH, Rodenberg, Germany), Sanyo (MDF-U74V – Fisher Scientific GmbH, Schwerte, Germany), and Panasonic (MDF_U76V_PE, KM-DU73Y1 – Panasonic Healthcare Co, Ltd., Sakata, Japan) purchased between 2010 and 2018. The UTFs contained various types of racks and boxes. The data logs of our C-line® hermetic storage devices (HS) HS200 and HS102 (Askion GmbH, Gera, Germany) were also analysed. We also tested the CryoPod™ carrier (Brooks, Chelmsford, MA, USA) and polystyrene boxes with dry ice for sample transport and the cryogenic workbench WB200 (Askion GmbH, Gera, Germany) for sample sorting.
Methods
Transport
We evaluated 35 sample shipments from our sample preparation site to our sample storage building. Firstly, samples were transported using dry ice in an insulated box with a TDL pre-cooled in a UTF comparable to the samples. Therefore, we also validated the efficiency of our 19 TDLs, which are regularly calibrated against an external thermometer with a valid calibration certificate, by storing them together at −80 °C (n=6 time points). Secondly, a CryoPod was used, which automatically records transport time and temperature. We also validated our three CryoPods by filling them with liquid nitrogen and measuring the temperature for up to 5 h with the lid closed (n=3), with open lid (n=3), and with the lid closed with three lid openings for 10 s with a 1 min break in between (repeated after 10 and 20 min) to simulate frequent sample access.
Storage
In our biobank, samples (e.g. plasma, serum, urine, tissue, PBMCs, MNCs, DNA, RNA) are stored either at −80 °C in Thermo Scientific UTFs or at temperatures <−130 °C in Askion HS devices.
Internal data logs of 14 comparable UTFs from the same manufacturer used in the LMB for 2019 were analysed for periods with temperatures >−70 °C, maximum temperatures, and exact door opening times. The internal temperature sensor of the UTF is located in the lower back wall. All UTFs were filled to 90–100% with different storage vials and different samples.
We also measured the temperature stability of our UTFs and three other UTF models from Ewald, Sanyo, and Panasonic. TDLs were placed in different positions (front, centre, or back) in each compartment, rack, and drawer of the UTFs for 48 h (see Figure 2). The doors of the UTFs were kept closed during data collection.
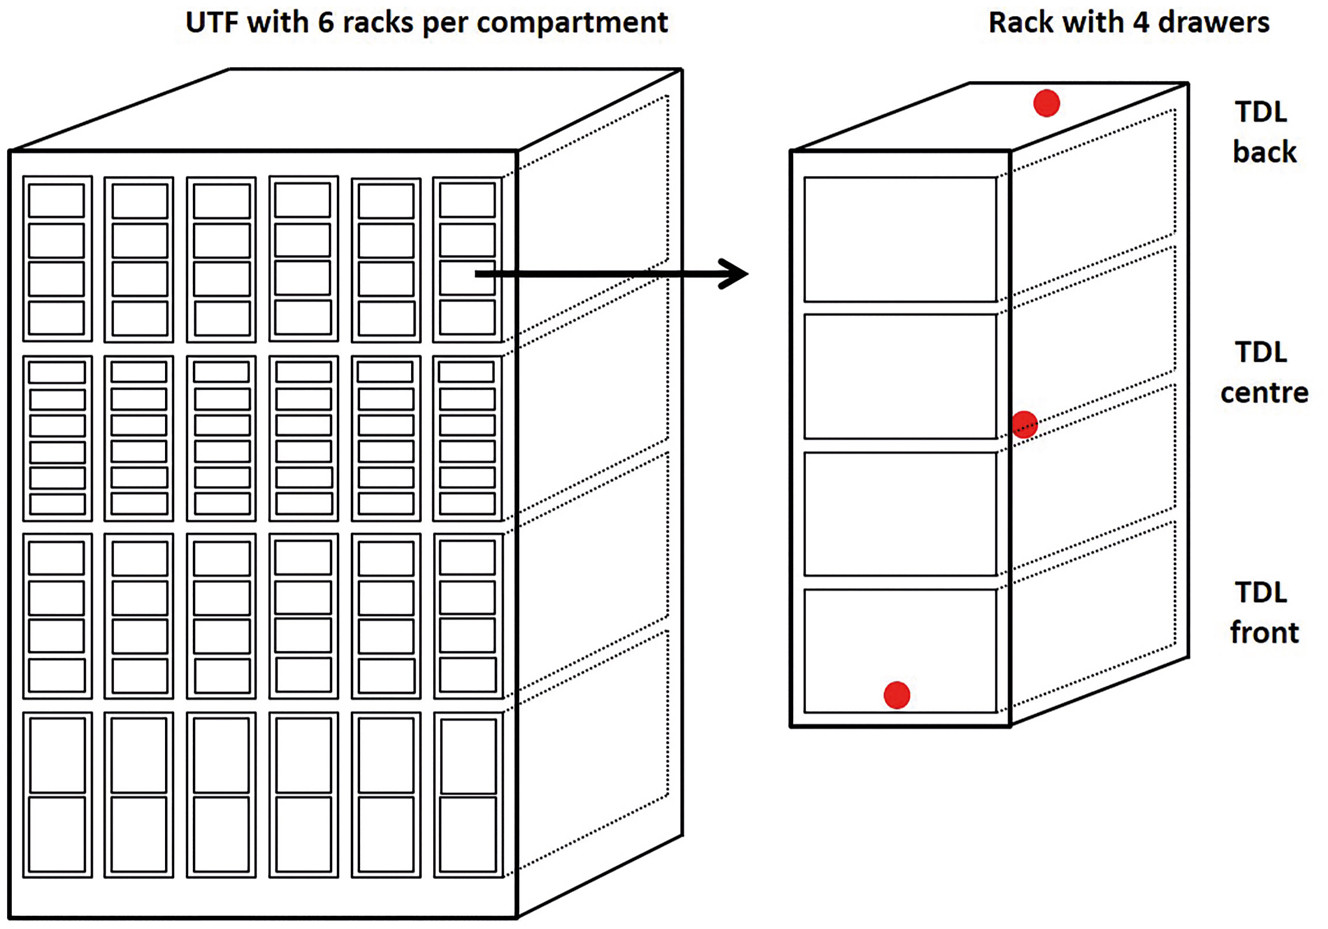
Scheme of an UTF with four compartments, six racks per compartment and two, four, or six drawers per rack. The position of TDL for the temperature measurement is exemplarily shown for one rack. TDLs (red dot) were placed either in the lower front of the rack, in the centre, or at the top in the back.
We investigated the temperature stability and variation per UTF using the TDLs and aimed to identify temperature zones. The temperature measurement was repeated several weeks after the initial measurement for each UTF.
We also checked the effects of defrosting, cleaning filters, and repairing broken insulations by comparing data from UTF’s internal data loggers collected one month before and after each event.
Temperature variation at −60 °C and −70 °C was also investigated. To do this, the temperature of an empty Thermo Scientific backup UTF was set to −70 or −60 °C and the TDLs were placed at the front, centre, and back for 2 × 8 h with a 15 min measurement interval.
Finally, the internal data log of 9 HS devices was analysed over 48 h.
Sorting
Samples are regularly sorted either in our cryogenic workbench, in the handling room of our HS devices, or in a polystyrene box containing dry ice. We compared the temperature in a polystyrene box (37.5 cm long × 22 cm wide × 16 cm high, 2.8 cm thick) half-full or full of dry ice plates, pellets, or old dry ice pellets. Three pre-cooled TDLs (−80 °C) were placed on top of the dry ice for 120 min. The box was kept open throughout to simulate sorting of the samples (n=3 replicates for each condition). To test whether the thickness of the box walls had an effect, we also tested another box with a comparable footprint but thicker walls (32 cm long × 26 cm wide × 16.5 cm high, 4 cm thick).
Statistic
Unless otherwise stated, mean, median, and standard deviation or percentage deviation were calculated using Excel 2013 (Microsoft Corporation, Redmond, WA, USA). Pearson correlation analysis was performed using GraphPad Prism version 9.2.0.
Results
Transportation
The mean variation of the temperature measurement of 19 TDLs at six time points was 0.6% (0.3–1.1%), corresponding to 0.3–0.9 °C. The CryoPods had temperatures <−170 °C for 4.2 h with the lid closed and about 1 h with the lid open. After repeatedly opening the lid, the temperature initially rises, but then quickly falls, depending on the filling level of the CryoPod (see Supplementary Figure 1). The temperature variation of a fully filled CryoPod was less than that of a CryoPod with a low fill level after 150 min (data not shown).
Samples were transported either in a dry ice box and a TDL or using the CryoPod. The mean transport time was 22 ± 16 min and 25 ± 42 min (n=35 each) for dry ice box and CryoPod transport, respectively. The mean temperatures were −80.2 °C ± 4.0 °C (maximum −72.0 °C, minimum −85.5 °C) for dry ice and −173.9 °C ± 16.9 °C (maximum −133.0 °C, minimum −196.0 °C) for CryoPods.
Storage
The analysis of the internal log files of 14 UTFs is summarised in Table 1. There were UTFs with up to 4056 door openings per year resulting in temperatures >−70 °C for max. 589 min, although door openings lasted max. 4 min and 33 s. This also resulted in the highest temperatures of up to −43.3 °C. We also analysed whether there was a correlation between the total number of door openings and the total duration of temperatures above −70 °C and found a correlation of r=0.7594 (p=0.0016).
Mean values with minimum and maximum are given for 14 UTFs from Thermo Fisher Scientific for one year and were calculated from the internal data logs. Further, results for each UTF are given (UTF-01-14). Defrosting, repair, or evacuation events were excluded from the analysis.
| Mean value (min – max) | UTF-01 | UTF-02 | UTF-03 | UTF-04 | UTF-05 | UTF-06 | UTF-07 | UTF-08 | UTF-09 | UTF-10 | UTF-11 | UTF-12 | UTF-13 | UTF-14 | |
|---|---|---|---|---|---|---|---|---|---|---|---|---|---|---|---|
| Year of production | 2015 (2012–2018) | 2012 | 2013 | 2013 | 2013 | 2014 | 2014 | 2014 | 2015 | 2016 | 2016 | 2017 | 2017 | 2018 | 2018 |
| Mean temperature, °C | −78.7 (−69.2 to −80.2) | −69.2 | −79.2 | −79.0 | −79.7 | −78.5 | −79.2 | −78.5 | −79.3 | −79.7 | −79.6 | −79.9 | −79.8 | −80.2 | −80.2 |
| Highest temperature, °C | −62.3 (−43.3 to −74.8) | −59.1 | −64.3 | −63.6 | −69.6 | −59.1 | −61.6 | −73.9 | −52.8 | −67.4 | −43.3 | −74.8 | −66.1 | −61.6 | −59.0 |
| Longest temperature duration at >−70 °C, min | 173 (0–589) | 588 | 39 | 16 | 5 | 445 | 78 | 0 | 477 | 98 | 589 | 0 | 11 | 37 | 42 |
| Total temperature duration >−70 °C, min | 517 (0–2,113) | 2,113 | 65 | 16 | 5 | 1,659 | 78 | 0 | 2,043 | 116 | 1,000 | 0 | 11 | 84 | 42 |
| Door openings | 723 (13–4,056) | 1,383 | 228 | 280 | 183 | 693 | 369 | 13 | 4,056 | 217 | 1,184 | 236 | 863 | 286 | 125 |
| Longest door opening, hh:mm:ss | 00:03:24 (00:02:15–00:04:33) | 00:03:52 | 00:03:24 | 00:03:12 | 00:03:56 | 00:03:30 | 00:04:15 | 00:02:15 | 00:04:11 | 00:02:57 | 00:04:33 | 00:02:58 | 00:02:31 | 00:02:59 | 00:03:00 |
| Total duration of door openings, hh:mm:ss | 05:09:20 (00:12:53–22:42:40) | 05:17:26 | 02:56:57 | 03:14:52 | 02:45:31 | 06:10:54 | 02:37:12 | 00:12:53 | 22:42:40 | 02:16:17 | 08:33:13 | 02:18:30 | 08:07:25 | 03:44:48 | 01:12:02 |
| Yearly mean duration of door openings, hh:mm:ss | 00:00:42 (00:00:14–00:01:14) | 00:00:14 | 00:01:00 | 00:00:52 | 00:01:14 | 00:00:27 | 00:00:31 | 00:01:01 | 00:00:20 | 00:00:44 | 00:00:37 | 00:00:43 | 00:00:42 | 00:00:48 | 00:00:28 |
-
UTF, ultra low temperature freezer.
We also compared the temperature stability of UTFs from four different manufacturers over 48 h. The temperature for Ewald, Panasonic, Sanyo, and Thermo Scientific is given as mean °C (maximum – minimum) and was −78.5 °C (n=2, −62.3 °C to −85.1 °C), −78.9 °C (n=2, −74.1 °C to − 82.3 °C), −78.1 °C (n=3, −65.8 °C to −84.3 °C) and −78.5 °C (n=4, −66.8 °C to −83.8 °C), respectively. The maximum internal temperature difference ranged from 4.7 °C (Thermo Scientific) to 20.8 °C (Ewald) in the first measurement (see Table 2 for details). The repeat measurement showed comparable values.
Comparison of the temperature stability of UTFs of different manufacturers using TDLs. The first measurement is shown in black, the second measurement several weeks later is shown in grey. The stability over 48 h is given as mean temperature with coefficient of variation.
| Manufacturer/type | UTF | production year | Stability over 48 h | Max. temperature difference, °C | |
|---|---|---|---|---|---|
| Temperature (mean ± SD, min, max °C) | CV (mean, min, max %) | ||||
| Ewald V86–500.1 | A | 2016 | −77.1 ± 2.5 (−62.3 to −83.1) | 0.4 (0.2–3.3) | 20.8 |
| Ewald V86–500.1 | B | 2017 | −79.8 ± 1.9 (−69.9 to −85.1) | 2.4 (0.0–6.8) | 15.2 |
| Ewald V86–500.1 | A replication | −77.7 ± 0.2 (−63.2 to −81.0) | 0.3 (0.2–0.6) | 17.8 | |
| Ewald V86–500.1 | B replication | −82.1 ± 0.1 (−74.0 to −85.1) | 0.1 (0.0–0.3) | 11.1 | |
|
|
|||||
| Panasonic MDF_U76V_PE | C | 2012 | −79.1 ± 0.2 (−74.1 to −82.3) | 0.2 (0.0–0.5) | 8.2 |
| Panasonic KM-DU73Y1 | D | 2014 | −78.7 ± 0.1 (−75.5 to −80.4) | 0.2 (0.1–0.3) | 4.9 |
| Panasonic MDF_U76V_PE | C replication | −79.8 ± 0.5 (−75.4 to −82.8) | 0.6 (0.1–9.4) | 7.4 | |
| Panasonic KM-DU73Y1 | D replication | −80.6 ± 0.1 (−77.2 to −82.4) | 0.2 (0.1–0.3) | 5.2 | |
|
|
|||||
| Sanyo MDF-U74V | E | 2010 | −78.7 ± 0.3 (−73.3 to −82.0) | 0.4 (0.2–1.2) | 8.7 |
| Sanyo MDF-U74V | F | 2010 | −79.6 ± 0.5 (−73.3 to −84.3) | 0.7 (0.2–2.9) | 11.0 |
| Sanyo MDF-U74V | G | 2010 | −76.1 ± 1.1 (−65.8 to −81.3) | 1.4 (0.5–2.8) | 15.5 |
| Sanyo MDF-U74V | E replication | −78.3 ± 0.3 (−72.5 to −81.9) | 0.4 (0.1–1.4) | 9.4 | |
| Sanyo MDF-U74V | F replication | −79.0 ± 1.5 (−74.0 to −82.0) | 1.9 (0.2–5.8) | 8.0 | |
| Sanyo MDF-U74V | G replication | −77.7 ± 0.8 (−72.9 to −81.3) | 1.0 (0.1–6.5) | 8.4 | |
|
|
|||||
| ThermoScientfic HFU700TV | H | 2016 | −80.0 ± 0.5 (−72.3 to −83.8) | 0.6 (0.2–1.1) | 11.5 |
| ThermoScientfic HFU700TV | I | 2013 | −77.6 ± 0.1 (−70.4 to −81.9) | 0.6 (0.1–0.6) | 11.5 |
| ThermoScientfic HFU700TV | J | 2013 | −76.0 ± 0.4 (−66.8 to −81.1) | 0.6 (0.1–1.6) | 14.3 |
| ThermoScientfic HFU700TV | K | 2018 | −80.3 ± 0.9 (−77.5 to −82.2) | 1.1 (0.0–4.3) | 4.7 |
| ThermoScientfic HFU700TV | H replication | −79.9 ± 0.4 (−72.3 to −84.2) | 0.5 (0.1–1.0) | 11.9 | |
| ThermoScientfic HFU700TV | I replication | −77.9 ± 0.7 (−70.4 to −82.5) | 0.8 (0.1–1.9) | 12.1 | |
| ThermoScientfic HFU700TV | J replication | −79.7 ± 0.4 (−75.6 to −82.0) | 0.2 (0.1–1.3) | 6.4 | |
| ThermoScientfic HFU700TV | K replication | −76.1 ± 0.4 (−67.2 to −80.3) | 0.5 (0.0–2.2) | 13.1 | |
Although all UTFs showed temperatures around the set point of −80 °C and the mean temperature was always below −76.0 °C, we aimed to identify temperature zones. Figure 3 shows, as an example, the temperature measured in each position of a UTF from each manufacturer (see also Supplementary Figure 2 for all measurements). Even in a single compartment, large temperature differences were found for Ewald, Panasonic, Sanyo, and Thermo Scientific, ranging from 0.4–8.5 °C, 0.7–2.7 °C, 0.5–5.6 °C and 0.5–3.5 °C, respectively, in the first measurement. The lowest temperatures are found around the internal temperature sensor of the UTFs.
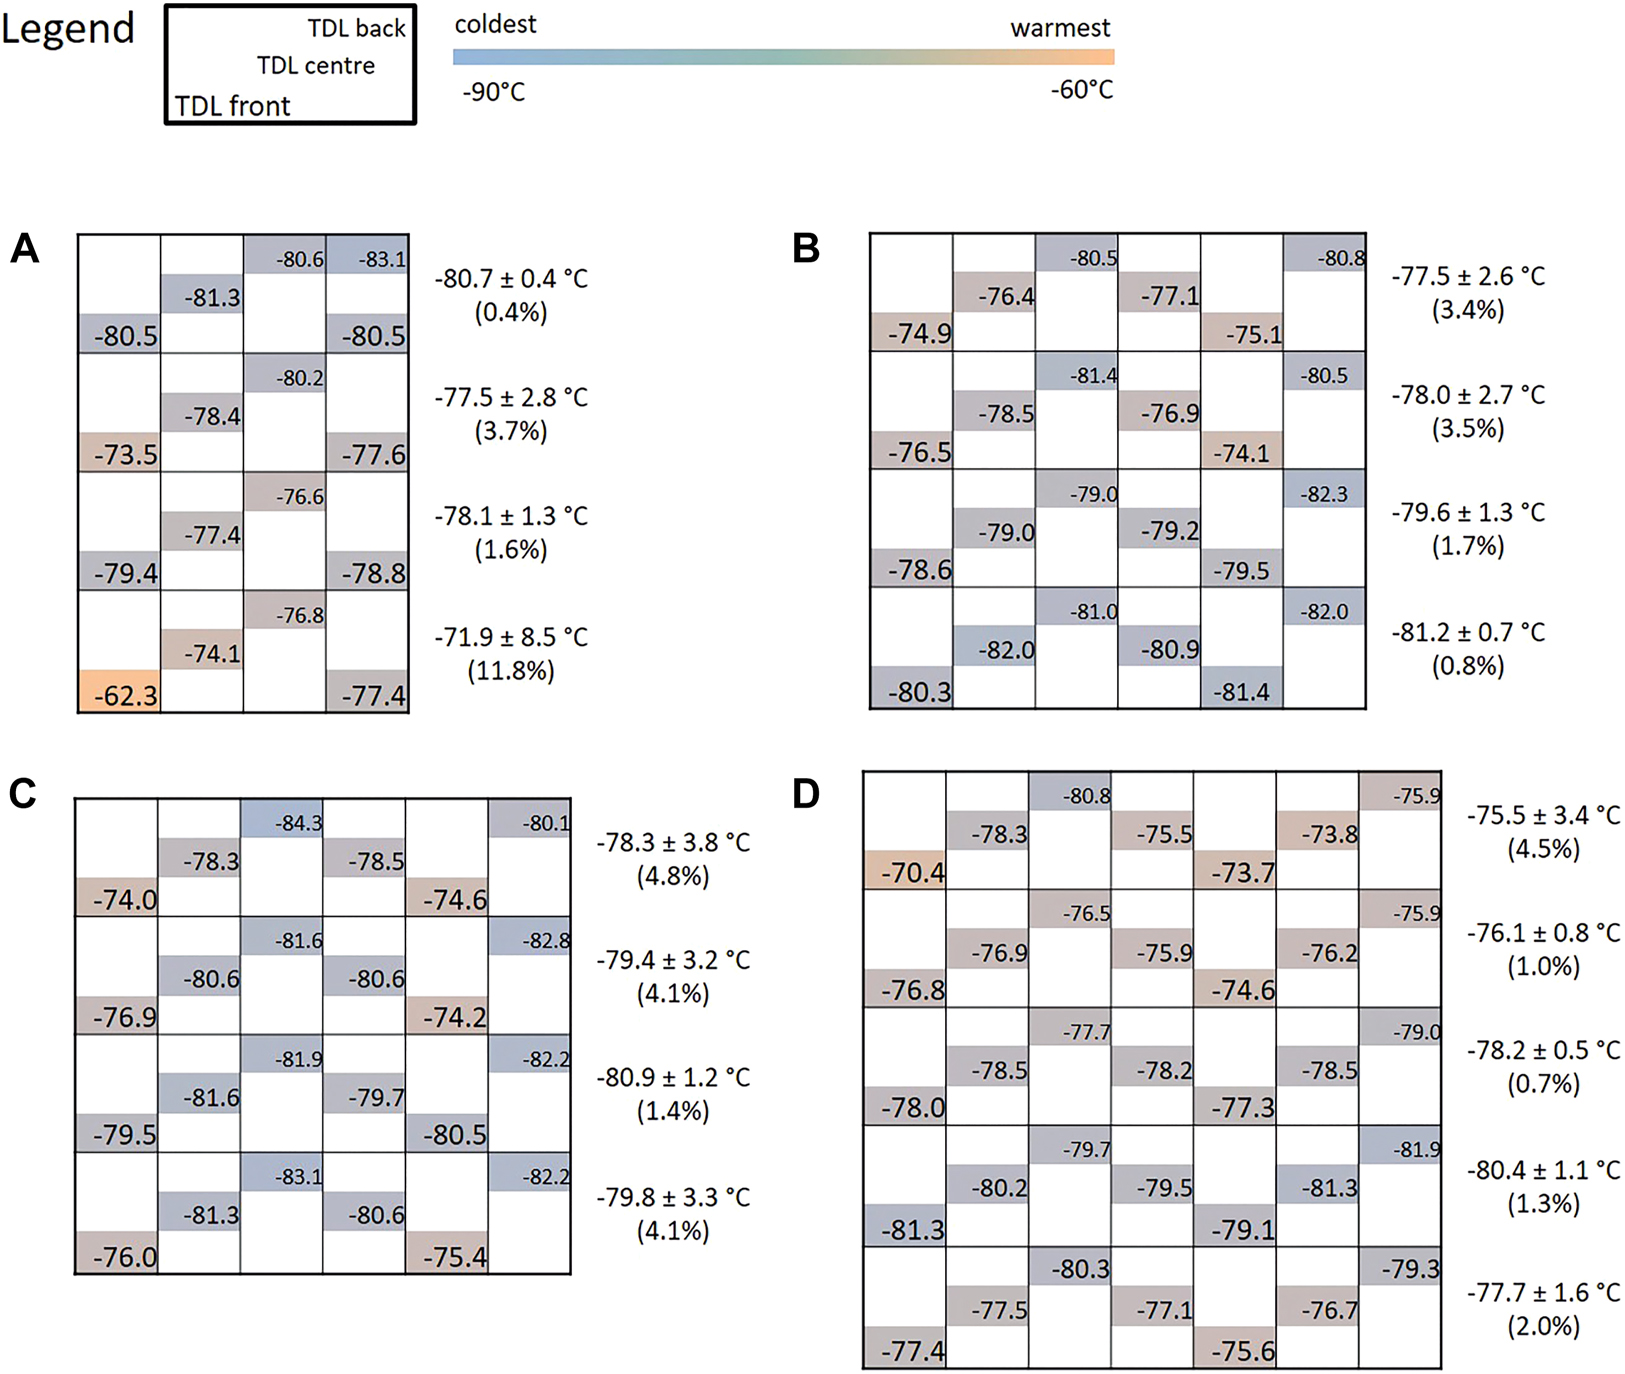
Scheme of different UTF types with temperatures measured in the front, centre, and back of the different compartments. The legend shows the position of the TDL. Additionally, the mean temperature and variation for each compartment is given. The UTF models are (A) Ewald V86–500.1, (B) Panasonic MDF_U76V_PE, (C) Sanyo MDF-074V, and (D) Thermo Scientfic HFU700TV. The colors indicate the temperature gradient in one UTF ranging from blue (coldest) to orange (warmest).
To investigate the effect of defrosting, cleaning filters, and repairing broken insulations, we analysed our data one month before and after each event (Supplementary Table 1). Comparison of the data shows a weak effect of these events on the performance of the UTFs, as the mean and median temperatures are in the same range (0.56 °C higher mean temperature in one UTF after repair of broken insulation to up to 0.63 °C colder mean temperatures after defrosting of another UTF). However, defrosting appears to have the greatest effect, as temperatures tend to be colder after defrosting (up to 0.63 °C).
To address the question of temperature deviation at the setup temperatures of −60 °C and −70 °C, we measured the temperatures at the front, centre, and back of an empty backup UTF, as shown in Table 4. Firstly, we found that the front and centre positions were closest to the set up temperature. Secondly, we found an increasing temperature deviation within the compartments from −80 °C to −60 °C with 4.2 °C and 11.7 °C, respectively.
Comparison of temperature stability of hermetic storage devices HS102 and HS200 from Askion. The stability over 48 h is given as mean temperature with coefficient of variation.
| Hermetic storage number | production year | Stability over 48 h | Max. temperature difference, °C | |
|---|---|---|---|---|
| Temperature (mean ± SD, min, max °C) | CV (Mean %) | |||
| HS102 1 | 2010 | −145.9 ± 7.6 (−142.0 to −195.0) | 5.2 | 53.0 |
| HS102 2 | 2010 | −145.4 ± 2.8 (−142.0 to −153.0) | 1.9 | 11.0 |
| HS102 3 | 2010 | −142.8 ± 6.8 (−138.0 to −176.0) | 4.8 | 38.0 |
| HS102 4 | 2010 | −147.2 ± 6.7 (−142.0 to −180.0) | 4.5 | 38.0 |
| HS102 5 | 2010 | −139.6 ± 5.6 (−135.0 to −160.0) | 4.0 | 25.0 |
| HS200 6 | 2013 | −147.0 ± 1.0 (−145.2 to −151.1) | 0.7 | 5.9 |
| HS200 7 | 2013 | −149.7 ± 0.9 (−148.4 to −153.4) | 0.6 | 5.0 |
| HS200 8 | 2013 | −156.4 ± 1.3 (−154.2 to −161.5) | 0.9 | 7.3 |
| HS200 9 | 2013 | −153.9 ± 1.3 (−151.8 to −159.4) | 0.9 | 7.6 |
| HS200 10 | 2013 | −155.7 ± 1.5 (−153.2 to −161.0) | 1.0 | 7.8 |
| HS200 11 | 2013 | −156.4 ± 1.3 (−154.0 to −161.2) | 0.8 | 7.2 |
| HS200 12 | 2014 | −153.0 ± 1.3 (−150.5 to −158.4) | 0.9 | 7.9 |
| HS200 13 | 2014 | −155.3 ± 2.0 (−151.7 to −159.9) | 1.3 | 9.0 |
| HS200 14 | 2014 | −156.6 ± 1.6 (−154.2 to −163.2) | 1.0 | 9.0 |
Cells, tissues, and samples for long term storage are stored in the LMB at temperatures < −130 °C. The internal temperature log of the HS devices (logger located above the samples) was analysed. The mean temperature is shown in Table 3 and ranged from −139.6 °C to −156.6 °C. The highest temperatures of −139.6 °C and maximum temperature differences up to 53.0 °C were observed for the older HS102 models, whereas the newer HS200 models had maximum temperature differences up to 14.3 °C.
The temperature of an empty Thermo Scientific UTF was measured at the front, centre, and back with TDLs (n=4 measurements for each position).
| Setup temperature | TDL position | Mean, °C | SD, °C | Min, °C | Max, °C | Mean deviation from set temperature, °C | Max. temperature difference, °Ca |
|---|---|---|---|---|---|---|---|
| −80 °C | Front | −80.5 | 0.4 | −79.8 | −81.3 | 0.5 | −4.2 |
| Centre | −80.9 | 0.2 | −80.5 | −81.3 | 0.9 | ||
| Back | −78.1 | 0.6 | −77.1 | −79.1 | −1.9 | ||
| −70 °C | Front | −69.9 | 0.6 | −69.3 | −73.4 | −0.1 | −8.0 |
| Centre | −69.9 | 0.2 | −69.5 | −70.8 | −0.1 | ||
| Back | −66.0 | 0.3 | −65.4 | −67.0 | −4.0 | ||
| −60 °C | Front | −63.6 | 2.0 | −59.8 | −66.5 | 3.6 | −11.7 |
| Centre | −62.7 | 1.2 | −60.8 | −64.4 | 2.7 | ||
| Back | −56.8 | 1.4 | −54.8 | −59.0 | −3.2 |
-
aMaximum temperature difference between the highest and lowest temperatures in the freezer during the experiment at the given set temperature.
Sorting
Storage of TDLs on dry ice in a polystyrene box for 120 min, either half filled or completely filled with pellets, plates, or old dry ice, showed a rapid temperature increase over time up to 42 °C. The smallest increase was observed in the box half-filled with dry ice pellets, see (Figure 4A, B). However, the temperature increased by 7.5–10.7 °C within 5 min (depending on the type of dry ice and the filling of the boxes) and was stable after about 60 min at temperatures between 23.8 °C (pellets, half-filled box) and 38.2 °C (old dry ice, full box) above the starting temperature, see (Figure 4C, D). We also checked whether the thickness of the box walls had an effect on the sorting temperature in boxes half-filled with pellets (best conditions). After 5 min, the temperature increased by 11.8 °C and remained stable at 31.6 °C above the starting temperature after 60 min (data not shown).
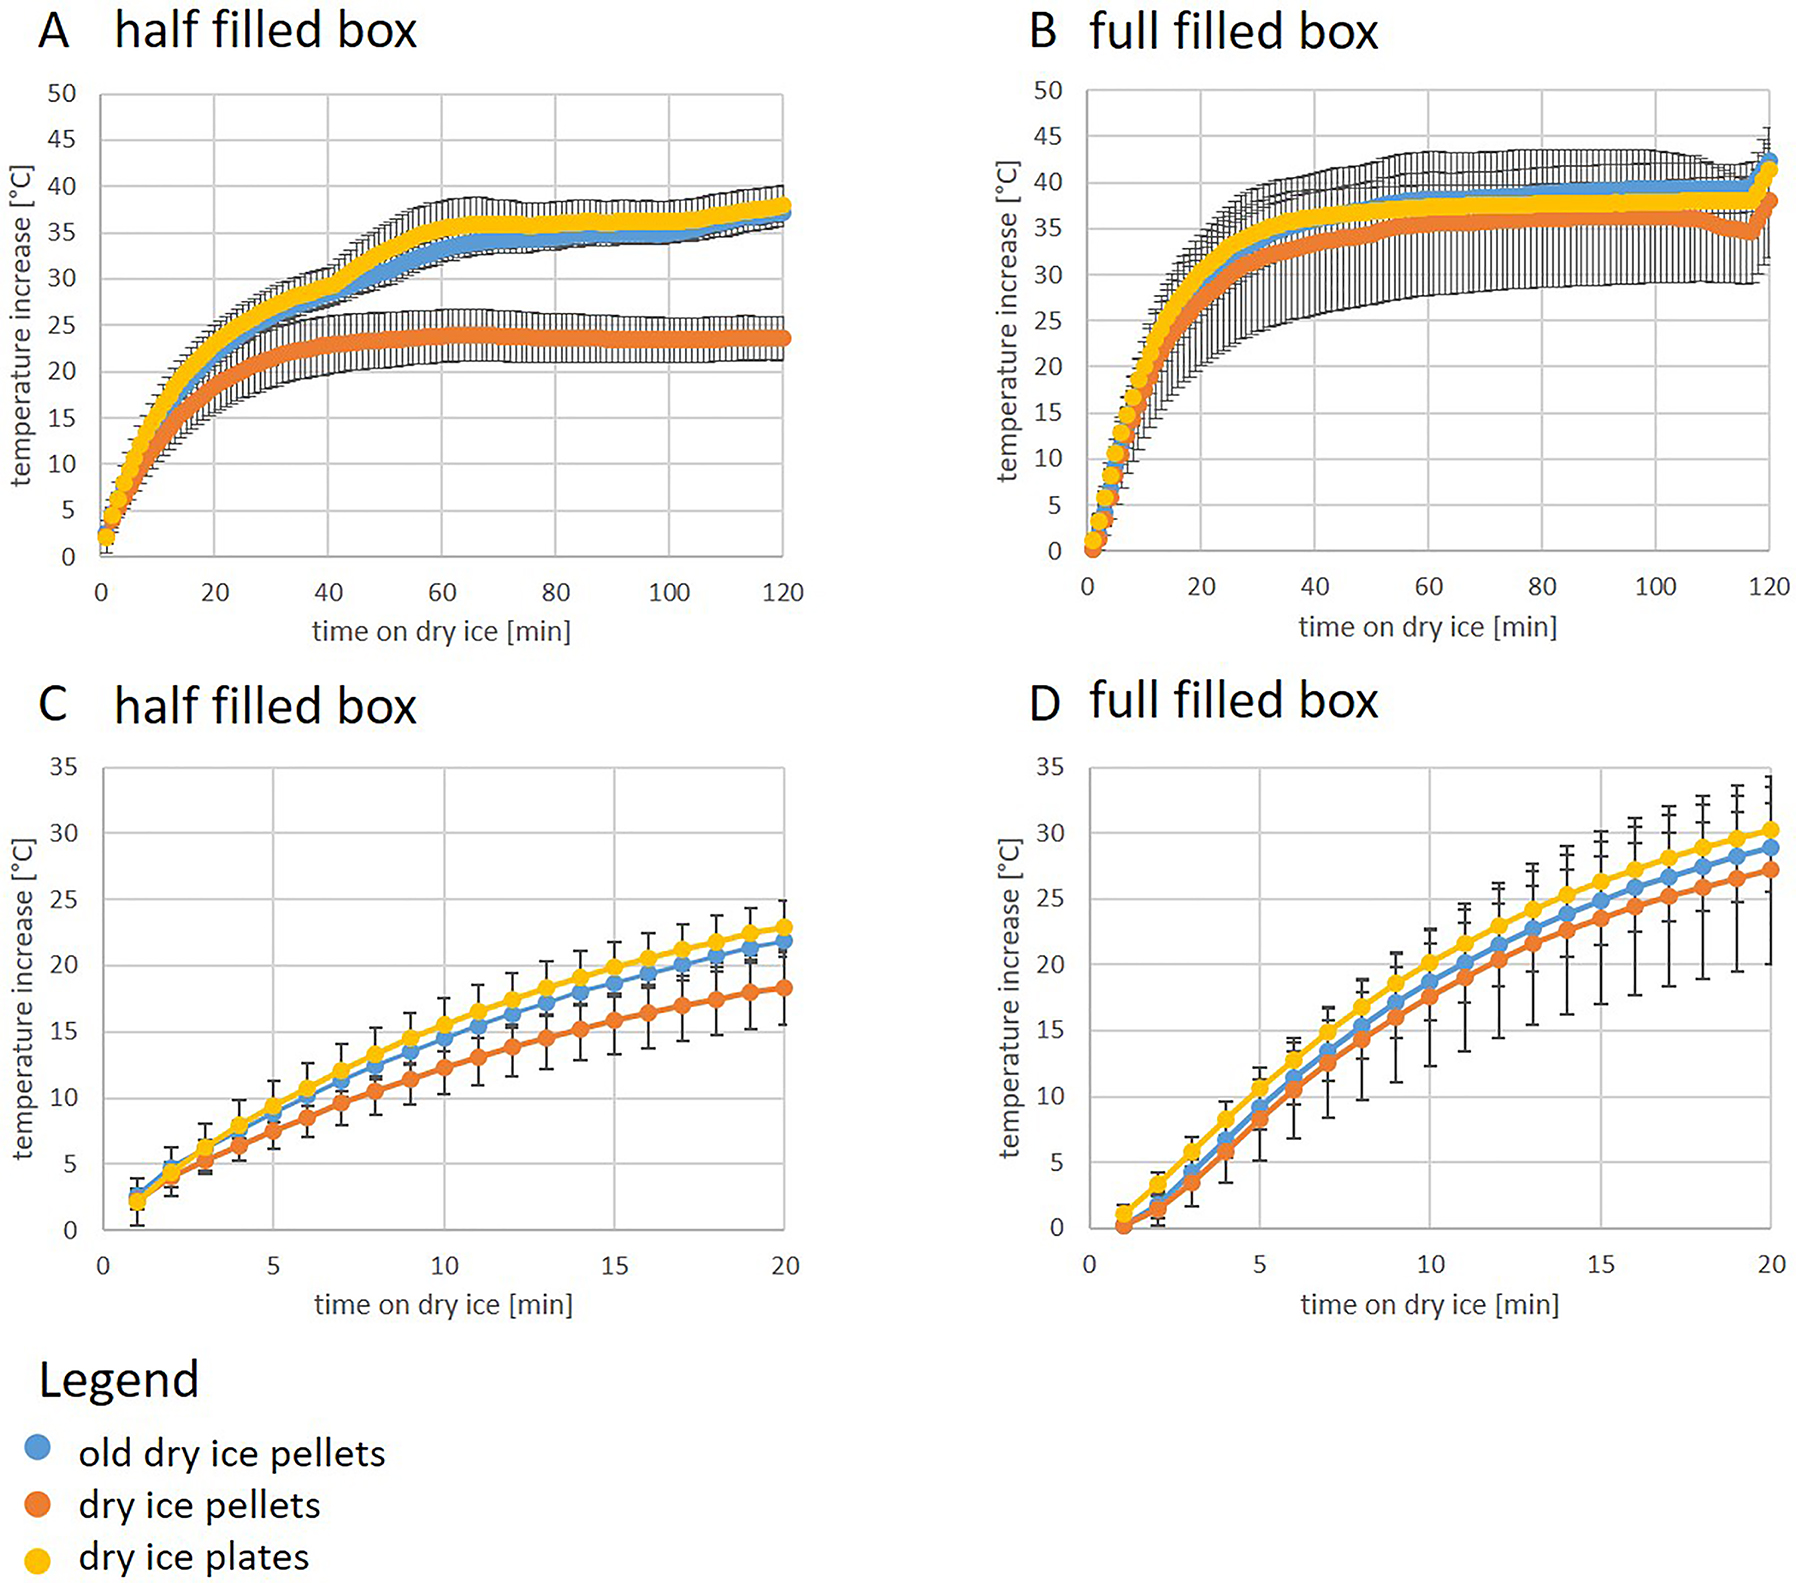
Comparison of temperature increases on dry ice in a half filled box (A and C) and a full filled polystyrene box (B and D). (A) and (B) shows the temperatures over 120 min and (C) and (D) over 20 min (n=3 replicates of 3 TDLs per measurement). As the starting temperature of TDLs was ranging between −78 °C and −83 °C, we depicted the relative increase, which is more comparable.
Discussion
Time and temperature play a critical role in all steps in biobanking [9, 26]. Although time begins when the sample is taken from the body, in most cases biobanks can only control processes after the sample has been received. In this study, we investigated different techniques and devices and their influence on the temperature of samples stored in biobanks, addressing processes such as sample transport, storage, and sorting in a time-dependent manner.
At the LMB, the temporary and long-term storage facilities are 700 m apart, so transporting samples from the laboratory to the biobank is a regular occurrence. We use polystyrene boxes filled with dry ice, which is the main and most widely used method of sample transport today. However, the use of TDLs to monitor temperature can be a source of errors due to incorrect programming or low battery, resulting in malfunction and missing data. Too short pre-cooling times can also be a problem, as they don’t reflect the situation of the samples during transport. With new devices such as the CryoPod, it is possible to transport samples at temperatures <–170 °C and automatically log the temperature over time. This method appears to be less prone to manual error and is therefore highly recommended for temperature sensitive samples such as cells. Furthermore, it provides temperature alarms, for example for low levels of liquid nitrogen. However, the CryoPod is only intended for transport over short distances and for a small number of samples.
Storage is a very critical step in biobanking [9]. Door openings of UTFs can lead to high temperature increases, which may affect samples especially close to the door [14, 15]. It needs to be considered that an UTF can be opened over 4000 times per year, as it is used in our biobank. It is important to use UTFs with internal data logs for temperature and events to see what kind of problems occurred and to assess their impact on temperature. We also identified temperature zones in each UTF tested from four different manufacturers that were not covered by internal temperature logs. In most cases, temperatures were highest near the door and lowest at the back of the UTF, which is consistent with previous studies [17]. However, we found maximum temperature deviations of up to 20.8 °C compared to 46.5 °C in 1996 [17] and 4.9 °C in 2018 [14], which may be a result of examining other UTF models with different and more locations for the measurements. The efficiency of an UTF to reach and maintain the specified temperature of −80 °C can be influenced by many factors. These include the temperature of the samples being stored (e.g. after preparation at room temperature, after transport on dry ice), dust on filters, ice thickness in the UTF, damage to insulation and seals, insufficient coolant, and high room temperatures. Our data suggest that defrosting, cleaning of filters, and repair of insulation do not have a major effect on the performance of the UTFs, as the temperature before and after the events resulted in a small mean temperature difference of less than 0.7 °C. Nevertheless, maintenance has an impact on the efficiency and lifetime of compressors [27]. Figure 5 shows four unfavorable examples from UTFs collected in recent years (not included in this study). To overcome these problems, we have developed SOPs for regular maintenance of our freezers, including checking the seals and defrosting. Another factor is the fill level of the freezers. Interestingly, the Office of Sustainability compared three UTFs from different manufacturers and found 3–4 °C above the set temperature of −80 °C, which was slightly better with fewer racks inside. This was explained by better air circulation. At −70 °C, the difference between setup and measured temperature was slightly lower than at −80 °C [28], which is almost identical to our experiment with the empty backup UTF. Worryingly, we observed an increasing temperature gradient from −80 °C (4.2 °C) to −60 °C (11.7 °C), although the maximum deviation from the set temperature was 1.9 °C and 3.6 °C, respectively. This could be problematic for the samples, especially with prolonged door openings and temperature rises. However, in a full UTF these results may be different.
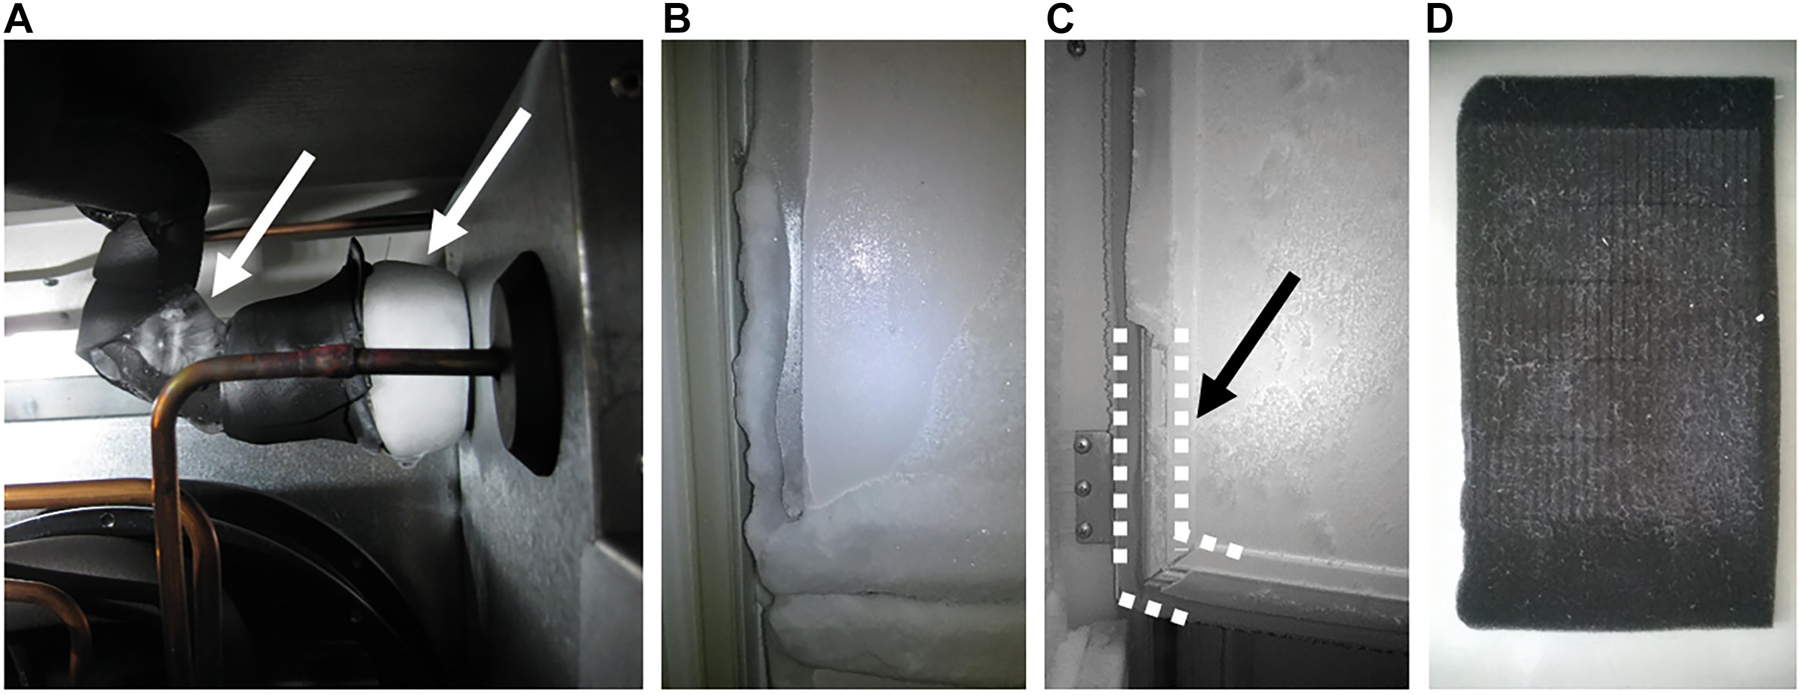
Examples of (A) damages on insulation resulting in ice formation, (B) iced seals on an inner door of an UTF, (C) damages to door seals (see dotted lines), and (D) dust on filters.
The temperature inside the sample tube is another issue. Disturbingly, the Office of Sustainability measured higher temperatures inside the tube than in the air in a UTF, although the sample size was very small [28]. In a study by Azenta, samples were found to warm up even after being returned to the freezer! A sample with a 135 s rack extraction from −190 °C took hours to return to set-up temperature. This re-cooling effect is dependent on the sample fill level, the type, and quantity of sample, the position of the tube in a box, the position of the box in a rack, and the temperature outside the cooling environment [29]. This must be taken into account, especially in the sorting process.
Few studies have investigated the effect of storage temperature on sample quality. Zander et al. found significantly altered concentrations of several metabolites in serum and citrated plasma after three months of storage at 4 °C and −20 °C, whereas they remained stable at ≤ –80 °C [30]. However, there are no studies that directly compare the effect of −60 °C, −70 °C and −80 °C on sample stability. But one can imagine that some biomarkers might be more sensitive to −60 °C than −80 °C, as the precautionary principle would dictate that the colder the better, especially in the field of metabolomics. However, most biobank samples are intended for long-term storage over years, and individual studies show the heterogeneity of analyte-dependent changes. In plasma stored for 5 years, Haid et al. found altered concentrations for 50% of the investigated metabolites, including amino acids, hexoses, acylcarnitines, glycerophospholipids, and sphingomyelins [31]. A study by Wagner-Golbs et al. found altered concentrations of 3% of 231 metabolites studied in EDTA plasma after 7 years and 26% after 16 years of storage at −80 °C [32], while Ericsson et al. showed that the proteome of frozen tissue is intact for years when stored at or below −70 °C [33, 34]. The changes in metabolite concentrations could be a result of enzymatic activity that can occur when samples are removed from a freezer and allowed to warm up for hours as mentioned above [29, 31]. Storage of biological samples in the vapour phase of liquid nitrogen at temperatures below −150 °C has been suggested as the optimal storage procedure, as the “glass transition” of water occurs below −130 °C [35]. No biochemical activity should occur and biomarkers should be protected from degradation. Individual studies (as well as own unpublished data) indicate that the differences between −80 °C and <−130 °C are strongly dependent on the biomarker class or sample material [9, 36, 37], which makes further research mandatory, as a generalisation seems hardly possible.
In our measurements, the minimum temperature of the hermetic storage devices reached −135 °C in individual cases, which is close to the water transition phase. But the temperature is always measured above the samples, so that the actual temperature is lower. However, the glass transition temperature of body fluids containing saline, proteins, and many other molecules remains unknown. Below −73 °C there seems to be no thermal intramolecular movement in a single protein study [38]. It is therefore reasonable to assume that the fluctuations we observe do not affect the samples.
The big question is what to do with this information. The answer is: it depends! Whole blood for DNA extraction [39, 40], stabilised whole blood samples for RNA extraction, or samples collected for a specific application where the stability of the biomarkers is known can be stored in warmer zones [5, 9] in UTFs as opposed to samples destined for downstream applications for the analysis of sensitive metabolites or where the downstream analysis is unknown at the time of sampling. We recommend temperature measurements in all UTFs as a quality indicator, as suggested by Powell et al. [14], and the (re)validation of UTFs by measuring temperatures at defined positions in the UTFs. This is also important for the accreditation of a biobank according to DIN EN ISO 20387 [41]. On the other hand, our cryogenic tanks (<–130 °C) were temperature stable throughout, see Table 3, and especially the newer models showed less temperature variation compared to the first models on the market. Cryogenic storage tanks also need to be (re)validated, as temperature sensors can freeze and record incorrect temperatures, or components such as inlets can wear out. The choice of cryogenic storage tank should also include the level of automation. While fully automated cryogenic tanks maintain the cold chain at all times, biological samples may experience large temperature increases, requiring manual removal of racks from the tank for sorting [42]. Freeze-thawing of biological samples is critical during sample sorting and must be avoided at all times as it can cause shifts in biomarker concentrations [2]. Although the temperature increase in a polystyrene box half-filled with dry ice pellets was lower than the other variants tested, the temperature increased by 7.5 °C within 5 min and remained stable at 23.8 °C above the initial temperature after 60 min. This is a major hindrance to time-consuming sorting where samples are placed on top of the dry ice, as in this best-case scenario the temperature reaches −54 °C. The footprint of the box must also be taken into account, as we have seen that boxes with identical footprints but different wall thicknesses can result in higher temperatures (4.3 °C after 5 min and 7.8 °C after 60 min) during sorting using the same sorting setup. This could be due to a higher rate of evaporation in the thicker boxes due to a smaller internal footprint.
In some cases, fresh dry ice is not always available, so boxes are filled with old dry ice or minimal amounts. Sorting in a cryogenic workbench or in the cryogenic sample handling area of the HS, where the temperature is stable below −100 °C for hours, should be preferred. Sorting in the CryoPod may also be an option, but the fogging of the liquid nitrogen must be considered.
All steps in biobanking can have an impact on the stored samples, and risk management can help identify critical processes. The introduction of new equipment or changes in processes should always be considered to optimise sample quality. Validation of equipment is also an important step [43] to avoid malfunctions or to identify optimal temperature zones for specific samples.
In conclusion, based on the experience of the Leipzig Medical Biobank and in order to maintain the widest possible applicability of biospecimens for downstream analysis, the optimal procedure in a biobank should include:
Sample transport using a CryoPod or similar device
Sorting of samples in a cryogenic workbench
Storage of samples at a minimum of −80 °C in predefined temperature zones of UTFs near the optimal storage temperature or –<150 °C in the vapour phase of liquid nitrogen.
Temperature logging and time stamping of the entire process
Of course, these procedures are not practical in every situation, e.g. sample transport or sorting on dry ice will continue to play an important role in the future. However, it is important to develop standard operating procedures, (re)validate or verify equipment, train staff, and monitor time and temperature to match the intended use of the samples stored in biobanks.
Funding source: European Regional Development Fund
Funding source: Universität Leipzig
Award Identifier / Grant number: Unassigned
-
Research funding: This publication is supported by LIFE – Leipzig Research Center for Civilization Diseases, University Leipzig. This project was funded by means of the European Social Fund, by the European Regional Development Fund (ERDF) and the Free State of Saxony. We acknowledge support from Leipzig University for Open Access Publishing.
-
Author contributions: All authors have accepted responsibility for the entire content of this manuscript and approved its submission.
-
Competing interests: Authors state no conflict of interest.
-
Informed consent: Not applicable.
-
Ethical approval: Not applicable.
References
1. Sonmez, C, Yıldız, U, Akkaya, N, Taneli, F. Preanalytical phase errors: experience of a central laboratory. Cureus 2020;12:e7335. https://doi.org/10.7759/cureus.7335.Search in Google Scholar PubMed PubMed Central
2. Dorow, J, Becker, S, Kortz, L, Thiery, J, Hauschildt, S, Ceglarek, U. Preanalytical investigation of polyunsaturated fatty acids and eicosanoids in human plasma by liquid chromatography-tandem mass spectrometry. Biopreserv Biobanking 2016;14:107–13. https://doi.org/10.1089/bio.2015.0005.Search in Google Scholar PubMed
3. Lippi, G, Chance, JJ, Church, S, Dazzi, P, Fontana, R, Giavarina, D, et al.. Preanalytical quality improvement: from dream to reality. Clin Chem Lab Med 2011;49:1113–26. https://doi.org/10.1515/cclm.2011.600.Search in Google Scholar PubMed
4. Kamlage, B, Neuber, S, Bethan, B, González Maldonado, S, Wagner-Golbs, A, Peter, E, et al.. Impact of prolonged blood incubation and extended serum storage at room temperature on the human serum metabolome. Metabolites 2018;8:6. https://doi.org/10.3390/metabo8010006.Search in Google Scholar PubMed PubMed Central
5. Ellervik, C, Vaught, J. Preanalytical variables affecting the integrity of human biospecimens in biobanking. Clin Chem 2015;61:914–34. https://doi.org/10.1373/clinchem.2014.228783.Search in Google Scholar PubMed
6. Sanchis-Gomar, F, Lippi, G. Physical activity - an important preanalytical variable. Biochem Med 2014;24:68–79. https://doi.org/10.11613/bm.2014.009.Search in Google Scholar PubMed PubMed Central
7. Narayanan, S. The preanalytic phase. An important component of laboratory medicine. Am J Clin Pathol 2000;113:429–52. https://doi.org/10.1309/c0nm-q7r0-ll2e-b3uy.Search in Google Scholar
8. Mrazek, C, Lippi, G, Keppel, MH, Felder, TK, Oberkofler, H, Haschke-Becher, E, et al.. Errors within the total laboratory testing process, from test selection to medical decision-making – a review of causes, consequences, surveillance and solutions. Biochem Med 2020;30:020502. https://doi.org/10.11613/bm.2020.020502.Search in Google Scholar PubMed PubMed Central
9. Hubel, A, Spindler, R, Skubitz, APN. Storage of human biospecimens: selection of the optimal storage temperature. Biopreserv Biobanking 2014;12:165–75. https://doi.org/10.1089/bio.2013.0084.Search in Google Scholar PubMed
10. Gislefoss, RE, Lauritzen, M, Langseth, H, Mørkrid, L. Effect of multiple freeze-thaw cycles on selected biochemical serum components. Clin Chem Lab Med 2017;55:967–73. https://doi.org/10.1515/cclm-2016-0892.Search in Google Scholar PubMed
11. Germann, A, Oh, Y-J, Schmidt, T, Schön, U, Zimmermann, H, von Briesen, H. Temperature fluctuations during deep temperature cryopreservation reduce PBMC recovery, viability and T-cell function. Cryobiology 2013;67:193–200. https://doi.org/10.1016/j.cryobiol.2013.06.012.Search in Google Scholar PubMed
12. Babel, M, Mamilos, A, Seitz, S, Niedermair, T, Weber, F, Anzeneder, T, et al.. Compared DNA and RNA quality of breast cancer biobanking samples after long-term storage protocols in – 80 °C and liquid nitrogen. Sci Rep 2020;10:14404–9. https://doi.org/10.1038/s41598-020-71441-9.Search in Google Scholar PubMed PubMed Central
13. Alesci, S, Borggrefe, M, Dempfle, CE. Effect of freezing method and storage at – 20 °C and – 70 °C on prothrombin time, aPTT and plasma fibrinogen levels. Thromb Res 2009;124:121–6. https://doi.org/10.1016/j.thromres.2008.11.010.Search in Google Scholar PubMed
14. Powell, S, Molinolo, A, Masmila, E, Kaushal, S. Real-time temperature mapping in ultra-low freezers as a standard quality assessment. Biopreserv Biobanking 2019;17:139–42. https://doi.org/10.1089/bio.2018.0108.Search in Google Scholar PubMed PubMed Central
15. Haslacher, H, Szekeres, T, Gerner, M, Ponweiser, E, Repl, M, Wagner, OF, et al.. The effect of storage temperature fluctuations on the stability of biochemical analytes in blood serum. Clin Chem Lab Med 2017;55:974–83, https://doi.org/10.1515/cclm-2016-0608.Search in Google Scholar PubMed
16. Wu, J, Gouveia-Figueira, S, Domellöf, M, Zivkovic, AM, Nording, M. Oxylipins, endocannabinoids, and related compounds in human milk: levels and effects of storage conditions. Prostag Other Lipid Mediat 2016;122:28–36. https://doi.org/10.1016/j.prostaglandins.2015.11.002.Search in Google Scholar PubMed
17. Su, SC, Garbers, S, Rieper, TD, Toniolo, P. Temperature variations in upright mechanical freezers. Cancer Epidemiol Biomarkers Prev 1996;5:139–40.Search in Google Scholar
18. Lee, JE, Kim, SY, Shin, SY. Effect of repeated freezing and thawing on biomarker stability in plasma and serum samples. Osong Public Health Res Perspect 2015;6:357–62. https://doi.org/10.1016/j.phrp.2015.11.005.Search in Google Scholar PubMed PubMed Central
19. Breier, M, Wahl, S, Prehn, C, Fugmann, M, Ferrari, U, Weise, M, et al.. Targeted metabolomics identifies reliable and stable metabolites in human serum and plasma samples. Plos One 2014;9:e89728. https://doi.org/10.1371/journal.pone.0089728.Search in Google Scholar PubMed PubMed Central
20. Jobard, E, Trédan, O, Postoly, D, André, F, Martin, AL, Elena-Herrmann, B, et al.. A systematic evaluation of blood serum and plasma pre-analytics for metabolomics cohort studies. Int J Mol Sci 2016;17:2035–47. https://doi.org/10.3390/ijms17122035.Search in Google Scholar PubMed PubMed Central
21. Anton, G, Wilson, R, Yu, ZH, Prehn, C, Zukunft, S, Adamski, J, et al.. Pre-analytical sample quality: metabolite ratios as an intrinsic marker for prolonged room temperature exposure of serum samples. Plos One 2015;10:e0121495. https://doi.org/10.1371/journal.pone.0121495.Search in Google Scholar PubMed PubMed Central
22. Thumfart, JO, Abidi, N, Mindt, S, Costina, V, Hofheinz, R, Klawonn, F, et al.. LC/MS based monitoring of endogenous decay markers for quality assessment of serum specimens. J Proteonomics Bioinf 2015;8:5.Search in Google Scholar
23. Schwarz, N, Knutti, N, Rose, M, Neugebauer, S, Geiger, J, Jahns, R, et al.. Quality assessment of the preanalytical workflow in liquid biobanking: taurine as a serum-specific quality indicator for preanalytical process variations. Biopreserv Biobanking 2019;17:458–67. https://doi.org/10.1089/bio.2019.0004.Search in Google Scholar PubMed
24. Betsou, F, Gunter, E, Clements, J, Souza, Yde, Goddard, KAB, Guadagni, F, et al.. Identification of evidence-based biospecimen quality-control tools: a report of the international society for biological and environmental repositories (ISBER) biospecimen science working group. J Mol Diagn 2013;15:3–16, https://doi.org/10.1016/j.jmoldx.2012.06.008.Search in Google Scholar PubMed PubMed Central
25. ISO. ISO 20387:2018(E): biotechnology — biobanking — general requirements for biobanking 2018-08;07.080 biology. Geneva: Botany. Zoology; 2018.Search in Google Scholar
26. Kamlage, B, Maldonado, SG, Bethan, B, Peter, E, Schmitz, O, Liebenberg, V, et al.. Quality markers addressing preanalytical variations of blood and plasma processing identified by broad and targeted metabolite profiling. Clin Chem 2014;60:399–412. https://doi.org/10.1373/clinchem.2013.211979.Search in Google Scholar PubMed
27. Store Smart. Everything you wanted to know about running an ultra low temperature (ULT) freezer efficiently but were afraid to ask…; 2013. Available from: https://hightech.lbl.gov/sites/all/files/documents/ULFFreezerUserGuide2013.pdf [Accessed 7 Jan 2021].Search in Google Scholar
28. Faugeroux, D. Ultra-low temperature freezer performance and energy use tests; 2016. Available from: https://www.colorado.edu/ecenter/sites/default/files/attached-files/ucr_ult_tests_report_-_2016_final_df1.pdf [Accessed 31 Jan 2023].Search in Google Scholar
29. Zandi, B, Warhurst, J, Fink, J. Protection of innocents: continued sample warm up after return to a cryogenic environment (below −150 °C) following a transient ambient picking operation. Cytotherapy 2015;17:S10. https://doi.org/10.1016/j.jcyt.2015.03.319.Search in Google Scholar
30. Zander, J, Bruegel, M, Kleinhempel, A, Becker, S, Petros, S, Kortz, L, et al.. Effect of biobanking conditions on short-term stability of biomarkers in human serum and plasma. Clin Chem Lab Med 2014;52:629–39, https://doi.org/10.1515/cclm-2013-0705.Search in Google Scholar PubMed
31. Haid, M, Muschet, C, Wahl, S, Römisch-Margl, W, Prehn, C, Möller, G, et al.. Long-term stability of human plasma metabolites during storage at −80 °C. J Proteome Res 2018;17:203–11. https://doi.org/10.1021/acs.jproteome.7b00518.Search in Google Scholar PubMed
32. Wagner-Golbs, A, Neuber, S, Kamlage, B, Christiansen, N, Bethan, B, Rennefahrt, U, et al.. Effects of long-term storage at –80 °C on the human plasma metabolome. Metabolites 2019;9:99–113. https://doi.org/10.3390/metabo9050099.Search in Google Scholar PubMed PubMed Central
33. Shabihkhani, M, Lucey, GM, Wei, B, Mareninov, S, Lou, JJ, Vinters, HV, et al.. The procurement, storage, and quality assurance of frozen blood and tissue biospecimens in pathology, biorepository, and biobank settings. Clin Biochem 2014;47:258–66, https://doi.org/10.1016/j.clinbiochem.2014.01.002.Search in Google Scholar PubMed PubMed Central
34. Ericsson, C, Franzén, B, Nistér, M. Frozen tissue biobanks. Tissue handling, cryopreservation, extraction, and use for proteomic analysis. Acta Oncol 2006;45:643–61. https://doi.org/10.1080/02841860600818047.Search in Google Scholar PubMed
35. Bojic, S, Murray, A, Bentley, BL, Spindler, R, Pawlik, P, Cordeiro, JL, et al.. Winter is coming: the future of cryopreservation. BMC Biol 2021;24:56. https://doi.org/10.1186/s12915-021-00976-8.Search in Google Scholar PubMed PubMed Central
36. Yang, J, Diaz, N, Adelsberger, J, Zhou, X, Stevens, R, Rupert, A, et al.. The effects of storage temperature on PBMC gene expression. BMC Immunol 2016;17:6. https://doi.org/10.1186/s12865-016-0144-1.Search in Google Scholar PubMed PubMed Central
37. Massie, I, Selden, C, Hodgson, H, Fuller, B. Storage temperatures for cold-chain delivery in cell therapy: a study of alginate-encapsulated liver cell spheroids stored at −80°c or −170°c for up to 1 year. Tissue Eng C Methods 2013;19:189–95, https://doi.org/10.1089/ten.tec.2012.0307.Search in Google Scholar PubMed PubMed Central
38. Tilton, RF, Dewan, JC, Petsko, GA. Effects of temperature on protein structure and dynamics: X-ray crystallographic studies of the protein ribonuclease-A at nine different temperatures from 98 to 320 K. Biochemistry 1992;31:2469–81. https://doi.org/10.1021/bi00124a006.Search in Google Scholar PubMed
39. Chen, WC, Kerr, R, May, A, Ndlovu, B, Sobalisa, A, Duze, ST, et al.. The integrity and yield of genomic DNA isolated from whole blood following long-term storage at −30 °C. Biopreserv Biobanking 2018;16:106–13. https://doi.org/10.1089/bio.2017.0050.Search in Google Scholar PubMed
40. Udtha, M, Flores, R, Sanner, J, Nomie, K, Backes, E, Wilbers, L, et al.. The protection and stabilization of whole blood at room temperature. Biopreserv Biobanking 2014;12:332–6. https://doi.org/10.1089/bio.2014.0026.Search in Google Scholar PubMed
41. Mouttham, L, Garrison, SJ, Archer, DL, Castelhano, MG. A biobank’s journey: implementation of a quality management system and accreditation to ISO 20387. Biopreserv Biobanking 2021;19:163–70. https://doi.org/10.1089/bio.2020.0068.Search in Google Scholar PubMed
42. Baber, R, Kiehntopf, M. Automation in biobanking from a laboratory medicine perspective. J Lab Med 2019;43:329–38. https://doi.org/10.1515/labmed-2019-0151.Search in Google Scholar
43. de Blasio, P, Biunno, I. New challenges for biobanks: accreditation to the new ISO 20387:2018 standard specific for biobanks. BioTech 2021;10:13. https://doi.org/10.3390/biotech10030013.Search in Google Scholar PubMed PubMed Central
Supplementary Material
This article contains supplementary material (https://doi.org/10.1515/labmed-2022-0167).
© 2023 the author(s), published by De Gruyter, Berlin/Boston
This work is licensed under the Creative Commons Attribution 4.0 International License.
Articles in the same Issue
- Frontmatter
- Original Articles
- Age-and sex-specific reference intervals of total cholesterol, LDL cholesterol, HDL cholesterol and non-HDL cholesterol. Comparison of two algorithms for the indirect estimation of reference intervals
- Increased hemolysis rate in plasma tubes after implementation of a fully automated sample delivery and acceptance system
- Keep cool! Observed temperature variations at different process stages of the biobanking workflow – examples from the Leipzig medical biobank
- Laboratory Case Report
- A case report of pseudoleukopenia: playing hide-and-seek
- Congress Report
- Congress report: 5th Munich POCT Symposium, September 27–29, 2022, Klinikum rechts der Isar der TU München