A colorimetric method to measure oxidized, reduced and total glutathione levels in erythrocytes
-
Murat Alisik
 ,
Salim Neselioglu
,
Salim Neselioglu

Abstract
Background
The most important antioxidant for erythrocytes is glutathione. In this study, a non-enzymatic recycling spectrophotometric method was developed to measure oxidized and reduced glutathione (GSH) levels in erythrocytes. The newly developed method consists of two steps. In the first step, the levels of GSH were determined in the sample. Subsequently, total glutathione levels were measured by reducing the oxidized glutathione (GSSG) with sodium borohydride (NaBH4). Half of the difference between total glutathione and GSH gives the GSSG.
Results
The new method was linear between 0 and 3000 μmol/L (r2 = 0.999). The percentage recovery measured by the developed method was 100.2 ± 2.4%. The total precision of the total glutathione, GSH and GSSG was 1.26%, 1.02% and 6.65%, respectively. GSH levels were significantly lower in patients with type 2 diabetes mellitus (DM), while GSSG levels were significantly higher (p < 0.05). Hemoglobin A1c (HbA1c) levels were negatively correlated with GSH levels, whereas positively correlated with GSSG (p < 0.05).
Conclusions
In conclusion, this method is easy to apply in routine practice with high accuracy, precision and reproducibility.
Introduction
Glutathione, apart from being an important antioxidant, is the main low-molecular-weight thiol-containing peptide with its cysteine residue present in most living cells. Its reduced and oxidized forms are indicators of the oxidation-antioxidation status [1]. Intracellular glutathione has two different forms, one of which is reduced glutathione (GSH) and the other being oxidized glutathione (GSSG). Glutathione participates in many metabolic processes such as quenching free radicals and peroxides, transferring amino acids into the cell, conjugation of toxic metabolites and compounds, cellular signaling and regulation of proteins [2]. Hence GSH/GSSG homeostasis has been a consistently attractive concern and is often determined in many conditions. But so far, there is no cheap, practical, easy, spectrophotometric method for measuring oxidized, reduced and total glutathione levels, without using enzymes to reduce the GSSG.
Erythrocytes are exposed to oxidative stress from a wide range of sources compared to other somatic cells. As they are O2-transferring cells that contain hemoglobin, they produce O2− and H2O2 with continuous autoxidation [3]. Furthermore, they cannot synthesize degradable proteins because they are non-nucleated cells. Therefore, oxidative stress is the main cause of erythrocyte damage [4]. Besides that, erythrocytes are equipped with strong antioxidant defense such as GSH [3]. Hence, measuring GSH and GSSG levels of erythrocytes has been a topic of interest all the time.
Many methods were described to measure the level of glutathione since Ellman published an article about the determination of sulfhydryl groups in biologic samples in 1959 [5]. GSSG levels were first measured by the enzymatic recycling method described by Tietze [6] and discovered by Owens and Belcher [7]. These methods depend on oxidation of 5,5′-dithiobis(2-nitrobenzoic acid) (DTNB, Ellman’s reagent) to 5-thio-2-nitrobenzoic acid (TNB), which is spectrophotometrically active at 412 nm. A spectrophotometric end-point method dependent on the consumption of nicotinamide adenine dinucleotide phosphate (NADPH) by glutathione reductase was introduced [8]. To measure GSH levels, firstly proteins must be removed from the sample. For this purpose, acidification with 5-sulfosalicylic acid, trichloroacetic acid (TCA), trifluoroacetic acid, perchloric acid or mercaptopropionic acid (MPA), ultrafiltration and addition of an organic solvent such as acetonitrile are used [9]. Another step for determination of glutathione is the reduction of GSSG. Besides glutathione reductase, many different reductant molecules were used such as dithiothreitol (DTT), dithioerythritol, dithionite, sodium and potassium borohydride, tris(2-carboxyethyl)phosphine (TCEP), triphenylphosphine and tributylphosphine [9]. Derivatization with N-ethylmaleimide, 2-vinylpyridine, etc. [10] or acidification of the medium [11] was used to overcome the overestimation of GSH which is a consequence of the self-oxidation of GSH. After protein removal, reduction of GSSG and inhibition of self-oxidation, various detection procedures were described using spectrophotometry, fluorimetry, high-performance liquid chromatography (HPLC), mass spectrometry or electrochemical analysis [12].
To the best of our knowledge, there is no spectrophotometry-based, non-enzymatic recycling method to measure GSSG and GSH. This study aimed to develop a spectrophotometric method based on sodium borohydride (NaBH4) as a reductant.
Materials and methods
Chemicals
NaBH4, 5,5′-dithiobis(2-nitrobenzoic acid) (DTNB, Ellman’s reagent), methanol, hydrochloric acid (HCl), ethylenedinitrilotetraacetic acid (EDTA), Trizma base, TCA, sodium hydroxide (NaOH), L-glutathione reduced (GSH), L-glutathione oxidized (GSSG), 2-mercaptoethanol, DTT, hydrogen peroxide solution (H2O2) and sodium chloride (NaCl) were purchased from Sigma-Aldrich Inc. (Taufkirchen, Germany) and Merck Co. (Darmstadt, Germany). All chemicals were ultrapure grade, and type-1 reagent-grade deionized water was used.
Apparatus
A Cobas c501 automated analyzer (Roche-Hitachi, Mannheim, Germany), a Shimadzu UV-1800 spectrophotometer with a temperature-controlled cuvette holder (Kyoto, Japan), an Inolab WTW 730 pH meter (Weilheim, Germany), a Lab Companion BS-21 water-bath (Seoul, South Korea) and a Thermo Scientific Varioskan Flash multimode reader (Waltham, MA, USA) were used.
Samples
Whole blood samples were drawn from healthy individuals and patients with type 2 diabetes mellitus (DM) into commercially available EDTA-treated tubes by a trained phlebotomist. Venous blood samples were washed with 0.9% NaCl solution 3 times. Then, erythrocytes were lysed with distillated water and proteins were precipitated with 20% w/v TCA solution (three parts erythrocyte lysate and one part 20% w/v TCA solution, final concentration 5% TCA in the medium). After the precipitation procedure, the supernatant of the samples was collected. If the samples were not used instantly, they were stored at −80 °C. The research related to human use has complied with all the relevant national regulations and institutional policies, is in accordance with the tenets of the Helsinki Declaration, and has been approved by the by the Local Ethics Committee of the Ankara Yildirim Beyazit University (approval number: 26379996/144). Informed consent was obtained from all individuals included in this study.
Assays
Principle of the new assay
GSSG in the samples treated with TCA solution was reduced with reagents including NaBH4 and NaOH to form GSH. NaOH was used to increase the pH, which was low due to the utilization of TCA solution, to enable the reduction of the GSSG molecules. NaBH4 was used as a reductant. After the reduction was completed, HCl solution was added to remove the remnant NaBH4 in order to prevent extra-reduction of DTNB molecules and re-oxidation of GSH molecules. GSH levels were measured using the Ellman method that was modified by Hu [13] using 500 mM Tris solution (pH: 8.2). In this method, thiol residues of GSH reduced the DTNB molecules to 2-nitro-5-benzoic acid which has an absorbance at 412 nm spectrophotometrically. GSH was measured before and after the reduction process. After dilution factor multiplication, the GSH content was subtracted from the total GSH (GSH+GSSG) content and divided by two equals to the GSSG amount.
Assay reagents
The assay depends on two measurements of GSH before and after reduction of GSSG.
Reductant reagent (for reduction of GSSG)
Reductant reagent (RR) was formed by dissolving 132.4 g of NaBH4 and 60 g of NaOH in 1000 mL of water-methanol solution (50% v/v). The final concentration of NaBH4 and NaOH was 3.5 M and 1.5 M, respectively. The reagent was produced freshly and used day-to-day.
Stopping reagent
Twelve molar HCl solution was used as the stopping reagent (SR) to remove and stop the NaBH4 reactions.
Reagent 1
Reagent 1 (R1) was formed by dissolving 3.8 g EDTA (final concentration: 10.0 mM) in 1000 mL Tris buffer, 500 mM and pH 8.2. This reagent is durable for at least 6 months at 4 °C.
Reagent 2
Reagent 2 (R2) was formed by dissolving 3.963 g of DTNB in 1000 mL of methanol (final concentration: 10.0 mM). The reagent was produced freshly and used day-to-day.
Measurement of GSH, GSH+GSSG and GSSG levels
The supernatant of the precipitated erythrocyte lysate by TCA was used as the sample. The amount of supernatant of GSH was measured directly. The procedure for the reduction of GSSG was conducted before measurement of GSH+GSSG.
Reduction procedure
Six hundred microliters of supernatant was added into 10-cm secondary tubes (reaction of NaBH4 causes bubbling, so it is important to use long tubes to prevent sample loss). Then, 150 μL of RR was added. After 15 min of incubation, 70 μL of SR was added and then measured according to the automated measurement procedure.
Automated measurement procedure
R1 volume: 110 μL (R1: 10 mM EDTA in Tris buffer, 500 mM, pH: 8.2)
Sample volume: 10 μL
R2 volume: 10 μL (R2: 10 mM DTNB in methanol)
Wavelength: The main wavelength is 415 nm, and the secondary wavelength is 700 nm (optionally dichromatic)
Reading point: End-point, increasing measurement; the first absorbance is taken before the mixing of R1 and R2 and the last absorbance is taken when the reaction trace draws a plateau (assay duration is about 10 min).
Calibration type: Linear (GSH is used as the calibrator for the assay)
The results must be multiplied with the dilution factors resulting from dilution with TCA for GSH and TCA, RR, and SR for GSH+GSSG. If the all volumes of the samples and reagents are arranged in the same ratio, the assay can also be applied manually using spectrophotometers. Use of a secondary wavelength is optional.
GSH and GSSG measurement with the commercial enzymatic recycling colorimetric kit
Enzymatic recycling of GSSG measurement was conducted using the commercially available GT40 GSH/GSSG microplate assay kit (Oxford Biomedical Research, MI, USA). Briefly, GSH is determined directly by DTNB, and the GSSG molecules are measured after reduction with glutathione reductase enzyme to GSH molecules.
HbA1c measurement
Hemoglobin A1c (HbA1c) levels were measured by using the commercially available turbidimetric inhibition immunoassay (TINIA) kit (Roche Diagnostics, Mannheim, Germany).
Statistical analysis
Distribution of variables was evaluated by using the Shapiro-Wilk test. Parametrically distributed variables were compared with paired Student’s T test or Student’s T test. Non-parametrically distributed variables were compared using the Wilcoxon rank test or the Mann-Whitney U test. Comparison tests, variance analysis, correlation analyses and linear regression analyses were performed using the IBM SPSS Statistics (Version 20) computer program (IBM, Armonk, NY, USA, 2011).
Results
Optimizations of NaBH4, NaOH and HCl concentrations
While preparing the supernatant, 20% TCA was used and this provides the acidity of the supernatant. The concentration of this TCA solution in the sample was approximately 306 mM. NaBH4 can reduce the GSSG molecules at alkaline pH. Therefore, the pH of the supernatant was increased by using NaOH. Optimization of NaOH concentration was firstly evaluated with a pH meter, by changing the concentration of NaOH while other chemicals’ concentrations were kept constant. The optimal concentration of NaOH was found to be 1.5 M in solution. NaBH4 concentration is important because all the GSSG molecules must be reduced and the remnant NaBH4 must be removed from the media. If it is inadequate to reduce all the GSSG molecules, this causes false low results. If NaBH4 is not removed completely, it causes the reduction of the formed GSH-TNB bonds and false results, eventually. If GSSG solution was used as a sample, 35 mM NaBH4 was adequate. However, in supernatant samples, this concentration was insufficient to reduce all the GSSG molecules. The optimum NaBH4 concentration was 3.5 M in the solution. To remove the remnant NaBH4 from the media, HCl was used. Twelve molar HCl was used to not increase the dilution factor. The optimum HCl volume was 70 μL for 150 μL of the reductant reagent, although the optimal time of adding HCl was important to ensure that NaBH4 reduced all of the GSSG molecules. In addition, NaBH4 was consumed spontaneously and permitted the re-oxidation of the GSH molecules because of alkaline pH. The optimal time of adding HCl was found to be 10–20 min after RR was added. Optimal concentrations of the solutions used were determined by changing the concentration of one chemical at once while other chemicals were kept constant, or by the dynamic change of concentrations of all chemicals.
Reaction kinetics of blank, GSSG and supernatant samples
Reaction kinetics of various samples and 5% TCA solution (as blank) which were measured before and after the reduction process in the automated analyzer are shown in Figure 1.
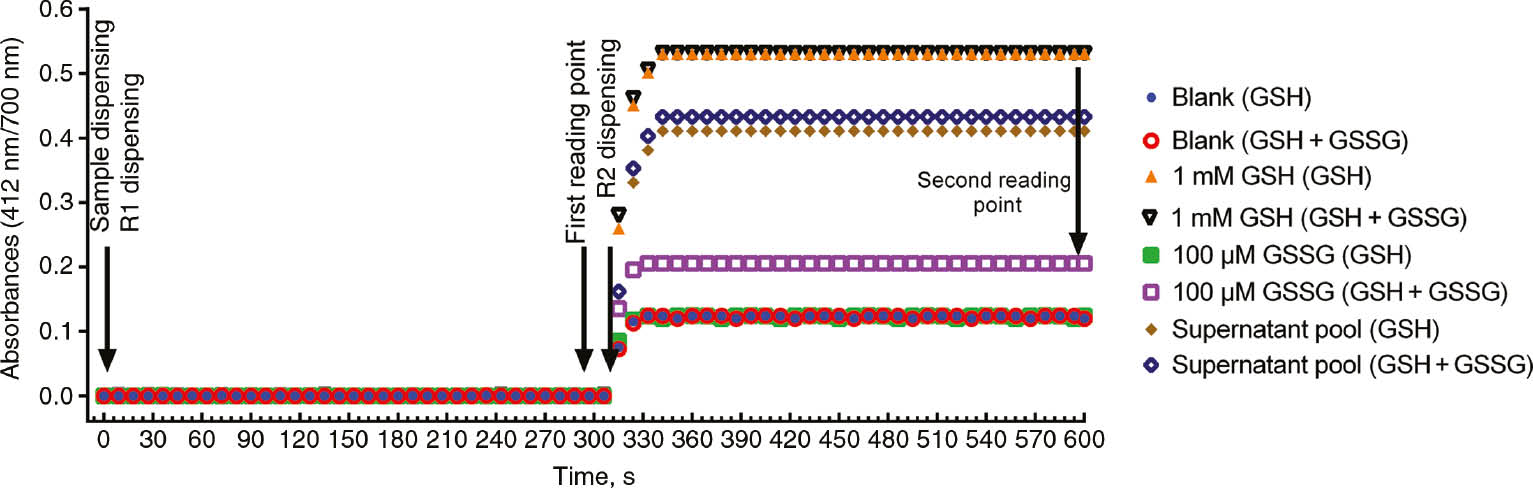
Reaction kinetics of the assay pair of 5% TCA solution as a blank, GSSG solution, GSH solution and supernatant pool samples.
Monitoring GSH-GSSG exchanges of samples by auto-oxidation
Pooled and equally separated whole blood samples were left for auto-oxidation at 37 °C in water-bath from 0 to 3180 min. Until 540 min, there was no change in the GSH+GSSG levels, while increase in GSSG levels and decrease in GSH levels were observed. After 540 min, advanced oxidations of GSSG and GSH were seen (Figure 2).
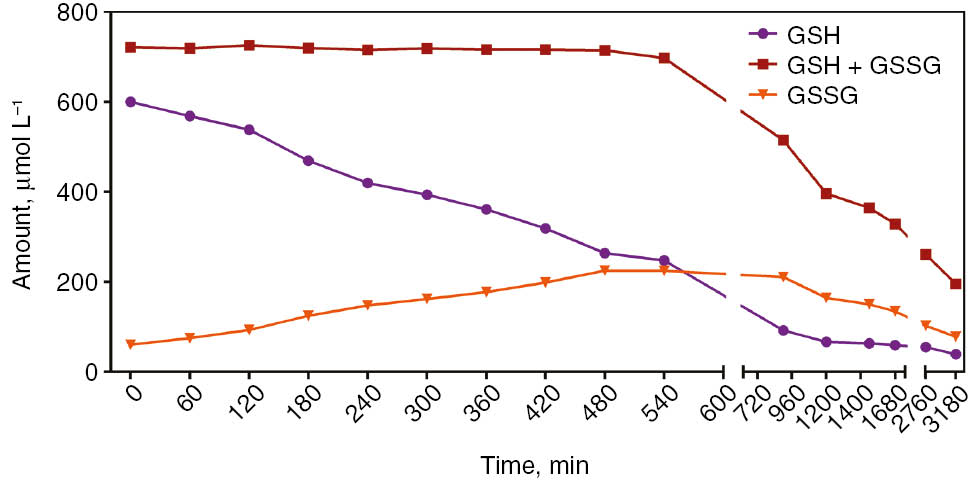
Alteration of GSH, GSH+GSSG and GSSG levels in whole blood let to sample auto-oxidation at 37 °C.
Linearity
The linearity of the assay was generated with serial dilution of GSSG solution and with the pool of the supernatant. The upper limit of the linearity of GSSG was 3000 μM. The regression formula of the concentration of diluted GSSG solution and measured levels of GSSG was conducted. The slope was calculated as 0.9997±0.0014 and the intercept was calculated as 0.395±0.848. Also, the linearity of diluted supernatant pool samples was conducted. The correlation coefficient (r2) for GSH, GSH+GSSG and GSSG was calculated as 0.999, 0.999 and 0.963, respectively.
Lower detection limit
The detection limit of the assay was determined by measuring the zero calibrator 10 times. The detection limit, defined as the mean value of zero calibrator+3 standard deviations (SDs), was 2.96 μM.
Analytical recovery
The percentage recovery of the new method was determined via the addition of 60 μM GSSG to supernatant samples. The mean percentage recovery was 100.2±2.4%.
Analytical sensitivity
The analytical sensitivity was 10.12×10⁻⁴ absorbance/amount, [A×(μM)−1] for GSH calculated from the calibration line.
Precision
Precision of the new assay was determined by serial testing in three sample groups: the supernatant pool, 100 μM and 500 μM of GSSG solution. Total precision was calculated between 1.02 and 6.65% for samples, as shown in Table 1.
Precision of the new assay in sample groups.
| Interassay CV% | Between-run CV% | Between-day CV% | Total CV% | Mean±SD | |
|---|---|---|---|---|---|
| 500 μM GSSG solution | 0.80 | 0.49 | 0.83 | 1.25 | 499.6±4.9 |
| 100 μM GSSG solution | 1.18 | 1.42 | 1.81 | 2.58 | 99.8±2.0 |
| Supernatant pool GSH+GSSG | 0.48 | 0.34 | 1.11 | 1.26 | 815.8±9.5 |
| Supernatant pool GSH | 0.49 | 0.15 | 0.88 | 1.02 | 670.5±6.2 |
| Supernatant pool GSSG | 2.57 | 3.37 | 5.13 | 6.65 | 64.1±3.7 |
CV, coefficient of variation; GSH, reduced glutathione; GSSG, oxidized glutathione; SD, standard deviation.
Method comparison
The commercial kit was used to compare with the new method. Correlations of GSH, GSH+GSSG and GSSG were calculated as 0.901, 0.913 and 0.603; respectively (p<0.001 for each). Also, auto-oxidized samples incubated in water bath at 37 °C were used to compare the two methods. Mean GSH+GSSG levels and precision of the two methods were calculated as 1189.3±75.7, 6.36% and 1084.3±1433, 1.32% for the commercial kit and the new method, respectively (Figure 3).
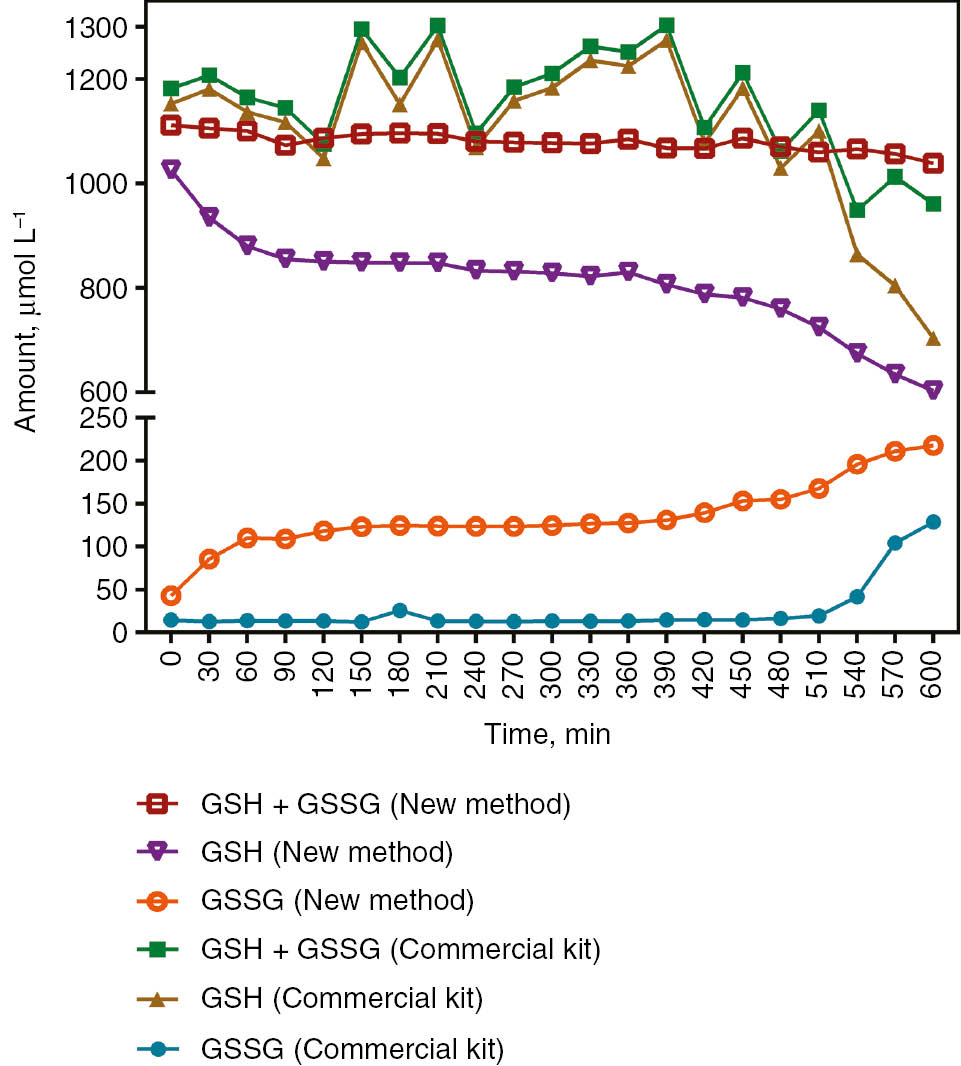
Comparison of the new method and the commercial kit in the alteration of GSH, GSH+GSSG and GSSG levels in whole blood let to sample auto-oxidation at 37 °C.
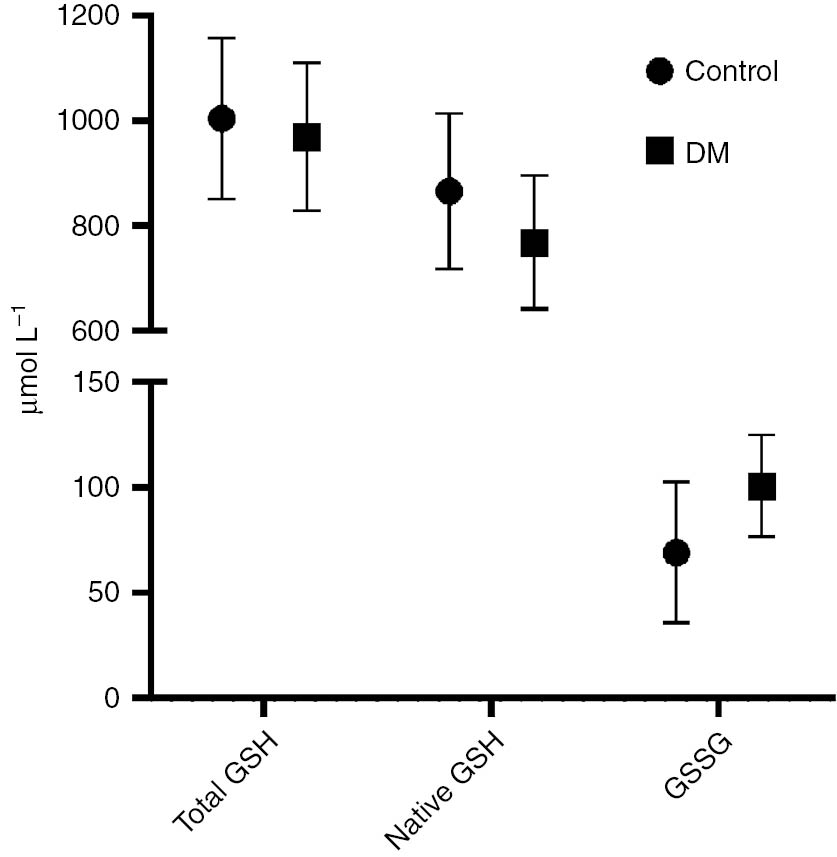
Comparison of type 2 DM patients with healthy volunteers using both the novel and the commercial kits
Samples of patients with DM and healthy volunteers (control) were measured with the new assay and the commercial kit. GSH were decreased and GSSG were increased significantly in the DM group compared to control (p<0.05, Table 2, Figure 4). A positive correlation was observed between HbA1c and GSSG in the new method, whereas a negative correlation was observed in the commercial kit (r=0.357 and r=−0.349; respectively) (Table 3).
Comparison of demographic characteristics, hemoglobin and HbA1c levels and levels of glutathione parameters of the DM group with the control group.
| Control (n=25) | DM (n=25) | p-Value | |
|---|---|---|---|
| Age, years | 50.92±9.16 | 56.7±11.9 | 0.060 |
| Gender, female/male | 11/14 | 13/12 | 0.571 |
| GSH+GSSG, μmol/La | 1004.0±154.0 | 969.2±140.7 | 0.408 |
| GSH, μmol/La | 865.6±147.8 | 767.9±127.3 | 0.016 |
| GSSG, μmol/La | 69.2±33.4 | 100.7±24.1 | <0.001 |
| GSH+GSSG, μmol/Lb | 1101.4±200.1 | 1052.7±182.4 | 0.373 |
| GSH, μmol/Lb | 1061.8±203.8 | 946.2±172.7 | 0.036 |
| GSSG, μmol/Lb | 19.8±23.4 | 53.3±14.2 | <0.001 |
| Hemoglobin, g/dL | 13.9±1.5 | 13.6±3.0 | 0.641 |
| HbA1c, mmol/mol | 73.8±19.0 | ||
| HbA1c, % | 8.9±1.7 |
aNew method. bCommercial kit. DM, diabetes mellitus; GSH, reduced glutathione; GSSG, oxidized glutathione; HbA1c, hemoglobin A1c.
Comparison of DM patients with the control group.
Correlation of HbA1c levels with the GSH and GSSG parameters.
| HbA1c, % | HbA1c, mmol/mol | |||
|---|---|---|---|---|
| r | p-Value | r | p-Value | |
| GSH, μmol/La | −0.313 | 0.049 | −0.332 | 0.036 |
| GSSG, μmol/La | 0.357 | 0.024 | 0.359 | 0.023 |
| GSH, μmol/Lb | 0.050 | 0.759 | 0.041 | 0.799 |
| GSSG, μmol/Lb | −0.349 | 0.027 | −0.351 | 0.026 |
aNew method. bCommercial kit. GSH, reduced glutathione; GSSG, oxidized glutathione; HbA1c, hemoglobin A1c; r, Pearson correlation coefficient.
Discussion
Glutathione is one of the most important antioxidants of the intracellular compartment [14]. It has various important metabolic functions such as detoxification, signal transduction, synthesis of DNA and protein, cell proliferation and apoptosis, mitochondrial function, neurodegeneration, and protection of cognitive function of the brain [2]. Therefore, it may play a role in the pathogenesis of many diseases such as neurological disorders, fibrosis of organs, cardiovascular disease, DM and liver diseases [15].
The first method was to measure sulfhydryl groups, as described by Ellman in 1959 [5]. Since then, many new methods have been described to measure plasma, tissue and/or intracellular levels of reduced and oxidized levels of glutathione. Most of these methods require sophisticated devices, including high-performance liquid chromatography (HPLC) methods, bioluminescence methods, fluorometric methods, nanosensor methods, liquid chromatography-mass spectrometry (LC-MS) and gas chromatography-mass spectrometry (GC-MS) [9], [16], [17]. Nowadays, all described spectrophotometric methods to measure GSSG levels demand enzymes as reagents [6], [8], [18]. This new assay is a spectrophotometric method using NaBH4 as a reagent. Basically, total and reduced levels of GSH were measured, and GSSG levels were calculated.
To date, several reducing agents have been used to reduce GSSG in the GSSG/GSH measurements, such as DTT, 2-mercaptoethanol, sodium and potassium borohydride, tris(2-hydroxyethyl) phosphine, TCEP, and trimethyl-TCEP [19]. However, in colorimetric methods using DTNB and 4-dipyridyldisulfide (4-DPS), reducing agents may falsify these measurements by reducing these molecules [9], [19]. Furthermore, the reducing agents (especially DTT, 2-mercaptoethanol, etc.) which contain the sulfhydryl group also affect the fluorometric measurements [20]. Therefore, these molecules must be removed from the media after all GSSGs are reduced. To date, many methods have been used to remove NaBH4, such as the dialysis system [21], acid addition to the medium [22] or the use of formaldehyde [23]. In the novel method, HCl was used to remove NaBH4. The formation of foam and gas after the reaction of NaBH4 with acid is another problem [20]. This problem is handled by performing the operations in long tubes.
The reduction property of NaBH4 varies depending on its concentration, the time of application and the sample it is applied to. Erel and Neşelioğlu [23] used 10 mM NaBH4 and incubated for 2 min to determine the disulfide in the serum sample. Hansen et al. [24] incubated the sample with 7.9 M NaBH4 (0.93 M in the reaction medium) for 30 min using the HPLC method. In the novel method, the minimum NaBH4 concentration required for the GSSG solution was about 35 mM in the reaction medium and higher levels of NaBH4 (about 500 mM) for the hemolysate supernatant pool. It was thought that, this situation was due to the different matrix of hemolysate supernatant pool compared to the GSSG solution prepared using pure water and GSSG.
NaBH4 completed the reduction reaction in minutes at high concentrations; however, in order to complete at lower concentrations (40–100 mM), either heating or waiting for longer than 30 min is necessary [24]. After making sure that it reduced GSSG, the remnant of NaBH4 solution used (in the newly developed method) was removed with HCl. When the time of adding HCl is between 10 and 20 min, it is shown to be consistent in the results. Early addition of HCl causes differences among measurements. This difference was reasoned to the removal of NaBH4 from the environment before providing adequate reduction of all GSSG in all samples. In addition, delayed addition of HCl resulted in lower results. It was detected that this is due to the re-oxidation of GSH. It is known that GSH is not re-oxidized in acidic medium [25]. Therefore, once the reduction is complete, the reaction medium should be re-acidified.
Proteins containing other thiol groups in the samples should be removed in GSSG measurement methods. Acids such as TCA and MPA are used for this purpose [26]. TCA is used for this purpose in the novel method, causes the samples to be acidic, and this acidity leads to depletion of NaBH4. NaOH was added in the NaBH4 solution to solve this problem.
Another problem in GSH and GSSG measurement methods is that auto-oxidation of GSH causes false high GSSG results [9]. In order to prevent this, assays have used thiol-masking agents, such as N-ethylmaleimide, 2-vinyl pyridine, 1-cyano-4-dimethylamino-pyridinium [27], or acidification [25]. The newly developed method used acidity to prevent this situation.
GSH, which is the most important antioxidant of the cell, returns to GSSG by oxidation in the presence of an oxidant [28]. An auto-oxidation study was performed by allowing whole blood samples to oxidize at 37 °C over time. In these whole blood samples, which were left to auto-oxidation, GSH+GSSG levels remained stable, whereas GSSG increased with the decrease of GSH levels as expected. However, after 9 h, it was observed that irreversible oxidation started with a decrease in GSH+GSSG. In addition, this auto-oxidation study was repeated, comparing with the commercial kit. The newly developed method showed oxidation from the beginning, while the commercial kit did not exhibit oxidation until irreversible oxidation occurred. Furthermore; in the time interval that % coefficient of variation (CV) is expected to be constant, the % CV of the commercial kit was 6.36, while the % CV of the newly developed method was 1.32. As the upper measurement limit of the commercial kit is 6 μmol/L of GSH, this is thought to be due to dilution of samples with a very high dilution rate of about 500 times.
In the literature, GSH and GSSG levels have been studied in many diseases. Delmas-Beauvieux et al. [29] found the levels of GSH and GSSG from whole blood of AIDS patients to be 520 and 180 μmol/L, respectively; in healthy volunteers, these parameters were measured to be 1100 and 90 μmol/L, respectively. In a study conducted by Navarro et al. [30], patients with lung and breast cancer were compared with healthy individuals. GSH and GSSG levels were 1037 and 26 μmol/L in lung cancer, 995 and 26 in breast cancer, and 930 and 26 μmol/L in the control group, respectively. Spickett et al. [31] measured GSH and GSSG levels in preeclampsia patients to be 562 and 344 μmol/L, respectively, while the levels were 756 and 322 μmol/L in the control group, respectively. Samiec et al. [32] determined the GSH and GSSG levels in DM patients to be 713 and 135 μmol/L, respectively, whereas in the control group, they were measured to be 962 and 84 μmol/L, respectively. In another study, lower GSH levels were found in DM compared to healthy individuals [33]. In another DM study, GSH levels were significantly lower in the DM group (5.14±0.17 μmol/g Hb) than the control group (6.22±0.13 μmol/g Hb). Also, they found a negative correlation between HbA1c and GSH (r=−0.42, p<0.001) [34]. De Mattia et al. ascertained the erythrocyte GSH concentrations of DM patients to be lower than the control group, whereas the GSSG levels were higher [35]. Similarly, a preliminary study, conducted with the newly developed method, comparing DM patients with a control group, demonstrated higher GSSG levels and lower GSH levels in the DM group. Similar to the previously reported values, a negative correlation between the levels of GSH and HbA1c and a positive correlation with HbA1c levels and GSSG levels was established by our newly developed method.
Conclusions
In conclusion, most of the current methods that measure the GSH and GSSG require sophisticated devices such as HPLC, fluorometer, GC-MS and LC-MS. Moreover, spectrophotometric methods which are currently being utilized are expensive methods due to the enzyme and coenzymes used as reagents. This newly developed method is easy to apply and cheaper, showing similar accuracy, precision and repeatability to the values with currently existing spectrophotometric methods.
Author contributions: All the authors have accepted responsibility for the entire content of this submitted manuscript and approved submission.
Research funding: This work was supported by the Project Office of the Ankara Yildirim Beyazit University (grant number: 3064).
Employment or leadership: None declared.
Honorarium: None declared.
Competing interests: The funding organization(s) played no role in the study design; in the collection, analysis, and interpretation of data; in the writing of the report; or in the decision to submit the report for publication.
Conflict of interest: The authors declare that they have no conflict of interest.
References
1. Gaucher C, Boudier A, Bonetti J, Clarot I, Leroy P, Parent M. Glutathione: antioxidant properties dedicated to nanotechnologies. Antioxidants (Basel) 2018;7:E62.10.3390/antiox7050062Search in Google Scholar
2. Oliveira PV, Laurindo FR. Implications of plasma thiol redox in disease. Clin Sci 2018;132:1257–80.10.1042/CS20180157Search in Google Scholar
3. da Silva DG, Chaves NA, Miyamoto S, de Almeida EA. Prolonged erythrocyte auto-incubation as an alternative model for oxidant generation system. Toxicol In Vitro 2019;56:62–74.10.1016/j.tiv.2019.01.006Search in Google Scholar
4. Zheng S, Zhao J, Xing H, Xu S. Oxidative stress, inflammation, and glycometabolism disorder-induced erythrocyte hemolysis in selenium-deficient exudative diathesis broilers. J Cell Physiol 2019;234:16328–37.10.1002/jcp.28298Search in Google Scholar
5. Ellman GL. Tissue sulfhydryl groups. Arch Biochem Biophys 1959;82:70–7.10.1016/0003-9861(59)90090-6Search in Google Scholar
6. Tietze F. Enzymic method for quantitative determination of nanogram amounts of total and oxidized glutathione: applications to mammalian blood and other tissues. Anal Biochem 1969;27:502–22.10.1016/0003-2697(69)90064-5Search in Google Scholar
7. Owens CW, Belcher RV. A colorimetric micro-method for the determination of glutathione. Biochem J 1965;94:705–11.10.1042/bj0940705Search in Google Scholar
8. Guntherberg H, Rost J. The true oxidized glutathione content of red blood cells obtained by new enzymic and paper chromatographic methods. Anal Biochem 1966;15:205–10.10.1016/0003-2697(66)90025-XSearch in Google Scholar
9. Monostori P, Wittmann G, Karg E, Turi S. Determination of glutathione and glutathione disulfide in biological samples: an in-depth review. J Chromatogr B Anal Technol Biomed Life Sci 2009;877:3331–46.10.1016/j.jchromb.2009.06.016Search in Google Scholar PubMed
10. Hajdinák P, Czobor Á, Lőrincz T, Szarka A. The problem of glutathione determination: a comparative study on the measurement of glutathione from plant cells. Period Polytech Chem Eng 2019;63:1–10.10.3311/PPch.11785Search in Google Scholar
11. Claeson AS, Gouveia-Figueira S, Stenlund H, Johansson AI. A standardized protocol for comparable analysis of GSH/GSSG by UHPLC-ESI-MSMS for human plasma. J Chromatogr B 2019;1104:67–72.10.1016/j.jchromb.2018.11.007Search in Google Scholar
12. Liu M, Feng L, Zhang X, Hua Y, Wan Y, Fan C, et al. Superwettable microwell arrays constructed by photocatalysis of silver-doped-ZnO nanorods for ultrasensitive and high-throughput electroanalysis of glutathione in hela cells. ACS Appl Mater Interfaces 2018;10:32038–46.10.1021/acsami.8b13301Search in Google Scholar
13. Hu ML. Measurement of protein thiol groups and glutathione in plasma. Methods Enzymol 1994;233:380–5.10.1016/S0076-6879(94)33044-1Search in Google Scholar
14. Coppo L, Ogata FT, Santhosh SM, Sventelius T, Holmgren A. Enzymatic glutaredoxin-dependent method to determine glutathione and protein S-glutathionylation using fluorescent eosin-glutathione. Anal Biochem 2019;568:24–30.10.1016/j.ab.2018.12.021Search in Google Scholar
15. Espinosa-Díez C, Miguel V, Vallejo S, Sánchez FJ, Sandoval E, Blanco E, et al. Role of glutathione biosynthesis in endothelial dysfunction and fibrosis. Redox Biol 2018;14:88–99.10.1016/j.redox.2017.08.019Search in Google Scholar
16. Huang ZM, Cai QY, Ding DC, Ge J, Hu YL, Yang J, et al. A facile label-free colorimetric method for highly sensitive glutathione detection by using manganese dioxide nanosheets. Sensor Actuat B Chem 2017;242:355–61.10.1016/j.snb.2016.11.066Search in Google Scholar
17. Ngamchuea K, Batchelor-McAuley C, Compton RG. Rapid method for the quantification of reduced and oxidized glutathione in human plasma and saliva. Anal Chem 2017;89:2901–8.10.1021/acs.analchem.6b04186Search in Google Scholar
18. Brigelius R, Muckel C, Akerboom TP, Sies H. Identification and quantitation of glutathione in hepatic protein mixed disulfides and its relationship to glutathione disulfide. Biochem Pharmacol 1983;32:2529–34.10.1016/0006-2952(83)90014-XSearch in Google Scholar
19. Comini MA. Measurement and meaning of cellular thiol: disulphide redox status. Free Radic Res 2016;50:246–71.10.3109/10715762.2015.1110241Search in Google Scholar
20. Camera E, Picardo M. Analytical methods to investigate glutathione and related compounds in biological and pathological processes. J Chromatogr B 2002;781:181–206.10.1016/S1570-0232(02)00618-9Search in Google Scholar
21. Carru C, Deiana L, Sotgia S, Pes GM, Zinellu A. Plasma thiols redox status by laser-induced fluorescence capillary electrophoresis. Electrophoresis 2004;25:882–9.10.1002/elps.200305768Search in Google Scholar
22. Chen W, Zhao Y, Seefeldt T, Guan X. Determination of thiols and disulfides via HPLC quantification of 5-thio-2-nitrobenzoic acid. J Pharm Biomed Anal 2008;48:1375–80.10.1016/j.jpba.2008.08.033Search in Google Scholar
23. Erel O, Neselioglu S. A novel and automated assay for thiol/disulphide homeostasis. Clin Biochem 2014;47:326–32.10.1016/j.clinbiochem.2014.09.026Search in Google Scholar
24. Hansen RE, Østergaard H, Nørgaard P, Winther JR. Quantification of protein thiols and dithiols in the picomolar range using sodium borohydride and 4,4′-dithiodipyridine. Anal Biochem 2007;363:77–82.10.1016/j.ab.2007.01.002Search in Google Scholar
25. Rossi R, Milzani A, Dalle-Donne I, Giustarini D, Lusini L, Colombo R, et al. Blood glutathione disulfide: in vivo factor or in vitro artifact? Clin Chem 2002;48:742–53.10.1093/clinchem/48.5.742Search in Google Scholar
26. Stempak D, Dallas S, Klein J, Bendayan R, Koren G, Baruchel S. Glutathione stability in whole blood: effects of various deproteinizing acids. Ther Drug Monit 2001;23:542–9.10.1097/00007691-200110000-00008Search in Google Scholar
27. Winther JR, Thorpe C. Quantification of thiols and disulfides. Biochim Biophys Acta 2014;1840:838–46.10.1016/j.bbagen.2013.03.031Search in Google Scholar
28. Pakfetrat A, Dalirsani Z, Hashemy SI, Ghazi A, Mostaan LV, Anvari K, et al. Evaluation of serum levels of oxidized and reduced glutathione and total antioxidant capacity in patients with head and neck squamous cell carcinoma. J Cancer Res Ther 2018;14:428–31.Search in Google Scholar
29. Delmas-Beauvieux M-C, Peuchant E, Couchouron A, Constans J, Sergeant C, Simonoff M, et al. The enzymatic antioxidant system in blood and glutathione status in human immunodeficiency virus (HIV)-infected patients: effects of supplementation with selenium or beta-carotene. Am J Clin Nutr 1996;64:101–7.10.1093/ajcn/64.1.101Search in Google Scholar
30. Navarro J, Obrador E, Pellicer JA, Asensi M, Viña J, Estrela JM. Blood glutathione as an index of radiation-induced oxidative stress in mice and humans. Free Radic Biol Med 1997;22: 1203–9.10.1016/S0891-5849(96)00554-0Search in Google Scholar
31. Spickett CM, Reglinski J, Smith WE, Wilson R, Walker JJ, McKillop J. Erythrocyte glutathione balance and membrane stability during preeclampsia. Free Radic Biol Med 1998;24: 1049–55.10.1016/S0891-5849(97)00362-6Search in Google Scholar
32. Samiec PS, Drews-Botsch C, Flagg EW, Kurtz JC, Sternberg Jr P, Reed RL, et al. Glutathione in human plasma: decline in association with aging, age-related macular degeneration, and diabetes. Free Radic Biol Med 1998;24:699–704.10.1016/S0891-5849(97)00286-4Search in Google Scholar
33. Lutchmansingh FK, Hsu JW, Bennett FI, Badaloo AV, McFarlane-Anderson N, Gordon-Strachan GM, et al. Glutathione metabolism in type 2 diabetes and its relationship with microvascular complications and glycemia. PLoS One 2018;13:e0198626.10.1371/journal.pone.0198626Search in Google Scholar PubMed PubMed Central
34. Sampathkumar R, Balasubramanyam M, Sudarslal S, Rema M, Mohan V, Balaram P. Increased glutathionylated hemoglobin (HbSSG) in type 2 diabetes subjects with microangiopathy. Clin Biochem 2005;38:892–9.10.1016/j.clinbiochem.2005.06.009Search in Google Scholar PubMed
35. De Mattia G, Bravi M, Laurenti O, Cassone-Faldetta M, Proietti A, De Luca O, et al. Reduction of oxidative stress by oral N-acetyl-L-cysteine treatment decreases plasma soluble vascular cell adhesion molecule-1 concentrations in non-obese, non-dyslipidaemic, normotensive, patients with non-insulin-dependent diabetes. Diabetologia 1998;41:1392–6.10.1007/s001250051082Search in Google Scholar PubMed
©2019 Walter de Gruyter GmbH, Berlin/Boston
This article is distributed under the terms of the Creative Commons Attribution Non-Commercial License, which permits unrestricted non-commercial use, distribution, and reproduction in any medium, provided the original work is properly cited.
Articles in the same Issue
- Frontmatter
- Laboratory Management
- Recommended changes of the current version of the German Rili-BAEK
- Analysis of a 6-year pilot external quality assurance survey of free light chain using Sigma metrics
- Allergy and Autoimmunity
- Different vitamin D status in common multiorgan autoimmune disease patients
- Investigation of the dual cascade algorithm in the diagnosis of antinuclear antibodies
- Neurology Laboratory
- Ischemia-modified albumin (IMA) and dynamic thiol-disulfide homeostasis in patients with postherpetic neuralgia
- Endocrinology
- Effect of hemoglobin F and A2 on hemoglobin A1c determined by cation exchange high-performance liquid chromatography
- Original Article
- A colorimetric method to measure oxidized, reduced and total glutathione levels in erythrocytes
- Short Communication
- Sparing the control arm using well-characterized diagnostic approaches – the Gart and Buck prevalence estimator for efficacy estimation in single-arm trials
- Letter to the Editor
- Ambiguous pharmacogenetic genotyping results in a patient with bone marrow transplantation