Evaluation of the analytical performance of the Beckman Coulter Unicel DXI 800 Access Total 25(OH) Vitamin D immunoassay
-
Canan Topçuoğlu
 ,
Sevilay Sezer
,
Sevilay Sezer

Abstract
Background
As vitamin D has recently been implicated in various diseases, vitamin D testing has gained a lot more significance. Vitamin D deficiency is quite prevalent, and detection of this condition is important. Several manufacturers have developed new automated immunoassays for this purpose. In this study, we aimed to evaluate the analytical performance of the Access Total 25(OH) Vitamin D immunoassay on the Beckman Coulter Unicel DXI 800 analyzer, through comparison with the reference method, liquid chromatography/tandem mass spectrometry (LC-MS/MS).
Methods
The study was conducted with 148 patient samples which were sent to Ankara Numune Training and Research Hospital for routine vitamin D testing. Every sample was analyzed with both Unicel DXI 800 immunoassay analyzer and LC-MS/MS. The concordance of the results was evaluated with Passing-Bablok regression analysis and Bland-Altman plot. Additionally, imprecision, interference, limit of blank (LOB), recovery, linearity and carry-over studies were performed for the Beckman Coulter Unicel DXI 800 analyzer.
Results
When compared to LC-MS/MS, the Access Total 25(OH) Vitamin D immunoassay on the Beckman Coulter Unicel DXI 800 analyzer had an R-value of 0.957 (intercept: −3.938, slope: 1.185) and a mean bias of 9.5%. The concordance correlation coefficient (CCC) between the two methods was 0.916. The intra-assay, inter-assay and total coefficient of variation (CV%) for the Unicel DXI 800 vitamin D immunoassay were 3.3%, 5.3% and 8.3%, respectively, at 31.7 ng/mL concentration, and 2.1%, 3.2% and 7%, respectively, at 66.8 ng/mL concentration.
Conclusions
The Access Total 25(OH) Vitamin D immunoassay method has acceptable analytical performance, and the results are in concordance with the LC-MS/MS results.
Introduction
Vitamin D is a prohormone that plays a key role in bone and mineral metabolism, and it is also essential for maintenance of health [1]. Studies have shown that besides its role in bone and mineral metabolism, vitamin D is also implicated in various extra-skeletal disorders such as cardiovascular diseases, cancers, diabetes mellitus, infectious and autoimmune diseases [2, 3]. Vitamin D has two main forms: the plant-originated ergocalciferol (vitamin D2) and the animal-originated cholecalciferol (vitamin D3), which is produced endogenously upon exposure to ultraviolet B (UVB) light. Vitamin D is hydroxylated twice in the body to form the biologically active 1,25(OH)2 vitamin D, or calcitriol [4]. Vitamin D is mainly stored in the adipose tissue. In circulation, it is bound to vitamin D-binding globulins and albumin. The half-life of 25(OH) vitamin D is 2–3 weeks, whereas the half-life of 1,25(OH)2 vitamin D is 5–6 h. Therefore, the principal form of vitamin D found in the serum is 25(OH) vitamin D, and it is the best indicator of circulating vitamin D levels [5, 6]. In vitamin D deficiency, 1,25(OH)2 vitamin D levels may be high, normal or low. As 1,25(OH)2 vitamin D has a short life and its serum levels show circadian change, 1,25(OH)2 vitamin D is not appropriate to assess circulating vitamin D levels [7, 8]. This led to the increasing significance of 25(OH) vitamin D measurement in laboratory examinations. Total vitamin D (25(OH)D2 and 25(OH)D3) measurement is important in terms of accurate assessment of vitamin D state [1]. Vitamin D measurement poses some challenges due to the hydrophobic nature of the molecule and its binding to proteins with a high affinity [9, 10]. Regardless of the method type, all analytic procedures start with the unbinding of vitamin D from proteins. Differences between various methods depend on how this step is employed and how the unbound vitamin is measured [11]. Serum 25(OH) vitamin D measurement methods include high-performance liquid chromatography (HPLC) and tandem mass spectrometry (MS/MS), radioimmunoassay (RIA), enzyme immunoassay, competitive protein binding assays, automated competitive protein binding assays and chemiluminescence immunoassays [7].
In our study, we aimed to evaluate the analytical performance of the Access Total 25(OH) Vitamin D immunoassay on the Beckman Coulter Unicel DXI 800 analyzer, through comparison with the reference method, liquid chromatography/tandem mass spectrometry (LC-MS/MS).
Materials and methods
Study design
The study was conducted with 148 patient samples with either low, normal or high vitamin D levels, which were sent to Ankara Numune Training and Research Hospital for routine vitamin D testing. Every sample was aliquoted following centrifugation at 2000 g for 15 min and stored at −80°C until the time of analysis. For every sample, vitamin D level was analyzed with both Beckman Coulter Access Total 25(OH) Vitamin D assay on the Unicel DXI 800 analyzer and LC-MS/MS.
Imprecision, interference, limit of blank (LOB), recovery, linearity and carry-over studies were performed for the Beckman Coulter Unicel DXI 800 analyzer.
Analytic method
The Access Total 25(OH) Vitamin D assay is a two-step competitive binding immunoenzymatic assay using sheep monoclonal anti-25(OH) vitamin D antibodies. Initially, 25(OH) vitamin D is removed from the vitamin D-binding protein (DBP) and bound to the immobilized monoclonal anti-25(OH) vitamin D in the solid phase. Subsequently, a 25(OH) vitamin D analog-alkaline phosphatase conjugate is added which competes for binding to the immobilized monoclonal anti-25(OH) vitamin D. After a second incubation, materials bound to the solid phase are held in a magnetic field while unbound materials are washed away. Then, the chemiluminescent substrate Lumi-Phos* 530 is added to the vessel and light generated by the reaction is measured using a luminometer. The light production is inversely proportional to the concentration of 25(OH) vitamin D in the sample. The amount of analyte in the sample is determined from a stored, multi-point calibration curve.
The measurand (analyte) in the Access Total 25(OH) Vitamin D calibrators is traceable to a Joint Committee for Traceability in Laboratory Medicine (JCTLM)-approved isotope dilution mass spectrometry (ID-LC-MS/MS) reference measurement procedure (RMP) developed at Ghent University.
Reference method: LC-MS/MS
An AB Sciex API 3200 triple quadropol mass spectrometer connected to a Shimatzu HPLC (Kyoto, Japan) system was used. In HPLC column (Phenomenex, CA, USA) mobile phase A was water, and mobile phase B consisted of 0.1% formic acid in acetonitrile. For sample preparation step, 200 μL serum (calibrator, control, or patient samples) and 75 μL internal standard were pipetted to a standard microcentrifuge tube. Upon addition of 1000 μL acetonitrile, the mixture was vortexed for 30 s, and incubated at +4°C for 10 min. Then, the mixture was centrifuged at 20,000 g for 5 min. The supernatant was transferred to a clean tube and evaporated to dryness with nitrogen. Then, the samples were reconstituted in 100 μL of 50% acetonitrile and vortexed. Fifty microliters of the sample was injected to the HPLC system. The HPLC system had a flow rate of 0.3 mL/min. The API 3200 system was employed in the electrospray mode. Using a multiple reaction monitor, mass/charge spectra of the samples were determined. The following m/z parameters were obtained: 25(OH)D3: 383.4/211.1; 25(OH)D2: 395.4/209.1; and IS: 407.2/389.4.
Precision, linearity, carry-over, interference, recovery and method comparison studies were carried out in accordance with the Clinical & Laboratory Standards Institute (CLSI) protocol.
Imprecision
Precision studies were performed with two levels of pooled serum samples. For intra-assay precision study, each level of the samples was analyzed in 10 replicates in a single run. The low and high serum pool specimens were measured as 5×2 in a single day for the inter-assay precision study. For between-day precision study, each level of the samples was run in duplicate, with two runs per day, over 5 days (first run in the morning and second run in the afternoon). The intra-assay, inter-assay, between-day and total coefficient of variation (CV%) values were calculated in accordance with the EP 5A protocol. Acceptable CV% values were determined as ≤10% [12, 13].
Limit of blank (LOB) and linearity
For determination of LOB, zero concentration calibrator provided by the manufacturer was run in 10 replicates, and the lowest concentration calibrator other than the zero calibrator was run in three replicates. LOB, limit of detection (LOD) and limit of quantitation (LOQ) were calculated according to the following formulas:
The linearity study was performed by diluting high patient serum pool with low patient serum pool. For this purpose, high serum pools and low serum pools were mixed in the proportions of 1:3, 1:1 and 3:1; thus, five samples were obtained. Acceptable recovery was determined as ±15% of the target value [12].
Recovery
For recovery analysis, serum samples with low and high concentrations were mixed in the proportions of 1:3, 1:1 and 3:1, or 1:2, 1:1 and 2:1 [14].
Interference
Interference analysis was performed in accordance with CLSI [12, 15]. Interfering substances (hemolysate, bilirubin and intralipid) at three different concentrations were added to the pooled serum samples and they were run in duplicates. The following formula was used: ([Interferer-added] – [interferer-not added])/interferer-not added*100. More than 10% deviation from the target concentration was accepted as clinically meaningful.
Carry-over
A serum sample with high vitamin D concentration (191.14 ng/mL; HC sample) was aliquoted to 10 portions; and another serum sample with low vitamin D concentration (15.39 ng/mL; LC sample) was aliquoted to 11 portions, in order to obtain 21 separate samples in total. These 21 samples were tested in a single run as in the following sequence: 3 LC, 2 HC, 1 LC, 2 HC, 4 LC, 2 HC, 1 LC, 2 HC, 1 LC, 2 HC and 1 LC sample. The average measurement result of the LC samples tested after an LC sample was subtracted from the average measurement result of the LC samples tested after a HC sample in order to determine the limit of error. The limit of error was accepted in case it was lower than 3 times the standard deviation (SD) of the measurement results of LC samples tested after an LC sample [13].
Method comparison
Totally 148 patient samples with either low, normal or high concentrations of vitamin D (48 samples with vitamin D concentrations of <30 ng/mL; 60 samples with vitamin D concentrations of 30–100 ng/mL; and 40 samples with vitamin D concentrations of >100 ng/mL) were analyzed with the Access Total 25(OH) Vitamin D immunoassay on the Beckman Coulter Unicel DXI 800 analyzer, and then with the gold standard method, LC-MS/MS, in an accredited laboratory. The results were compared statistically.
Statistical analysis
Statistical analysis was performed using SPSS software (version 17.0 SPSS Inc., Chicago, IL, USA) and MedCalc Statistics software (version 12.0 MedCalc software, Mariakerke, Belgium). The concordance of the results was evaluated with Passing-Bablok regression analysis and Bland-Altman plot. The concordance correlation coefficient (CCC) was calculated. CCC>0.99 denotes excellent agreement; CCC between 0.95 and 0.99 denotes substantial agreement, CCC between 0.90 and 0.95 denotes moderate agreement and CCC<0.90 denotes poor agreement.
Results
Repeatability
The intra-assay, inter-assay and total CV% were 3.3%, 5.3%, and 8.3%, respectively, for 31.7 ng/mL concentration, and 2.1%, 3.2%, and 7%, respectively, for 66.8 ng/mL concentration (Table 1).
Repeatability results for the Access Total 25(OH) Vitamin D immunoassay on Unicel DXI 800.
| Level | Mean, ng/mL | Intra-assay CV% | Inter-assay CV% | Total CV% |
|---|---|---|---|---|
| Level 1 | 31.7 | 3.3 | 5.3 | 8.3 |
| Level 2 | 66.8 | 2.1 | 3.2 | 7 |
Limit of blank
The LOB for the Access Total 25(OH) Vitamin D immunoassay was found to be 1.5 ng/mL. The LOB value specified by the manufacturer was <2 ng/mL. The LOD and LOQ values were 2.05 ng/mL and 2.57 ng/mL, respectively.
Linearity
Serum samples obtained by mixing the samples with high and low concentrations of vitamin D in the predefined proportions were analyzed, and the measured 25(OH) vitamin D concentrations were plotted against the expected values to draw the regression line. Accordingly, the linear regression equation was: measured value=expected value*0.979+2.660; correlation coefficient, r=0.998. Maximum bias was calculated as 9.2% for a concentration of 45.4 ng/mL (Table 2 and Figure 1).
Linearity summary.
| Tested range, ng/mL | Maximum bias | Concentration causing bias, ng/dL | Slope | R |
|---|---|---|---|---|
| 5.9–180.4 | 9.2% | 45.4 | 0.979 | 0.998 |
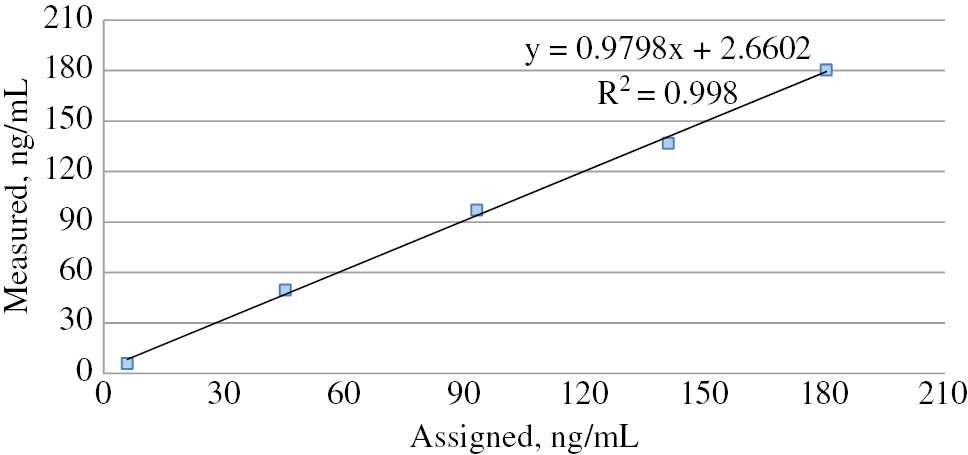
Linearity graph of the Unicel DXI 800 Access Total 25(OH) Vitamin D assay.
Recovery
Serum samples with high and low concentrations of 25(OH) vitamin D were mixed in the proportions of 3:1, 1:1 and 1:3, and 2:1, 1:1 and 1:2. Measured values of 25(OH) vitamin D concentrations in these samples are listed in Table 3 against the expected values. The recovery values obtained varied between 101% and 111%.
Recovery experiment for the Access Total 25(OH) Vitamin D immunoassay.
| Sample | Concentration, ng/mL | Recovery, % | |
|---|---|---|---|
| Expected | Measured | ||
| Sample 1 | |||
| Low | 25.46 | ||
| High | 136.19 | ||
| 3LC:1HC | 53.14 | 53.87 | 101 |
| 1LC:1HC | 80.82 | 86.47 | 107 |
| 1LC:3HC | 108.51 | 110.81 | 102 |
| Sample 2 | |||
| Low | 38.76 | ||
| High | 162.43 | ||
| 2LC:1HC | 79.98 | 88.25 | 110 |
| 1LC:1HC | 100.595 | 111.18 | 111 |
| 1LC:2HC | 121.20 | 128.35 | 106 |
Carry-over
The difference between the average of low-level results tested following low-level samples and the average of low-level results tested following high level samples was 0.724. The limit of error, which is 3 times the value of SD of low-level results, was 6.59.
Interference
In interference study, the presence of hemoglobin at 400 mg/dL, bilirubin at 18 mg/dL and intralipid at 428 mg/dL concentrations in the serum resulted in greater than 10% bias in the results (Table 4).
Concentration that caused greater than 10% bias.
| Hemoglobin, mg/dL | Icterus, mg/dL | Lipid, mg/dL | |
|---|---|---|---|
| Our results | 400 | 18 | 428 (intralipid) |
| Specified by the manufacturer | 50 | 40 | 3280 (glyceryl triolate) |
Method comparison
Compared to the LC-MS/MS method, the Access Total 25(OH) Vitamin D immunoassay on the Beckman Coulter Unicel DXI 800 analyzer demonstrated an R-value of 0.957 (intercept: −3.938 (−6.740–[−0.226]), slope: 1.185 [1.124–1.251]) and a mean bias of 9.5%. The CCC between the two methods was 0.916 (Table 5, Figures 2 and 3).
Passing-Bablok regression analysis.
| Slope (95% CI) | Intercept (95% CI) | R |
|---|---|---|
| 1.185 (1.124–1.251) | −3.938 (−6.740–[−0.226]) | 0.957 |
CI, confidence interval.
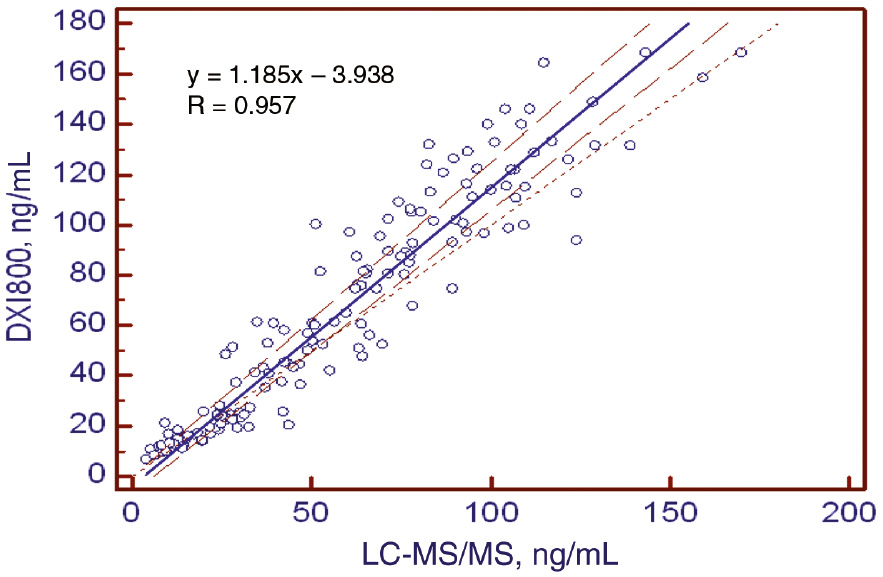
Passing-Bablok regression analysis of the Unicel DXI 800 Access Total 25(OH) Vitamin D assay compared to LC-MS/MS methods.
Solid line, regression; dashed lines, 95% confidence intervals.
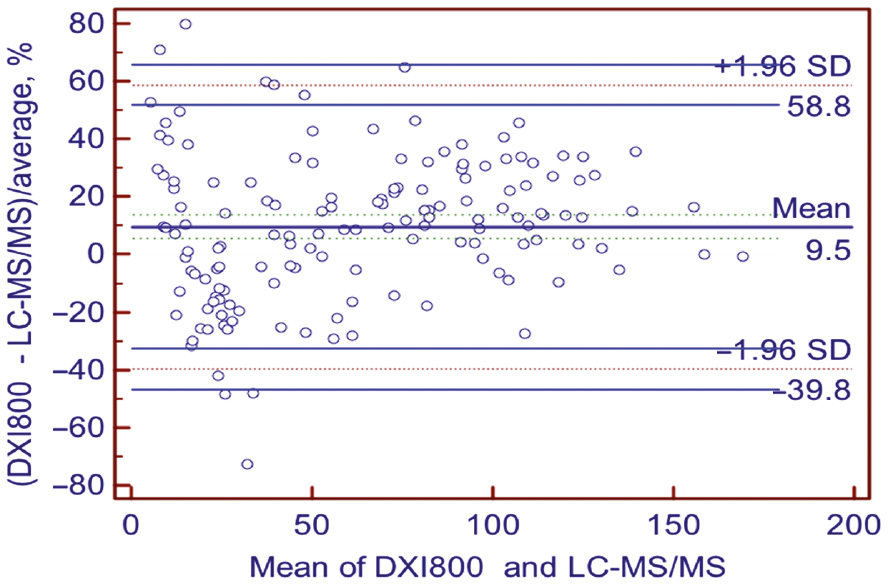
Bland-Altman %bias of the Unicel DXI 800 Access Total 25(OH) Vitamin D assay compared to LC-MS/MS method.
Solid lines indicate average %bias. Dashed lines demonstrate the 95% limits of agreement (bias ±1.96 SD).
A concordance according to the percentage of patients classified in the same group with both methods, we found this rate between the Access Total 25(OH) Vitamin D immunoassay and LC-MS/MS to be 75%.
Discussion
Besides its key role in calcium and bone metabolism, vitamin D has also been implicated in various extra-skeletal disorders such as cardiovascular diseases, cancers and autoimmune diseases, and its deficiency is quite common. This led to a dramatic increase in vitamin D test requests over the years. Total 25(OH) vitamin D measurement is the best indicator of circulating vitamin D levels. The Beckman Coulter Access Total 25(OH) Vitamin D immunoassay is a recently developed chemiluminescence immunoassay.
In this study, we evaluated the analytical performance of the Access Total 25(OH) Vitamin D immunoassay on the Unicel DXI 800 analyzer, and examined the concordance with the reference method, LC-MS/MS.
Four different approaches to acceptable performance criteria for 25(OH)D assay have been explained by Stöckl et al. [16]. One of the models that gave the most stringent target and its recommendations for routine assays were imprecision ≤10% CV and bias ≤5%. We used the same imprecision and bias criteria recommendations by Stöckl et al. for evaluation of the results. According to this criterion, we found that the precision of the Access Total 25(OH) Vitamin D assay is quite good (total CV% was 8.3% and 7%, respectively, for 31.7 ng/mL and 66.8 ng/mL concentrations). We employed the 5% proposed by Stöckl et al. for bias criteria, and the Access Total 25(OH)D assay showed excellent bias proficiency testing programs (our vitamin D result was 21.8 ng/mL, the mean of the group was 22.79 ng/mL and %bias was 4.2% in the RIQAS Immunoassay Speciality 1 Programme).
There are studies that evaluated the analytical performance of the Access Total 25(OH) Vitamin D immunoassay on the Unicel DXI 800 analyzer [12, 13]. Furthermore, in the study by Wyness and Straseski for linearity, the maximum bias was observed at a lower concentration (5.7 ng/mL), and the bias was lower than what we found in our study (7% vs. 9.5%). In our study, we observed that the presence of hemoglobin at 400 mg/dL concentration resulted in clinically significant bias in 25(OH) vitamin D measurement. Similarly, the previous study showed that thepresence of hemoglobin at concentrations >400 mg/dL caused clinically significant bias, and this level is greater than what is specified by the manufacturer (50 mg/dL). However, the concentration of bilirubin which caused clinically significant bias was lower in our study compared to the study by Wyness and Straseski. We found that bilirubin caused significant interference at 18 mg/dL, whereas the level specified by the manufacturer is 40 mg/dL,and this level is found to be >45 mg/dL in the previous study. Similarly, lipid concentration which caused clinically significant bias was lower in our study compared to other studies. This level was found to be 428 mg/dL for intralipid in our study, 630 mg/dL for intralipid in the study by Wyness and Straseski and a level of 3280 mg/dL was specified by the manufacturer for glyceryl triolate [12].
For carry-over, the limit of error value that we found in our study was similar to that in the study by Ozcan et al. They found a bias of −0.382, whereas in our study, it was −0.724, which was smaller than the limit of error [13].
We observed that the Access Total 25(OH) Vitamin D immunoassay had moderately concordant results with the reference method, LC-MS/MS. We calculated an R-value of 0.957 with a mean bias of 9.5%. The inter-method CCC was acceptable (CCC 0.916). In their study comparing the Access Total 25 (OH) Vitamin D immunoassay with LC-MS/MS, Wyness and Straseski found an R-value of 0.93 with a mean bias of −3.2% [12]. Another study comparing the Access Total 25 (OH) vitamin D immunoassay with LC-MS/MS found an R-value of 0.944 with a mean bias of −2.9% [13]. Although our bias was higher than that in other studies, it was acceptable according to bias criterion of 15.8%, which is based on biological variation and has been used previously [12].
Cavalier et al. used concordance tables in order to evaluate the concordance between immunoassay methods and LC-MS/MS. Accordingly, they grouped the patients based on their vitamin D levels as <20 ng/mL, 20–30 ng/mL, 30–80 ng/mL and >80 ng/mL. Then, they created a concordance table according to the percentage of patients classified in the same group with both methods. They found this ratio for immunoassay methods and LC-MS/MS between 62 and 82% [6]. In our study, we found this percentage between the Access Total 25(OH) Vitamin D immunoassay and LC-MS/MS to be 75%.
Conclusions
We found that the Access Total 25 (OH) Vitamin D immunoassay on the Beckman Coulter DXI 800 analyzer has a good analytical performance and moderately concordant results with the reference method, LC-MS/MS. Because the LC-MS/MS method is not commonly available, the Access Total 25(OH) Vitamin D immunoassay may be a preferable choice.
Author contributions: All the authors have accepted responsibility for the entire content of this submitted manuscript and approved submission.
Research funding: None declared.
Employment or leadership: None declared.
Honorarium: None declared.
Competing interests: The funding organization(s) played no role in the study design; in the collection, analysis, and interpretation of data; in the writing of the report; or in the decision to submit the report for publication.
References
1. Hsu SA, Soldo J, Gupta M. Evaluation of two automated immunoassays for 25-OH vitamin D: comparison against LC-MS/MS. J Steroid Biochem Mol Biol 2013;136:139–45.10.1016/j.jsbmb.2012.11.005Suche in Google Scholar PubMed
2. Holick MF, Binkley NC, Bischoff-Ferrari HA, Gordon CM, Hanley DA, Heaney RP, et al. Evaluation, treatment, and prevention of vitamin D deficiency: an Endocrine Society clinical practice guideline. J Clin Endocrinol Metab 2011;96:1911–30.10.1210/jc.2011-0385Suche in Google Scholar PubMed
3. Knudsen CS, Nexo E, Hojskov CS, Heickendorff L. Analytical validation of the Roche 25-OH Vitamin D Total assay. Clin Chem Lab Med 2012;50:1965–8.10.1515/cclm-2011-0964Suche in Google Scholar PubMed
4. Cavalier E, Carlisi A, Bekaert AC, Rousselle O, Chapelle JP, Souberbielle JC. Analytical evaluation of the new Abbott Architect 25-OH vitamin D assay. Clin Biochem 2012;45:505–8.10.1016/j.clinbiochem.2012.01.021Suche in Google Scholar PubMed
5. Koivula MK, Turpeinen U, Laitinen P, Risteli J. Comparison of automated 25-OH vitamin D immunoassays with liquid chromatography isotope dilution tandem mass spectrometry. Clin Lab 2012;58:1253–61.Suche in Google Scholar PubMed
6. Cavalier E, Rousselle O, Ferrante N, Carlisi A, Le Goff C, Souberbielle JC. Technical and clinical evaluation of the VITROS® Immunodiagnostic Products 25-OH Vitamin D Total Assay – comparison with marketed automated immunoassays and a liquid chromatography-tandem mass spectrometry method. Clin Chem Lab Med 2013;51:1983–9.10.1515/cclm-2013-0138Suche in Google Scholar PubMed
7. Denimal D, Ducros V, Dupre T, Dousset B, Meunier C, Aho S, et al. Agreement of seven 25-hydroxy vitamin D(3) immunoassays and three high performance liquid chromatography methods with liquid chromatography tandem mass spectrometry. Clin Chem Lab Med 2014;52:511–20.10.1515/cclm-2013-0434Suche in Google Scholar PubMed
8. Bianchi S, Maffei S, Prontera C, Battaglia D, Vassalle C. Preanalytical, analytical (DiaSorin LIAISON) and clinical variables potentially affecting the 25-OH vitamin D estimation. Clin Biochem 2012;45:1652–7.10.1016/j.clinbiochem.2012.08.003Suche in Google Scholar PubMed
9. Chen Y, Kinney L, Bozovic A, Smith H, Tarr H, Diamandis EP, et al. Performance evaluation of Siemens ADVIA Centaur and Roche MODULAR Analytics E170 Total 25-OH Vitamin D assays. Clin Biochem 2012;45:1485–90.10.1016/j.clinbiochem.2012.06.002Suche in Google Scholar PubMed PubMed Central
10. Cavalier E, Lukas P, Crine Y, Peeters S, Carlisi A, Le Goff C, et al. Evaluation of automated immunoassays for 25(OH)-vitamin D determination in different critical populations before and after standardization of the assays. Clin Chim Acta 2014;431:60–5.10.1016/j.cca.2014.01.026Suche in Google Scholar PubMed
11. Heijboer AC, Blankenstein MA, Kema IP, Buijs MM. Accuracy of 6 routine 25-hydroxyvitamin D assays: influence of vitamin D binding protein concentration. Clin Chem 2012;58:543–8.10.1373/clinchem.2011.176545Suche in Google Scholar PubMed
12. Wyness SP, Straseski JA. Performance characteristics of six automated 25-hydroxyvitamin D assays: mind your 3s and 2s. Clin Biochem 2015;48:1089–96.10.1016/j.clinbiochem.2015.08.005Suche in Google Scholar PubMed
13. Ozcan N, Ucar F, Arzuhal AE, Bulut E, Ozturk A, Taslipinar Yavuz M, et al. Evaluation of the analytical performance of Unicel DXI 800 for the Total 25 (OH) Vitamin D measurements. Clin Biochem 2016;49:486–91.10.1016/j.clinbiochem.2015.11.022Suche in Google Scholar PubMed
14. Ersfeld DL, Rao DS, Body JJ, Sackrison JL, Jr., Miller AB, Parikh N, et al. Analytical and clinical validation of the 25 (OH) vitamin D assay for the LIAISON automated analyzer. Clin Biochem 2004;37:867–74.10.1016/j.clinbiochem.2004.06.006Suche in Google Scholar PubMed
15. CLSI, Interference testing in clinical chemisrty; approved guideline. CLSI document EP07-A2. 2nd ed. Wayne, PA: Clinical and Laborotry Standart Institute, 2005.Suche in Google Scholar
16. Stöckl D, Sluss PM, Thienpont LM. Specifications for trueness and precision of a reference measurement system for serum/plasma 25-hydroxyvitamin D analysis. Clin Chim Acta 2009;408:8–13.10.1016/j.cca.2009.06.027Suche in Google Scholar PubMed
©2018 Walter de Gruyter GmbH, Berlin/Boston
This article is distributed under the terms of the Creative Commons Attribution Non-Commercial License, which permits unrestricted non-commercial use, distribution, and reproduction in any medium, provided the original work is properly cited.
Artikel in diesem Heft
- Frontmatter
- Pediatric Laboratory Medicine
- Mucopolysaccharidosis VI diagnosis by laboratory methods
- Cord blood nucleated red blood cell level: is it a predictive marker for neonatal jaundice?
- Endocrinology
- Protein carbonylation in freshly diagnosed hypothyroidism is independent of thyrotropin levels
- Saliva and serum ghrelin and obestatin in iron deficiency anemia patients
- Point-of-Care-Testing
- The evaluation of point-of-care testing for determining hemoglobin levels in geriatric intensive care patients
- Neurology Laboratory
- Oxidative and nitrosative stress in patients with ischemic stroke
- Original Articles
- Validation of blood counters for quality control of platelet concentrates with high platelet counts
- Evaluation of the analytical performance of the Beckman Coulter Unicel DXI 800 Access Total 25(OH) Vitamin D immunoassay
- Laboratory Case Report
- Green urine – understanding its importance