The differential impact of automated insulin delivery systems on body mass index in children with type 1 diabetes
-
 ,
,


Abstract
Objectives
Automated insulin delivery (AID) improves glycaemic outcomes in children and young people (CYP) with type 1 diabetes (T1D), but effects on body weight are less clear. We evaluated longitudinal changes in BMI z-score following AID initiation and examined predictors using mixed-effects modelling.
Methods
We retrospectively studied 170 CYP with T1D starting AID at a tertiary centre. BMI z-score was assessed at baseline, six, and twelve months. Predictors of six-month BMI change (ΔBMI) included demographic, socioeconomic, and glycaemic variables with sensor-weighted glucose metrics.
Results
Baseline BMI z-score was 0.75 (SD 1.27), rising to 0.90 at six months (p<0.001) and stable at twelve (p=0.851 vs. six). Increases occurred in underweight (+1.12, 95 % CI 0.61–1.62, p<0.001) and below-average healthy weight (+0.38, 95 % CI 0.20–0.57, p<0.001), with minimal change in overweight or obese groups. Mixed-effects modelling identified baseline BMI z-score (B = −0.14, p<0.001), baseline mean blood glucose (MBG; B = +0.07, p<0.001), and their interaction (B = −0.04, p=0.025) as independent predictors. Age, sex, socioeconomic status, ethnicity, therapy type, HbA1c, and sensor wear were not significant. Across groups, AID increased time in range by 15–17 % and reduced HbA1c by 6 mmol/mol without increasing hypoglycaemia.
Conclusions
AID supports weight restoration in underweight CYP while maintaining stability in overweight or obese groups. BMI change is determined by baseline BMI and MBG, independent of demographic or treatment factors.
Introduction
Automated insulin delivery (AID) systems represent a transformative advancement in the management of type 1 diabetes (T1D) in children and young people (CYP). Given the dynamic and unpredictable nature of childhood activity levels and dietary patterns, continuous insulin adjustments without repeated parental or caregiver intervention are essential for maintaining optimal glycaemic control [1]. AID systems integrate real-time continuous glucose monitoring (CGM) with insulin pumps, using algorithm-driven adjustments to automate insulin delivery [2]. Multiple studies and systematic reviews have demonstrated that AID systems significantly enhance glycaemic outcomes, increasing time in range (TIR, 3.9–10.0 mmol/L) whilst reducing hyperglycaemia and hypoglycaemia, and improving the quality of life for both people living with T1D and their caregivers [3], [4], [5]. These benefits have led to their widespread recommendation as the best therapeutic option for CYP with T1D [6], 7].
While the glycaemic benefits of AID therapy are well established, its impact on body weight remains unclear. Real-world data from over five hundred adult users suggest that body mass index (BMI) increases during the first five months of AID therapy [8]. In contrast, for CYP transitioning to AID systems, BMI z-score appears to remain stable in both clinical [9] and real-world settings [10].However, previous analyses have largely relied on univariate assessments, without considering key underlying factors such as baseline BMI status, gender, ethnicity, socioeconomic status (SES), and diabetes duration. Furthermore, historical data from the Diabetes Control and Complications Trial suggests that improvements in glycaemic control are strongly linked to weight gain over time [11]. This raises concerns about a potential increase in obesity-related complications, particularly among individuals at higher risk. Large international paediatric datasets consistently report that advanced diabetes technologies and intensified insulin regimens are associated with increased overweight and obesity prevalence [12], [13], [14]. While prior research suggests that, on average, BMI z-score does not significantly change upon transition to AID therapy [9], unstratified assessments may obscure patterns of BMI redistribution across different BMI categories [15]. Given the widespread adoption of AID systems, it is essential to investigate their real-world impact on BMI with a more comprehensive and nuanced approach. One study examining meal distribution and BMI in children using AID found that while AID improved TIR and increased both meal frequency and insulin use, it had no significant impact on BMI [16]. However, further studies are needed to determine whether AID has differential effects based on individual characteristics.
Following the implementation of a clinically validated hybrid virtual onboarding programme for AID systems in our tertiary centre [17], we set out to evaluate longitudinal changes in BMI z-score over 12 months. This study aims to address the existing knowledge gap by assessing the weight trajectory of CYP using AID, considering key demographic and clinical variables to better understand the real-world effects of these systems on BMI z-score changes.
The primary aim was to assess changes in BMI z-score from baseline to 6 and 12 months after transitioning to AID therapy in children and young people with type 1 diabetes. The secondary aim was to identify predictors of BMI z-score change over six months using a mixed-effects model.
Materials and methods
Study design
This retrospective cohort study was conducted at Birmingham Women’s and Children’s NHS Foundation Trust, a tertiary care centre specialising in paediatric diabetes. Data was collected from CYP with T1D who commenced AID systems between April 2021 and December 2024. The retrospective analysis was conducted according to the STROBE checklist (Supplemental Material).
Study population
Our centre primarily serves a socioeconomically and ethnically diverse population, with 80 % of patients from the two most deprived socioeconomic quintiles and more than half from ethnic minority backgrounds [18]. This contrasts with national demographics, where more than 70 % of the population is white, and less than 50 % falls within the two most deprived quintiles [18]. Specialist care is provided for 285 children and young people with type 1 diabetes, supported by a multidisciplinary team comprising two full time equivalent consultant diabetologists, five paediatric diabetes nurses, two paediatric diabetes dietitians, a psychologist, a family support and a part time social worker and youth worker.
The analysis included CYP with a confirmed diagnosis of T1D (with at least one antibody positive) who met the following inclusion criteria:
Exclusion criteria:
Use of an AID system prior to the study period.
Insufficient CGM data (<50 % capture).
Diagnosis of T1D for less than three months.
Onboarding programmes for CGM and AID systems
Our CGM Academy [19] and AID onboarding programmes [17] have been detailed in previous publications. We have demonstrated effectiveness of the programmes though improved glycaemic metrics. Both programmes prioritise dynamic glucose management and primarily use a virtual hybrid model while retaining a face-to-face option for those who require additional support due to language barrier or other social factors. Dynamic glucose management includes using physical activity to optimise TIR. A key teaching point is that just 15 min of activity can lower glucose levels by approximately 2 mmol/L when above 10 mmol/L between meals [19]. The increasing use and implementation of this taught strategy has demonstrated a strong positive association with TIR [19], 21]. The effectiveness of physical activity has also been demonstrated in a large real-world dataset that includes both adolescents and adults [22].
Data collection
Data was collected at AID initiation (baseline), 6 and 12-months post AID-initiation. Information was extracted from the electronic patient record system (TWINKLE) and included:
Demographics: Age, gender, and ethnicity, based on self-reported data and classified according to the UK Census categories (White, Asian, Black, Mixed, and Other) [23].
Socio-economic status (SES): Determined using the index of multiple deprivation (IMD), which is based on 37 indicators across seven domains. IMD scores range from 1 (most deprived) to 32,844 (least deprived) [24].
Main carer education: Categorised as: No qualifications, 1–4 GCSEs (grades A–C), ≥5 GCSEs (grades A–C), ≥2 A-levels or equivalent, or university degree [23].
Anthropometric data: Height (cm), weight (kg), BMI z-score, calculated using 1990 UK data [25].
BMI z-score groups: Participants were classified into five groups according to their baseline BMI z-score to assess changes in BMI z-score over time. Using the World Health Organisation (WHO) BMI classifications [15] with the healthy weight category split by below and above 0 (50th centile), the predefined thresholds were obese (BMI z-score ≥2), overweight (BMI z-score ≥1 to≤2), healthy weight above average (BMI z-score >0 to<1), healthy weight below average (BMI z-score >−2 to≤0) and underweight (BMI z-score ≤−2) [15].
Disease and treatment specifics: duration of diabetes was captured in years and months. Insulin delivery methods were categorised as multiple daily injections (MDI) or continuous subcutaneous insulin infusion (CSII). The AID systems in use included MiniMed 780G using Guardian 3 and 4 Sensors, CamAPS FX (CAMS) using Dexcom G6 sensors, t:slim X2 with Control IQ (CIQ) using Dexcom G6 sensors, and Omnipod 5 (OP5) using Dexcom G6 sensors.
HbA1c measurements
HbA1c (mmol/mol) readings were obtained at three time points: at initiation of AID (baseline), followed by assessments at 6 and 12 months. These measurements were conducted using the Siemens DCA Vantage point-of-care device, which is aligned with International Federation of Clinical Chemistry (IFCC) reference standards. The device has been shown to closely correspond with laboratory-based HbA1c testing (r=0.99) [26] and has a maximum measurable value of 130 mmol/mol.
Glycaemic metrics
CGM metrics were collected for the 90-days preceding HbA1c measurements at baseline, 6-months and 12-months. Also, for the first 90-days (3-months) post-initiation. Internationally agreed CGM metrics [27] were collected from Dexcom Clarity and Glooko.
Mean blood glucose (MBG, mmol/L).
Time below range level 2 (TBR2): Percentage of time glucose was<3.0 mmol/L.
Time below range (TBR): Percentage of time glucose was<3.9 mmol/L.
Time in tight range (TITR): Percentage of time glucose was 3.9–7.8 mmol/L.
Time in range (TIR): Percentage of time glucose was 3.9–10.0 mmol/L.
Time above range (TAR): Percentage of time glucose was>10.0 mmol/L.
Time above range level 2 (TAR2): Percentage of time glucose was>13.9 mmol/L.
Coefficient of variation (COV %).
Percent sensor use (PSU %).
Daily insulin units
At baseline, 90-day average daily insulin usage for CSII patients were collected from Glooko and Carelink. Similarly, AID system insulin usage at 6 and 12-months was collected from the same platforms. MDI patients self-reported average daily insulin usage for the 90-days prior to starting AID therapy. Insulin units per kilogram (u/kg/day) was calculated for each patient using synchronised weight for all time points.
Weighted averages of 6-months data
To minimise bias in BMI z-score group comparisons, both between and within groups, a weighted average approach was applied to time-dependent glycaemic variables [28]. This method ensured that periods with higher sensor utilisation contributed proportionally more to the overall metric and used the following formula:

The 3-month value and 6-month value refer to the recorded 90-day average CGM at each time point (e.g., MBG, TBR2, TBR, TITR, TIR, TAR, TAR2, COV, PSU). PSU at 3 months and PSU at 6 months represent the percentage of time CGM data were available at each respective time point. This weighting method ensured that periods with greater CGM adherence contributed proportionally more to the final estimate, preventing over-representation of time points with lower data capture. The baseline 90-day CGM metrics were then deducted from 6-month 180-day weighted averages to get the Δ6 month CGM metrics.
Statistical analysis
All statistical analyses were conducted using IBM SPSS Statistics (Version 30), with a significance threshold of p<0.05. Descriptive statistics were used to summarise the cohort, with continuous variables presented as mean (±SD) or median (IQR) depending on distribution, and categorical variables as frequency (%). Comparisons between baseline, six-month, and twelve-month values were performed using ANOVA with Bonferroni post-hoc testing. Within-group comparisons were made using paired t-tests.
To identify predictors of BMI z-score change over six months (ΔBMI z-score), a mixed-effects model with maximum likelihood estimation was employed [29]. This approach was chosen over repeated-measures ANOVA or general linear models because it accounts for the hierarchical, longitudinal structure of the data and individual-level variability. Random intercepts were included to improve within-subject comparisons.
Candidate predictors included demographic (age, sex, ethnicity, socioeconomic status, main carer education), clinical (diabetes duration, therapy type), anthropometric (baseline BMI z-score), and glycaemic variables (baseline HbA1c, MBG, TIR, TAR, and corresponding 6-month Δ values). Variables were screened in univariate analyses (ANOVA, Spearman’s rank), and those significant at p<0.05 were entered into general linear models. Collinearity was assessed using variance inflation factor (VIF), with>5 indicating concern.
The final mixed-effects model retained baseline BMI z-score and baseline MBG, with an interaction term (BMI × MBG) included based on model fit (lower AIC/BIC) and biological plausibility. Effect sizes are reported with regression coefficients (B), 95 % CI, and p-values.
Ethical considerations
The project received approval from the Institutional Audit Committee at Birmingham Women’s and Children’s Hospital (CARMS-31489).
Results
Of the 285 CYP in the service at the time of the study, 180 on AID systems were screened for inclusion. Of those screened, eight were excluded due to a diagnosis under three months and two were excluded for less than 50 % CGM data at baseline.
Baseline characteristics
The cohort included 170 CYP (53 % male) with a mean age of 12.4 years (±3.5), a mean diabetes duration of 5.9 years (±3.7). Most deprived quintile residents constituted 52 % of the cohort. Ethnic distribution was 44 % White, 34 % Asian, 16 % Black, and 6 % Mixed/Other. The distribution of main carer education levels for the cohort was as follows; 30 % of primary caregivers reported having a university degree, 9 % had achieved two or more A-levels or equivalent qualifications, and 19 % had completed five or more GCSEs at grades A–C. Additionally, 21 % of caregivers reported attaining one to four GCSEs at grades A–C, while 22 % had no formal qualifications. The AID systems selected were primarily OP5 (47 %) and CIQ (44 %). The distribution of prior therapy type (MDI vs. pump) was similar across BMI z-score categories, with no significant differences observed.
Total cohort analysis
BMI-z score: baseline to 6 and 12-months post-AID initiation
At baseline, the mean BMI z-score was 0.75 (±1.27), increasing significantly to 0.90 (±1.28) at six months (p<0.001). Between 6 and 12 months, the BMI z-score remained stable at 0.88 (±1.26), which was significantly higher than baseline (p<0.001) but not significantly different from the six-month value (p=0.510) (Table 1). Sub-group analysis therefore focused only on assessing the change in BMI z-score (ΔBMI z-score) from baseline to six months following AID initiation.
Transition outcomes of 170 children and young people with type 1 diabetes from CGM to automated insulin delivery: baseline, 3-, 6-, and 12-month results.
| Baseline (CGM) mean (±SD) |
3 months (AID) mean (±SD) |
6 months (AID) mean (±SD) |
12 months (AID) mean (±SD) |
p-Value | ||
|---|---|---|---|---|---|---|
| Anthropometrics | ||||||
| BMI Z score | Mean (±SD) | 0.75 (±1.27) | b | 0.90 (±1.28)a | 0.88 (±1.26)a | <0.001 |
| Daily insulin: (U/kg/day) (90 days) | Mean (±SD) | 0.89 (±0.27) | b | 0.84 (±0.28) | 0.89 (±0.26) | 0.155 |
| HbA1c, mmol/mol | Mean (±SD) | 61.9 (±10.1) | b | 54.8 (±9.4)a | 55.9 (±9.7)a | <0.001 |
| CGM metrics (90 days) | ||||||
| MBG, mmol/L | Mean (±SD) | 10.7 (±1.7) | 9.1 (±0.9)a | 9.4 (±1.2)a | 9.5 (±1.4)a | <0.001 |
| TBR2%: <3.0 mmol/L | Median (IQR) | 0.4 (±0.8) | 0.4 (±0.8) | 0.4 (±0.7) | 0.4 (±0.7) | 0.938 |
| TBR%: <3.9 mmol/L | Median (IQR) | 2.1 (±2.0) | 2.0 (±1.7) | 1.9 (±1.4) | 1.8 (±1.5) | 0.125 |
| TITR%: 3.9–7.8 mmol/L | Mean (±SD) | 29.0 (±10.5) | 44.1 (±9.4)a | 42.0 (±10.2)a | 40.6 (±10.8)a | <0.001 |
| TIR%: 3.9–10.0 mmol/L | Mean (±SD) | 48.2 (±13.5) | 65.4 (±9.5)a | 63.0 (±11.0)a | 62.1 (±11.7)a | <0.001 |
| TAR%: >10.0 mmol/L | Mean (±SD) | 49.6 (±14.2) | 32.6 (±9.6)a | 35.1 (±11.2)a | 36.1 (±12.1)a | <0.001 |
| TAR2%: >13.9 mmol/L | Mean (±SD) | 23.2 (±13.1) | 11.9 (±7.0)a | 13.5 (±9.4)a | 14.7 (±10.0)a | <0.001 |
| Co-efficient of variation, % | Mean (±SD) | 39.9 (±5.0) | 39.7 (±6.9)a | 39.4 (±4.5)a | 39.0 (±4.5)a | 0.257 |
| Percent sensor use, % | Mean (±SD) | 83 (±15.6) | 90.6 (±7.4)a | 93.3 (±6.9)a | 93.8(±8.6)a | <0.001 |
-
aSignificantly different from baseline at p<0.001 (Bonferroni post-hoc test). bData not available. AID, automated insulin delivery; CGM, continuous glucose monitoring; GMI, glucose management indicator; MBG, mean blood glucose; TBR2, time below range level 2; TBR, time below range; TITR, time in tight range; TIR, time in range; TAR, time above range; TAR2, time above range level 2. Bold detones statistical significance at p < 0.001.
Insulin usage: baseline to 6 and 12-months post-AID initiation
Daily insulin usage per kilogram remained stable throughout the 12 months, with a baseline value of 0.89 u/kg/day (±0.27), decreasing slightly to 0.84 u/kg/day (±0.28) at six months (p=0.155), before returning to 0.89 u/kg/day (±0.26) at twelve months (p=0.155) (Table 1).
Glucose metrics: baseline to 6 and 12-months post-AID initiation
HbA1c reduced from 61.9 mmol/mol (±10.1) to 54.8 mmol/mol (±9.4) at 6-months which was maintained at twelve months (55.9 ± 9.7) (p<0.001). MBG dropped from 10.7 mmol/L (±1.7) to 9.1 mmol/L (±0.9) at three months (p<0.001), sustaining at 9.4 mmol/L (±1.2) and 9.5 mmol/L (±1.4) at 6 and 12 months which remained significantly lower than baseline (p<0.001). TAR significantly decreased from 49.6 % (±14.2) at baseline to 32.6 % (±9.6) at three months (p<0.001), with sustained reductions at six (35.1 % ±11.2, p<0.001) and twelve months (36.1 % ±12.1, p<0.001). Similarly, TAR2 dropped from 23.2 % (±13.1) to 11.9 % (±7.0) at three months (p<0.001), remaining lower at six (13.5 % ±9.4, p<0.001) and twelve months (14.7 % ±10.0, p<0.001). TIR increased from 48.2 % (±13.5) to 65.4 % (±9.5) at three months (p<0.001), with sustained improvements at six (63.0 % ±11.0, 0<0.001) and twelve months (62.1 % ±11.7, p<0.001). TITR also rose from 29.0 % (±10.5) to 44.1 % (±9.4) at three months (p<0.001), and remained elevated at six (42.0 % ±9.4, p<0.001) and twelve (40.6 % ±10.8, p<0.001). In contrast, TBR and TBR2 showed no significant changes, remaining stable of ∼2 % (p=0.125) and ∼0.4 % (p=0.938), respectively. Coefficient of variation (CV) remained largely unchanged (baseline: 39.9 % ±5.0; twelve months: 39.0 % ±4.5, p=0.257) (Table 1).
Sub-group analysis
Baseline BMI z-score groups
Participants were classified into five BMI z-score groups at baseline: obese (n=34), overweight (n=45), healthy weight above average (n=45), healthy weight below average (n=38), and underweight (n=8). At baseline and six months, significant differences were observed in the underweight and healthy weight below average as explained in the subsequent text. (Table 2).
Anthropometric and glycaemic metrics by BMI z-score group before and six months after automated insulin delivery system initiation.
| Obese BMI z-score ≥2 n=34 |
Overweight BMI z-score ≥1 to ≤−2 n=45 |
Healthy weight above average BMI z-score >0 to<1 n=45 |
Healthy weight below average BMI z-score >−2 to≤0 n=38 |
Underweight BMI z-score ≤−2 n=8 |
|||||||||||
|---|---|---|---|---|---|---|---|---|---|---|---|---|---|---|---|
| Characteristics | Before AID Mean (±SD) |
6 months post-AID Mean (±SD) |
p-Value | Before AID mean (±SD) | 6 months post-AID Mean (±SD) |
p-Value | Before AID mean (±SD) | 6 months post-AID Mean (±SD) |
p-Value | Before AID mean (±SD) | 6 months post-AID Mean (±SD) |
p-Value | Before AID mean (±SD) | 6 months post-AID Mean (±SD) |
p-Value |
| Anthropometrics | |||||||||||||||
| BMI Z score | 2.44 (±0.38) | 2.45 (±0.52) | 0.859 | 1.40 (±0.27) | 1.45 (±0.43) | 0.814 | 0.46 (±0.27) | 0.52 (±0.47) | 0.321 | −0.59 (±0.36) | −0.21 (±0.68) | <0.001 | −2.31 (±0.35) | 1.19 (±1.33) | 0.032 |
| Daily insulin, U/kg/day | 0.96 (±0.28) | 0.87 (±0.27) | 0.028 | 0.90 (±0.35) | 0.87 (±0.38) | 0.353 | 0.83 (±0.20) | 0.78 (±0.19) | 0.113 | 0.87 (±0.16) | 0.85 (±0.12) | 0.473 | 1.08 (±0.35) | 0.93 (±0.27) | 0.088 |
| HbA1c, mmol/mol | 62.7 (±10.8) | 55.9 (±8.7) | <0.001 | 62.0 (±9.7) | 55.6 (±10.4) | <0.001 | 61.4 (±10.0) | 54.4 (±7.19) | <0.001 | 60.7 (±10.3) | 52.7 (±6.9) | <0.001 | 64.7 (±9.7) | 55.0 (±7.6) | 0.001 |
| CGM metrics | |||||||||||||||
| MBG, mmol/L | 11.0 (±1.73) | 9.5 (±1.1) | <0.001 | 10.7 (±1.6) | 9.3 (±1.1) | <0.001 | 10.4 (±1.5) | 9.0 (±0.9) | <0.001 | 10.5 (±2.0) | 9.1 (±1.0) | <0.001 | 11.1 (±1.6) | 9.3 (±0.5) | <0.001 |
| TBR2%: <3.0 mmol/L | 0.3 (±0.6) | 0.3 (±0.6) | 0.385 | 0.5 (±0.8) | 0.3 (±0.4) | 0.083 | 0.6 (±0.9) | 0.6 (±0.8) | 0.802 | 0.5 (±1.0) | 0.4 (±0.9) | 0.486 | 0.3 (±0.5) | 0.4 (±0.7) | 0.297 |
| TBR%: <3.9 mmol/L | 1.8 (±1.8) | 1.8 (±1.2) | 0.985 | 2.5 (±2.3) | 1.9 (±1.1) | 0.079 | 2.4 (±1.9) | 2.4 (±1.8) | 0.852 | 2.0 (±2.1) | 1.8 (±1.5) | 0.466 | 1.4 (±0.9) | 1.4 (±0.9) | 0.952 |
| TITR%: 3.9–7.8 mmol/L | 27.5 (±10.5) | 40.9 (±9.7) | <0.001 | 28.2 (±10.5) | 42.1 (±8.9) | <0.001 | 30.7 (±10.3) | 45.2 (±9.9) | <0.001 | 30.6 (±11.4) | 44.3 (±9.3) | <0.001 | 26.0 (±7.9) | 41.5 (±4.6) | <0.001 |
| TIR%: 3.9–10.0 mmol/L | 46.0 (±14.1) | 62.0 (±10.7) | <0.001 | 47.3 (±13.3) | 63.6 (±9.7) | <0.001 | 50.3 (±12.4) | 65.9 (±9.3) | <0.001 | 49.9 (±14.5) | 65.7 (±9.7) | <0.001 | 45.6 (±13.0) | 62.5 (±5.3) | <0.001 |
| TAR%: >10.0 mmol/L | 52.2 (±15.2) | 37.4 (±11.8) | <0.001 | 50.2 (±14.4) | 35.7 (±11.1) | <0.001 | 47.2 (±12.8) | 32.0 (±9.8) | <0.001 | 48.1 (±15.0) | 34.1 (±11.6) | <0.001 | 53.0 (±13.4) | 37.0 (±8.0) | 0.005 |
| TAR2%: >13.9 mmol/L | 25.4 (±14.2) | 14.2 (±8.3) | <0.001 | 23.3 (±12.3) | 12.6 (±8.4) | <0.001 | 32.0 (±9.8) | 21.7 (±12.2) | <0.001 | 23.0 (±14.1) | 11.1 (±7.1) | <0.001 | 23.9 (±12.4) | 12.3 (±3.0) | 0.016 |
| COV, % | 39.7 (±5.0) | 40.2 (±5.1) | 0.604 | 40.9(±5.0) | 40.0 (±9.3) | 0.542 | 39.9 (±5.3) | 39.3 (±4.8) | 0.452 | 39.2 (±4.7) | 39.2 (±5.3) | 0.962 | 37.8 (±5.1) | 38.6 (±2.9) | 0.659 |
| PSU, % | 83.6 (±15.7) | 92.7 (±6.9) | 0.005 | 79.6 (±16.9) | 91.7 (±10.4) | <0.001 | 84.7 (±13.2) | 94.0 (±4.4) | <0.001 | 85.9 (±15.1) | 94.1 (±3.0) | 0.002 | 85.8 (±17.1) | 95.5 (±5.4) | 0.132 |
-
MDI, multiple daily injections; CSII, continuous sub-cutaneous insulin infusion; GCSE, general certificate of secondary education; AID, automated insulin delivery; AutoAID, automated cloud-integrated AID; ManualAID, automated cloud-integrated and algorithm updated AID; 780G, MiniMed 780G system; CAMS, CamAPS Fx; CIQ, t:slim X2 with control IQ (CIQ); OP5, Omnipod 5 system; COV, co-efficient of variation; GMI, glucose management indicator; MBG, mean blood glucose; TBR2, time below range level 2; TBR, time below range; TITR, time in tight range; TIR, time in range; TAR, time above range; TAR2, time above range level 2; PSU, percent sensor use. Bold denotes statistical significance at p < 0.001.
BMI z-score: baseline to 6 months post-AID initiation
BMI z-score changes were minimal among those in the obese group (2.44–2.45, ΔBMI z-score: 0.01, 95 % CI: −0.09 to 0.11, p=0.859), overweight group (1.40–1.45, ΔBMI z-score: 0.05, 95 % CI: −0.05 to 0.16, p=0.814) and in the healthy weight above average group (0.46–0.52, ΔBMI z-score: 0.06, 95 % CI: −0.04 to 0.17, p=0.321). However, participants in the healthy weight below average category showed a significant increase in BMI z-score from −0.59 to −0.21 (ΔBMI z-score: 0.38, 95 % CI: 0.20 to 0.57, p<0.001) whilst the underweight group exhibited the most substantial increase in BMI z-score, rising from −2.31 to −1.19 (ΔBMI z-score: 1.13, 95 % CI: 0.13 to 2.12, p<0.001 Table 2 and Figure 1A).
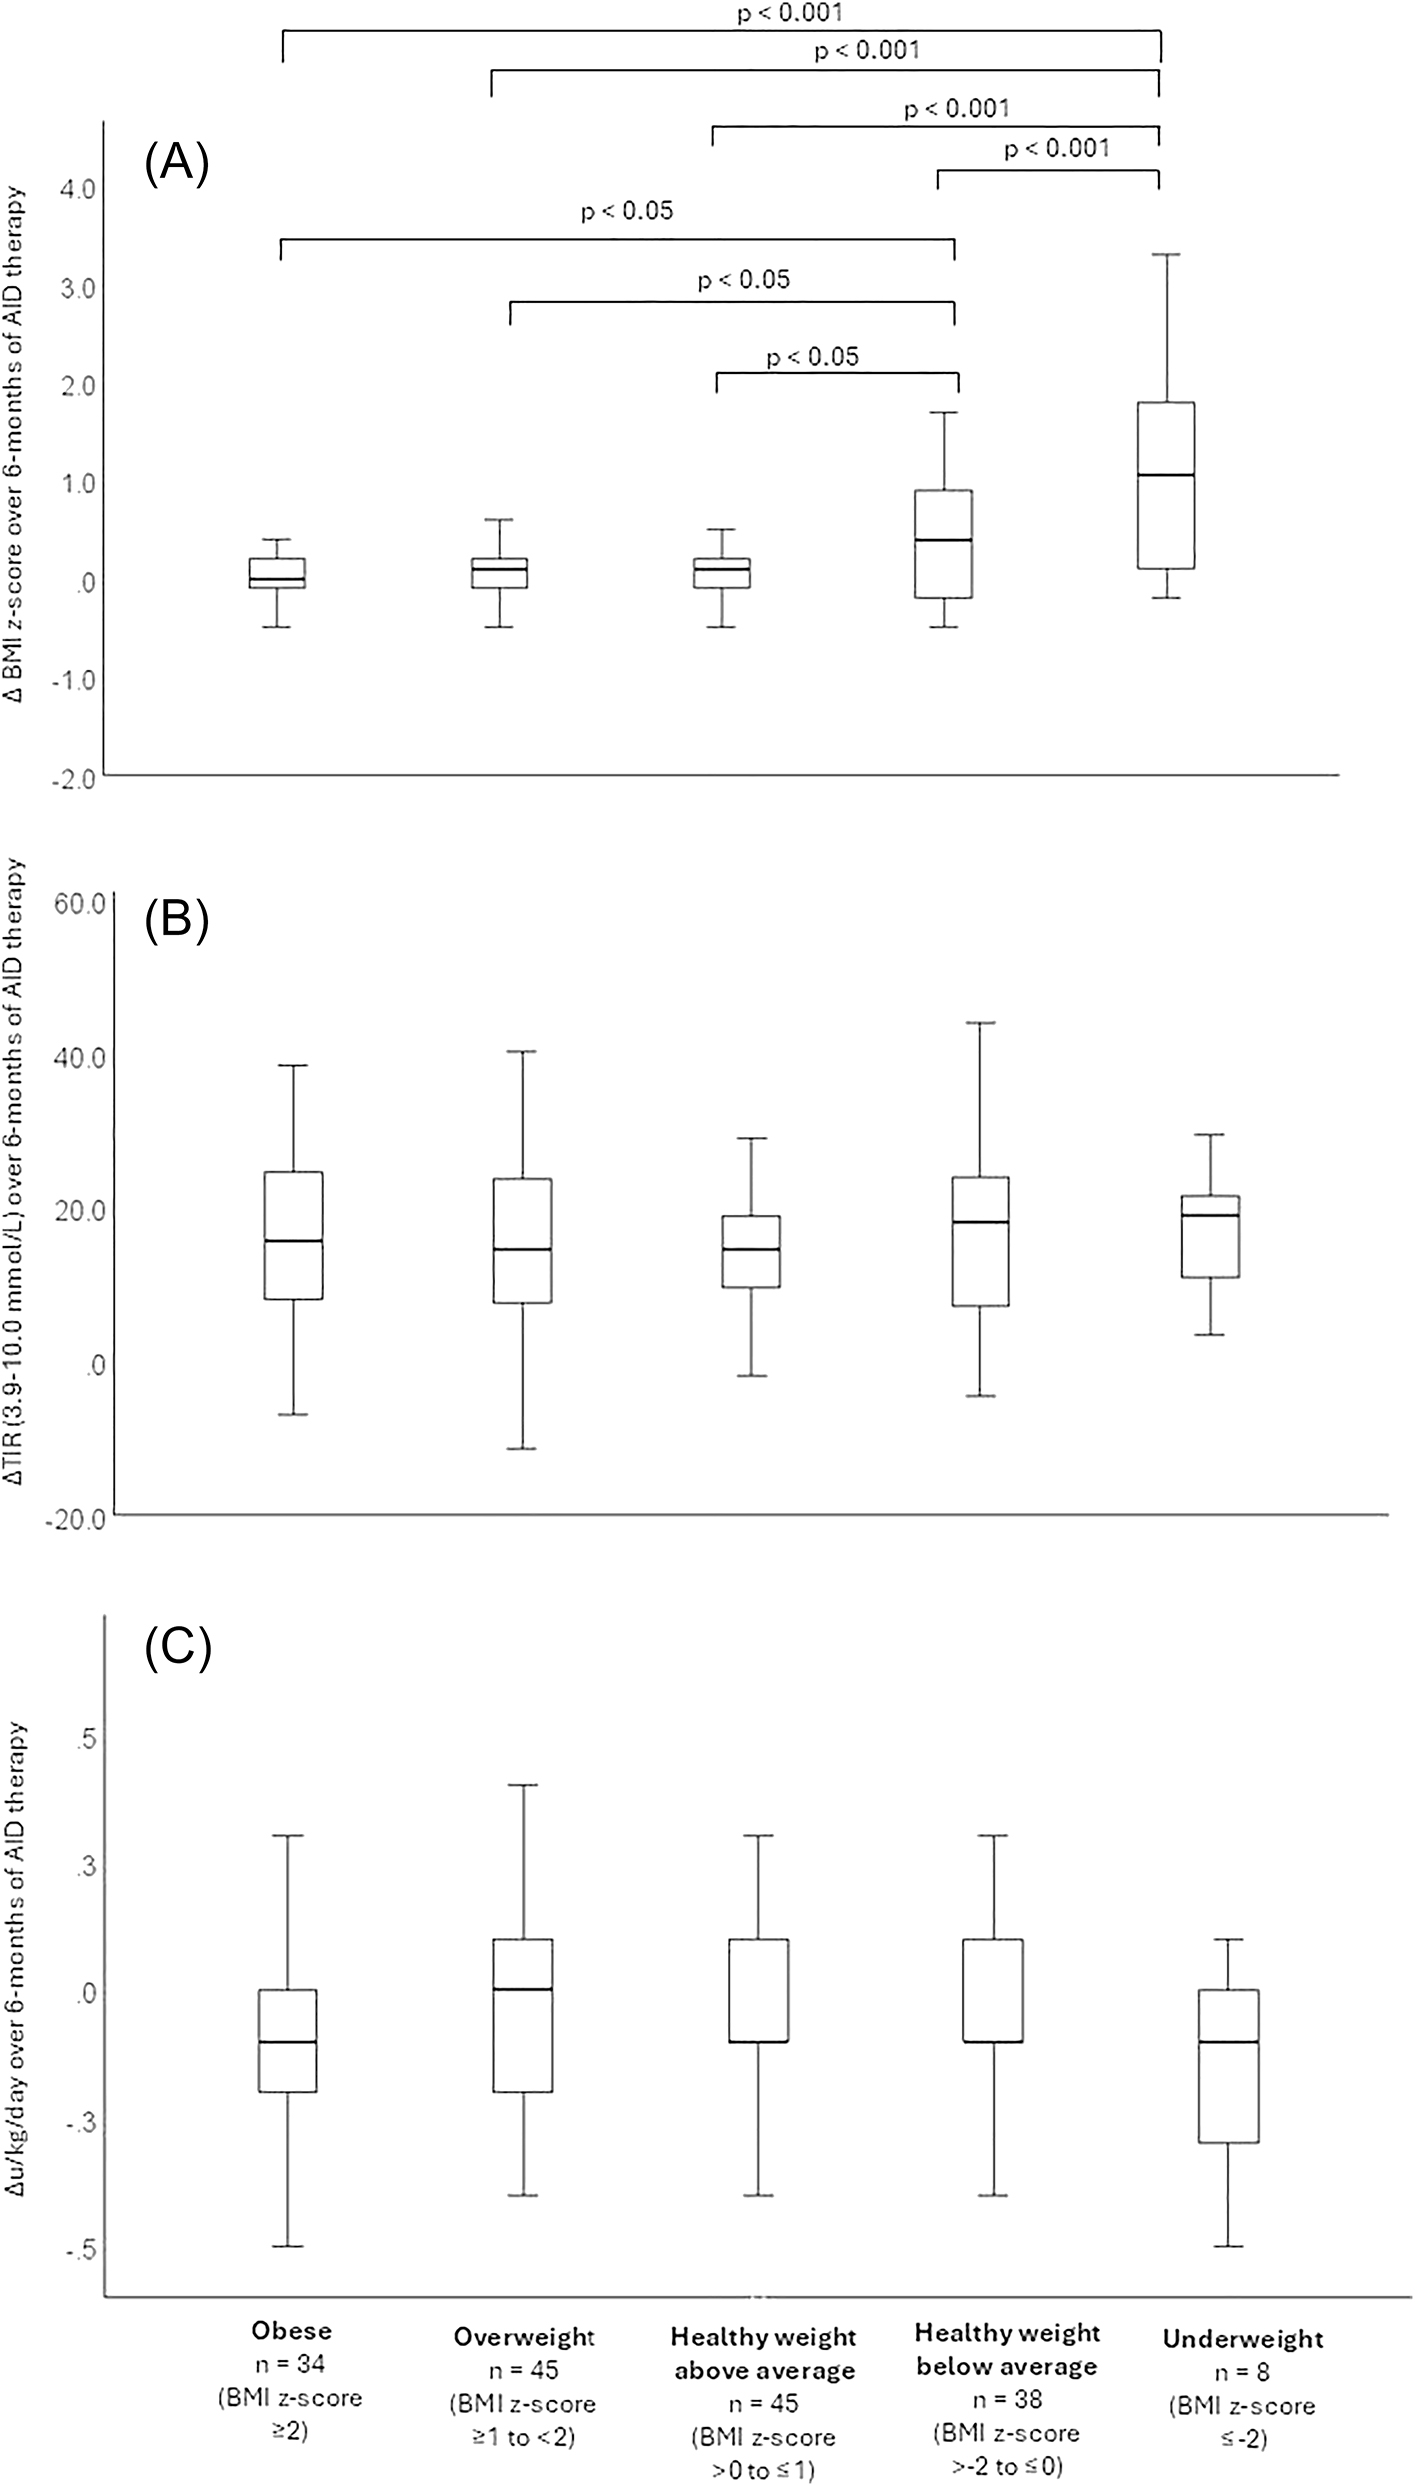
(A) Changes in BMI z-score, (B) change in time in range (3.9–10.0 mmol/L), (C) change in insulin dose (u/kg/day,) over six months of AID therapy by baseline BMI z-score category.
A one-way ANOVA confirmed a significant overall between group effect of baseline BMI z-score on ΔBMI z-score (p<0.001), with post-hoc Bonferroni tests revealing that the underweight group had a significantly greater increase compared to all other groups (p<0.001, Table 3 and Figure 1A). However, no significant differences were observed between the healthy weight above average, overweight, and obese groups (Table 3 and Figure 1A). Furthermore, the healthy weight below average group had a significantly greater increase in ΔBMI z-score compared to all other groups other than the underweight group (p<0.05, Table 4 and Figure 1A).
Comparison of changes in anthropometric and glycaemic metrics between BMI z-score groups from baseline (CGM) to six months post-AID initiation.
| Characteristics | Obese BMI z-score ≥2 n=34 Δ mean (95 % CI) |
Overweight BMI z-score ≥1 to ≤−2 n=45 Δ mean (95 % CI) |
Healthy weight above average BMI z score>0 to<1 n=45 Δ mean (95 % CI) |
Healthy weight below average BMI z-score >−2 to≤0 n=38 Δ mean (95 % CI) |
Underweight BMI z-score ≤−2 n=8 Δ mean (95 % CI) |
p-Value |
|---|---|---|---|---|---|---|
| Anthropometrics | ||||||
| ΔBMI z-score | 0.01 (−0.09 to 0.11) | 0.05 (−0.05 to 0.16) | 0.06 (−0.04 to 0.17) | 0.38 (0.21–0.57)b | 1.13 (0.13–2.12)a | <0.001 |
| ΔDaily insulin:, U/kg/day | 0.09 (−0.17 to −0.01) | −0.03 (−0.09 to 0.03) | −0.05 (−0.11 to 0.01) | −0.02 (−0.8 to 0.4) | −0.15 (−3.3 to 0.03) | 0.373 |
| ΔHbA1c, mmol/mol | −6.8 (−9.8 to −3.7) | −6.4 (−9.3 to −3.4) | −7.1 (−9.7 to −4.4) | −8.0 (5.0–11.0) | −9.8 (−14.3 to −5.2) | 0.845 |
| CGM metrics | ||||||
| ΔMBG, mmol/L | −1.5 (−1.9 to −1.1) | −1.4 (−1.8 to −1.0) | −1.4 (−1.8 to −1.0) | −1.4 (−1.9 to −0.9) | −1.7 (−2.6 to −0.8) | 0.976 |
| ΔTBR2%: <3.0 mmol/L | 0.1 (−0.1 to 0.3) | −0.2 (−0.5 to 0.3) | 0.0 (−0.3 to 0.4) | 0.1 (−0.3 to 0.2) | 0.1 (−0.2 to 0.6) | 0.420 |
| ΔTBR%: <3.9 mmol/L | 0.0 (−0.6 to 0.6) | −0.6 (−1.4 to 0.1) | 0.0 (−0.7 to 0.6) | −0.2 (−0.7 to 0.3) | 0.0 (−0.8 to 0.9) | 0.582 |
| ΔTITR%: 3.9–7.8 mmol/L | 13.4 (10.7–15.9) | 13.9 (10.8–17.0) | 14.5 (10.8–18.2) | 13.7 (10.6–16.9) | 15.5 (11.9–19.0) | 0.978 |
| ΔTIR%: 3.9–10.0 mmol/L | 16.1 (12.5–19.6) | 16.3 (12.8–19.9) | 15.6 (12.0–19.1) | 15.8 (12.0–19.6) | 16.9 (9.9–24.0) | 0.997 |
| ΔTAR%: >10.0 mmol/L | −14.9 (−18.7 to −10.9) | −14.6 (−18.5 to −10.6) | −15.3 (−19.3 to −11.2) | −14.0 (−17.9 to −10.0) | −16.0 (−25.5 to −6.5) | 0.988 |
| ΔTAR2%: >13.9 mmol/L | −11.2 (−14.7 to −7.8) | −10.6 (−13.8 to −7.5) | −10.4 (−13.6 to −7.3) | −11.9 (−15.6 to −8.1) | −11.6 (−20.3 to −2.9) | 0.978 |
| ΔCOV, % | 0.5 (−1.5 to −2.5) | −0.9 (−4.1 to 2.1) | −0.7 (−2.4 to 1.1) | 0.0 (−1.6 to 1.5) | 0.8 (−3.2 to 4.8) | 0.881 |
| ΔPSU, % | 9.1 (3.0–15.2) | 12.3 (7.1–17.6) | 9.4 (−5.6 to 13.2) | 8.2 (3.3–13.2) | 8.9 (−3.4 to 21.3) | 0.794 |
-
MDI, multiple daily injections; CSII, continuous sub-cutaneous insulin infusion; GCSE, general certificate of secondary education; AID, automated insulin delivery; AutoAID, automated cloud-integrated AID; ManualAID, automated cloud-integrated and algorithm updated AID; 780G, MiniMed 780G system; CAMS, CamAPS Fx; CIQ, t:slim X2 with Control IQ (CIQ); OP5, Omnipod 5 system; COV, co-efficient of variation; GMI, glucose management indicator; MBG, mean blood glucose; TBR2, time below range level 2; TBR, time below range; TITR, time in tight range; TIR, time in range; TAR, time above range; TAR2, time above range level 2; PSU, percent sensor use. aUnderweight group is significantly different from all other groups (p < 0.001). bHealthy weight below normal group is significantly different from Healthy weight above normal, overweight, and obese, (p < 0.05). Bold denotes statistical significance at p < 0.001
Final mixed-effects model for BMI z-score change from baseline to six months.
| Predictor | Estimate (B) | Std. Error | 95 % CI lower | 95 % CI upper | df | t-value | p-Value |
|---|---|---|---|---|---|---|---|
| Intercept | −0.47 | 0.22 | −0.90 | −0.04 | 166 | −2.17 | 0.032 |
| Baseline MBG | 0.07 | 0.02 | 0.03 | 0.11 | 166 | 3.43 | <0.001 |
| Baseline BMI z-score | −0.14 | 0.20 | −0.19 | −0.09 | 166 | −5.22 | <0.001 |
| BMI z-score × MBG | −0.04 | 0.02 | −0.07 | 0 | 166 | −2.27 | 0.025 |
Insulin usage: baseline to 6 months post-AID initiation
Daily insulin requirements did not change across BMI z-score groups, except in the obese category, where there was a small but statistically significant decrease from 0.96 to 0.87 u/kg/day (Δu/kg/day: −0.09, 95 % CI: −0.17 to −0.01, p=0.028, Table 3). No significant differences were observed in ΔBMI z-score between groups (Table 3 and Figure 1C).
Glucose metrics: baseline to 6 months post-AID initiation
HbA1c decreased significantly across all BMI z-score groups with ΔHbA1c ranging from −9.8 to −6.8 to (p<0.001) with no between group differences. MBG, TAR, and TAR2 followed a similar trend, with changes between −1.7 and −1.4 mmol/L (p<0.001) for MBG, −16.0 % to −14.0 % (p<0.001) for TAR, and −11.9 % to −10.4 % (p<0.001) for TAR2, all with no differences between groups. In contrast, TITR, TIR and PSU improved across all groups, with TITR increasing by 13.4–15.5 % (p<0.001), TIR by 15.6–16.9 % (p<0.001), and PSU by 8.2–12.3 % (p<0.001 for most groups), again, all with no between group differences. Neither TBR2, TBR nor COV showed any significant changes over six months or differences between groups. Full analysis is detailed in Tables 2 and 4 and illustrated in Figure 1.
Mixed-effects model
In univariate screening, demographic variables including age, sex, ethnicity, socioeconomic status, and main carer education were not associated with change in BMI z-score (all p>0.05). Similarly, diabetes duration, insulin therapy type (MDI vs. CSII), AID system, and glycaemic measures such as baseline or ΔHbA1c, TIR, TAR, and insulin dose were non-significant predictors and excluded from further modelling. Sensor wear duration was not significantly different between prior therapy groups and was not retained as a predictor of BMI change. Baseline BMI z-score and baseline MBG were retained, as both were significant in univariate analyses (p<0.001 for each).
The final mixed-effects model (Table 4) identified baseline BMI z-score (B=−0.14, 95 % CI: −0.19 to −0.09, p<0.001) and baseline MBG (B=+0.07, 95 % CI: 0.03 to 0.11, p<0.001) as independent predictors of BMI z-score change over six months. A significant interaction between baseline BMI z-score and MBG was also observed (B=−0.04, 95 % CI: −0.07 to 0.00, p=0.025), indicating that the effect of glycaemia on BMI change varied by initial BMI status. The model intercept was −0.47 (95 % CI: −0.90 to −0.04, p=0.032).
Model diagnostics confirmed robustness, with improved fit following inclusion of the interaction term (AIC 211 vs. 214; BIC 230 vs. 229). The intraclass correlation coefficient was 0.000, indicating minimal unexplained between-subject variability, and both marginal and conditional R2 values were 0.20. Residual analysis supported assumptions of normality and homoscedasticity. HbA1c was not a significant predictor in either univariate or multivariable models.
Discussion
This study provides new insights into the impact of AID systems on BMI z-score trajectories in children and young people with type 1 diabetes. Consistent with earlier reports [8], 30], we observed stability in BMI for most of the cohort, with increases primarily among those underweight or below the average range at baseline. Importantly, our mixed-effects modelling demonstrated that baseline BMI and mean blood glucose (MBG) were the independent predictors of BMI change, while other demographic and clinical factors, including age, sex, ethnicity, socioeconomic status, carer education, therapy type, and sensor wear, were not significant. This modelling provides a robust explanation for the redistribution effect we observed and addresses the potential confounders raised by reviewers.
These BMI changes occurred in parallel with clinically meaningful improvements in glycaemic outcomes. Across all BMI groups, time in range increased by 15–17 % and HbA1c improved by approximately 6 mmol/mol, sustained at 12 months. Time above range fell substantially, and importantly, there was no increase in hypoglycaemia. These findings are consistent with and extend prior real-world studies of AID confirming that substantial glycaemic benefit is achieved without an accompanying rise in obesity risk [8], 10], 30].
Concerns about weight gain with improved glucose control are longstanding. Historical data from the DCCT demonstrated a uniform link between tighter glucose control and increased weight [11]. More recently, data suggests rising BMI trajectories in young people using intensive insulin regimens and advanced technologies [31]. This reinforces concerns that technology-driven improvements in glycaemia may exacerbate obesity risk. Large international paediatric datasets have further demonstrated that intensified insulin regimens and advanced technologies are associated with increased prevalence of overweight and obesity [12], [13], [14]. Our results refine this narrative by showing that AID acts as a metabolic modulator: underweight or leaner children gain weight appropriately, while overweight or obese children improve glycaemic control without further weight gain.
The interaction between baseline BMI and MBG further clarified the observed pattern: higher MBG predicted greater increases in BMI among those starting with lower BMI z-scores, but this association was attenuated in participants already overweight or obese. This supports a mechanistic explanation in which improved glycaemic control through AID reduces caloric loss via glycosuria in leaner individuals, facilitating weight restoration, while those with higher BMI benefit metabolically without additional weight gain. This nuance contrasts with the uniform effect described in the DCCT [11] and underscores the weight-redistributive rather than weight-promoting nature of AID.
A further strength of this analysis was the use of weighted CGM metrics across the 3- and 6-month follow-up periods. This approach ensured that periods of higher sensor wear contributed proportionally more to the calculation of glycaemic variables, minimising bias from incomplete data. To our knowledge, this method has rarely been applied in paediatric AID studies and represents a novel way of safeguarding against artefacts from variable device adherence. By addressing missingness explicitly, we provide greater confidence that the observed associations reflect true metabolic relationships rather than technical artefacts.
Notably, HbA1c was not retained as a predictor of BMI change in the mixed-effects model. This is consistent with our recent work showing that children and young people of Black heritage have HbA1c values 4–5 mmol/mol higher than White or South Asian peers despite equivalent MBG and time in range, confirming HbA1c is not a reliable surrogate for direct glucose exposure in diverse groups. Direct CGM-derived measures such as MBG are therefore more physiologically relevant [32].
Our findings also speak to concerns regarding subgroup differences. Age and sex were tested and found not to be significant predictors in either univariate or multivariable analyses, addressing the possibility that puberty or sex-specific factors might explain the results. Second, pubertal status was not directly captured, and while age was tested in the model, pubertal staging would have provided more granular insight. Similarly, prior therapy type (multiple daily injections vs. pump therapy) and sensor duration were not associated with BMI change in the model. These null findings provide reassurance that the observed redistribution was not driven by baseline therapy characteristics or CGM exposure but reflects the combined effect of BMI status and glycaemia.
Previous studies have sometimes reported no overall change in BMI following transition to AID [10], 30] but unstratified reporting may have masked important subgroup effects. Supporting this, a study examining meal distribution in children using AID found that while TIR improved and meal frequency increased, BMI did not change overall [16]. By applying stratified analyses and modelling, we highlight redistribution that aligns with physiological need.
Limitations must be acknowledged. First, the underweight subgroup was small (n=8), which reduces the precision of estimates for this group. While the direction and magnitude of effect were consistent, these results should be interpreted cautiously. BMI is a proxy for adiposity and does not distinguish fat from lean mass; future work should include body composition. Finally, diet, physical activity, and eating behaviours were not measured.
Despite these limitations, strengths include longitudinal weighted CGM approach to minimise bias, and inclusion of a large, ethnically diverse, socioeconomically deprived population. A further strength of this analysis was the use of mixed-effects modelling to maximise statistical power in a single-centre cohort. Together, these factors maximise relevance to real-world practice.
From a clinical standpoint, these results provide reassurance. Overweight and obese children can expect improved glucose control without further weight gain, while those underweight or below average can achieve catch-up growth. Taken together, the findings suggest that AID is a weight-redistributive rather than weight-promoting intervention, aligning weight trajectories more closely with physiological need.
These results also have policy implications. The recent NICE technology appraisal mandating national rollout of AID [7] is further supported by our finding that AID improves glucose control and supports healthy weight redistribution without promoting excess gain. This strengthens the case for universal provision, particularly in diverse and socioeconomically deprived cohorts.
Key messages
AID therapy increases BMI z-score in underweight children while maintaining stability in those overweight or obese.
Mixed-effects modelling confirms baseline BMI and mean glucose, not age, sex, HbA1c, or therapy type, predict BMI change.
Weight redistribution occurs alongside a 15–17 % increase in time in range and sustained HbA1c reduction without added hypoglycaemia.
Conclusions
Automated insulin delivery supports healthy weight redistribution in children and young people with type 1 diabetes. Underweight or leaner individuals experience appropriate weight restoration, while those already overweight or obese maintain weight stability. These outcomes occur alongside significant improvements in time in range and HbA1c without increasing hypoglycaemia. Baseline BMI and mean blood glucose, rather than age, sex, or therapy type, predict weight change. Taken together, these findings show that AID systems act as metabolic modulators, improving glycaemic control while aligning weight trajectories with physiological need.
Acknowledgments
We would like to gratefully acknowledge the contribution of the Diabetes Team at Birmingham Women’s and Children’s Hospital for delivery of the AID teaching programmes and the clinicians involved in care delivery. Most importantly, we would like to thank all the CYP with T1D and their families for their feedback on the education approaches.
-
Research ethics: This project was approved as a service development initiative by our institutional audit committee (CARMS-31489), as the data collected complied with national data requirements. Therefore, patient consent was not required. The study was conducted in accordance with the Declaration of Helsinki (as revised in 2013).
-
Informed consent: Not applicable.
-
Author contributions: All authors have accepted responsibility for the entire content of this manuscript and approved its submission. JP: Design, background research, data collection, statistics, manuscript writing. CL: Design, background research, data collection, manuscript writing. AK: Data collection and manuscript review. RD, MK, RK, VS: Manuscript review. SU: Design, statistics, manuscript writing, intellectual revision. All authors were involved in the approval of the final version for publication.
-
Use of Large Language Models, AI and Machine Learning Tools: None declared.
-
Conflict of interest: JP: Advisory Board for Roche and Abbott and speaker payments for Dexcom and Insulet. All other authors state no conflict of interest.
-
Research funding: None declared.
-
Data availability: The datasets generated and analysed during the current study are available from the corresponding author on reasonable request.
References
1. Aiello, EM, Deshpande, S, Özaslan, B, Wolkowicz, KL, Dassau, E, Pinsker, JE, et al.. Review of automated insulin delivery systems for individuals with type 1 diabetes: tailored solutions for subpopulations. Curr Opin Biomed Eng 2021;19. https://doi.org/10.1016/j.cobme.2021.100312.Search in Google Scholar PubMed PubMed Central
2. Moon, SJ, Jung, I, Park, CY. Current advances of artificial pancreas systems: a comprehensive review of the clinical evidence. Diabetes Metab J 2021;45:813–39. https://doi.org/10.4093/dmj.2021.0177.Search in Google Scholar PubMed PubMed Central
3. Zeng, B, Gao, L, Yang, Q, Jia, H, Sun, F. Automated insulin delivery systems in children and adolescents with type 1 diabetes: a systematic review and meta-analysis of outpatient randomized controlled trials. Diabetes Care 2023;46:2300–7. https://doi.org/10.2337/dc23-0504.Search in Google Scholar PubMed PubMed Central
4. Peacock, S, Frizelle, I, Hussain, S. A systematic review of commercial hybrid closed-loop automated insulin delivery systems. Diabetes Ther 2023;14:839–55. https://doi.org/10.1007/s13300-023-01394-5.Search in Google Scholar PubMed PubMed Central
5. Knoll, C, Peacock, S, Wäldchen, M, Cooper, D, Aulakh, SK, Raile, K, et al.. Real-world evidence on clinical outcomes of people with type 1 diabetes using open-source and commercial automated insulin dosing systems: a systematic review. Diabet Med 2022;39:e14741. https://doi.org/10.1111/dme.14741.Search in Google Scholar PubMed
6. Biester, T, Berget, C, Boughton, C, Cudizio, L, Ekhlaspour, L, Hilliard, ME, et al.. ISPAD clinical practice consensus guidelines 2024: diabetes technologies: Insulin delivery. Horm Res Paediatr 2024:1–34.10.1159/000543034Search in Google Scholar PubMed PubMed Central
7. NICE (National Institute for Health and Care Excellence). NICE; 2023. [cited 2023 Dec 19]. Technology appraisal guidance [TA943] Hybrid closed loop systems for managing blood glucose levels in type 1 diabetes. Available from: https://www.nice.org.uk/guidance/ta943.Search in Google Scholar
8. Crabtree, TSJ, Griffin, TP, Yap, YW, Narendran, P, Gallen, G, Furlong, N, et al.. Hybrid closed-loop therapy in adults with type 1 diabetes and above-target HbA1c: a real-world observational study. Diabetes Care [Internet] 2023;46:1831–8. https://doi.org/10.2337/dc23-0635. [cited 2025 Mar 11] Available from: https://pubmed.ncbi.nlm.nih.gov/37566697/.Search in Google Scholar PubMed PubMed Central
9. Passanisi, S, Salzano, G, Bombaci, B, Minuto, N, Bassi, M, Bonfanti, R, et al.. Sustained effectiveness of an advanced hybrid closed-loop system in a cohort of children and adolescents with type 1 diabetes: a 1-Year real-world study. Diabetes Care 2024;47:1084–91. https://doi.org/10.2337/dc23-2311.Search in Google Scholar PubMed
10. Seget, S, Jarosz-Chobot, P, Ochab, A, Polanska, J, Rusak, E, Witoszek, P, et al.. Body mass index, basal insulin and glycemic control in children with type 1 diabetes treated with the advanced hybrid closed loop system remain stable - 1-year prospective, observational, two-center study. Front Endocrinol (Lausanne) [Internet] 2022;13. https://doi.org/10.3389/fendo.2022.1036808. [cited 2025 Jan 31] Available from: https://pubmed.ncbi.nlm.nih.gov/36303875/.Search in Google Scholar PubMed PubMed Central
11. Nathan, DM, Genuth, S, Lachin, J, Cleary, P, Crofford, O, Davis, M, et al., DCCT Research Group. The effect of intensive treatment of diabetes on the development and progression of long-term complications in insulin-dependent diabetes mellitus. N Engl J Med 1993;30:977–86. https://doi.org/10.1056/NEJM199309303291401.Search in Google Scholar PubMed
12. Fröhlich-Reiterer, EE, Rosenbauer, J, Bechtold-Dalla, PS, Hofer, SE, Schober, E, Holl, RW. Predictors of increasing BMI during the course of diabetes in children and adolescents with type 1 diabetes: data from the German/Austrian DPV multicentre survey. Arch Dis Child [Internet] 2014;99:738–43. https://doi.org/10.1136/archdischild-2013-304237. [cited 2025 Feb 4] Available from: https://pubmed.ncbi.nlm.nih.gov/24812301/.Search in Google Scholar PubMed
13. De Vries, L, Bar-Niv, M, Lebenthal, Y, Tenenbaum, A, Shalitin, S, Lazar, L, et al.. Changes in weight and BMI following the diagnosis of type 1 diabetes in children and adolescents. Acta Diabetol [Internet] 2014;51:395–402. https://doi.org/10.1007/s00592-013-0524-4. [cited 2025 Feb 4] Available from: https://pubmed.ncbi.nlm.nih.gov/24158774/.Search in Google Scholar PubMed
14. Marigliano, M, Eckert, AJ, Guness, PK, Herbst, A, Smart, CE, Witsch, M, et al.. Association of the use of diabetes technology with HbA1c and BMI-SDS in an international cohort of children and adolescents with type 1 diabetes: the SWEET project experience. Pediatr Diabetes [Internet] 2021;22:1120–8. https://doi.org/10.1111/pedi.13274. [cited 2025 Feb 4] Available from: https://pubmed.ncbi.nlm.nih.gov/34716736/.Search in Google Scholar PubMed
15. Cole, TJ, Bellizzi, MC, Flegal, KM, Dietz, WH. Establishing a standard definition for child overweight and obesity worldwide: international survey. BMJ 2000;320:1240. https://doi.org/10.1136/bmj.320.7244.1240.Search in Google Scholar PubMed PubMed Central
16. Piccini, B, Felicioni, M, Pessina, B, Bertini, M, Casalini, E, Ceccotti, C, et al.. Glycemic control, Basal/Bolus distribution, BMI and meal management in children and adolescents with type 1 diabetes and advanced hybrid closed loop. Nutrients [Internet] 2023;15. https://doi.org/10.3390/nu15234875. [cited 2025 Mar 11] Available from: https://pubmed.ncbi.nlm.nih.gov/38068733/.Search in Google Scholar PubMed PubMed Central
17. Pemberton, JS, Collins, L, Drummond, L, Dias, RP, Krone, R, Kershaw, M, et al.. Enhancing equity in access to Automated Insulin Delivery systems in an ethnically and socio-economically diverse group of children with type 1 diabetes. Br Med J Diabetes Open Res Care 2024. https://doi.org/10.1136/bmjdrc-2024-004045. in press.Search in Google Scholar PubMed PubMed Central
18. RCPCH (Royal College of Paediatrics and Child Health). NPDA 2021-22 report on care and outcomes [Internet] 2022. [cited 2023 Dec 28]. Available from: https://www.rcpch.ac.uk/sites/default/files/2023-03/npda_2021-22_report_on_care_and_outcomes.pdf.Search in Google Scholar
19. Pemberton, JS, Barrett, TG, Dias, RP, Kershaw, M, Krone, R, Uday, S. An effective and cost-saving structured education program teaching dynamic glucose management strategies to a socio-economically deprived cohort with type 1 diabetes in a VIRTUAL setting. Pediatr Diabetes [Internet] 2022;23:1045–56. https://doi.org/10.1111/pedi.13381. [cited 2022 Jun 11].Search in Google Scholar PubMed
20. Christakis, NJ, Gioe, M, Gomez, R, Felipe, D, Soros, A, McCarter, R, et al.. Determination of glucose-independent racial disparity in HbA1c for youth with type 1 diabetes in the era of continuous glucose monitoring. J Diabetes Sci Technol 2023:19322968231199113. https://doi.org/10.1177/19322968231.Search in Google Scholar
21. Pemberton, JS, Gupta, A, Lau, GM, Dickinson, I, Iyer, PV, Uday, S. Integrating physical activity strategies to lower hyperglycaemia in structured education programmes for children and young people with type 1 diabetes improves glycaemic control without augmenting the risk of hypoglycaemia. Smart CE, editor. Pediatr Diabetes [Internet] 2023:1–8. https://doi.org/10.1155/2023/2519368. [cited 2023 Jul 10].Search in Google Scholar PubMed PubMed Central
22. Pemberton, J, Li, Z, Gal, RL, Turner, LV, Bergford, S, Calhoun, P, et al.. Duration of physical activity required to Ameliorate hyperglycemia without causing hypoglycemia in type 1 diabetes: a T1DEXI adults and pediatric cohort analyses. Diabetes Res Clin Pract [Internet] 2024;220. https://doi.org/10.1016/j.diabres.2024.111981. [cited 2025 Feb 1] Available from: https://pubmed.ncbi.nlm.nih.gov/39733989/.Search in Google Scholar PubMed
23. Office for National Statistics. Education, England and Wales - Office for national statistics. [Internet]. [cited 2023 Oct 9]. Available from: https://www.ons.gov.uk/peoplepopulationandcommunity/educationandchildcare/bulletins/educationenglandandwales/census2021.Search in Google Scholar
24. Gov.uk. English indices of deprivation 2019 - GOV.UK. [Internet]. [cited 2023 Oct 9]. Available from: https://www.gov.uk/government/statistics/english-indices-of-deprivation-2019.Search in Google Scholar
25. Cole, TJ, Williams, AF, Wright, CM. Revised birth centiles for weight, length and head circumference in the UK-WHO growth charts. Ann Hum Biol 2011;38:7–11. https://doi.org/10.3109/03014460.2011.544139.Search in Google Scholar PubMed
26. Ontario, HQ. Point-of-Care hemoglobin A1c testing: an evidence-based analysis. Ont Health Technol Assess Ser 2014;14:1.Search in Google Scholar
27. Battelino, T, Danne, T, Bergenstal, RM, Amiel, SA, Beck, R, Biester, T, et al.. Clinical targets for continuous glucose monitoring data interpretation: recommendations from the international consensus on time in range. Diabetes Care 2019;42:1593–603. https://doi.org/10.2337/dci19-0028.Search in Google Scholar PubMed PubMed Central
28. Tozzo, V, Genco, M, Omololu, SO, Mow, C, Patel, HR, Patel, CH, et al.. Estimating glycemia from HbA1c and CGM: analysis of accuracy and sources of discrepancy. Diabetes Care [Internet] 2024;47:460–6. https://doi.org/10.2337/dc23-1177. [cited 2025 Mar 11] Available from: https://pubmed.ncbi.nlm.nih.gov/38394636/.Search in Google Scholar PubMed PubMed Central
29. Murphy, JI, Weaver, NE, Hendricks, AE. Accessible analysis of longitudinal data with linear mixed effects models. Dis Model Mech 2022;15. https://doi.org/10.1242/dmm.048025.Search in Google Scholar PubMed PubMed Central
30. Passanisi, S, Salzano, G, Bombaci, B, Minuto, N, Bassi, M, Bonfanti, R, et al.. Sustained effectiveness of an advanced hybrid closed-loop system in a cohort of children and adolescents with type 1 diabetes: a 1-Year real-world study. Diabetes Care [Internet] 2024;47:1084–91. [cited 2025 Jan 31] Available from: https://doi.org/10.2337/dc23-2311.Search in Google Scholar PubMed
31. Carlson, NE, Horton, KW, Hokanson, JE, Cleary, PA, Jacobs, DR, Brunzell, JD, et al.. Weight gain trajectories and obesity rates in intensive and conventional treatments of type 1 diabetes from the DCCT compared to a control population without diabetes. Diabet Med [Internet] 2022;39:e14794. https://doi.org/10.1111/dme.14794. [cited 2025 Jan 31] Available from: https://pmc.ncbi.nlm.nih.gov/articles/PMC9174023/.Search in Google Scholar PubMed PubMed Central
32. Pemberton, JS, Fang, Z, Chalew, SA, Uday, S. Ethnic disparities in HbA1c and hypoglycemia among youth with type 1 diabetes: beyond access to technology, social deprivation and mean blood glucose. BMJ Open Diabetes Res Care [Internet] 2025;13:e004369. https://doi.org/10.1136/bmjdrc-2024-004369. [cited 2025 Jan 28] Available from: https://pubmed.ncbi.nlm.nih.gov/39863288/.Search in Google Scholar PubMed PubMed Central
Supplementary Material
This article contains supplementary material (https://doi.org/10.1515/jpem-2025-0442).
© 2025 the author(s), published by De Gruyter, Berlin/Boston
This work is licensed under the Creative Commons Attribution 4.0 International License.
Articles in the same Issue
- Frontmatter
- Review
- Subclinical but significant? Updated review of pediatric hypothyroidism
- Original Articles
- The differential impact of automated insulin delivery systems on body mass index in children with type 1 diabetes
- Maturity-onset diabetes of the young due to HNF1β variants (HNF1β-MODY): a 2-year follow-up study of six patients from a single diabetes center
- Investigating the kynurenine pathway in pediatric metabolic health
- Mucolipidosis type II and III: clinical spectrum, genetic landscape, and longitudinal outcomes in a pediatric cohort with six novel mutations
- Evaluation of the genetic alterations landscape of differentiated thyroid cancer in children
- Prognostic analysis of persistent disease in medium-to high-risk children and adolescents with differentiated thyroid carcinoma
- The clinical picture of symptomatic Rathke cleft cysts in children
- Pitfalls in the diagnosis of carnitine palmitoyltransferase 1 deficiency
- Effective treatment of hyperphosphatemia with denosumab in patients with loss of function of FGF23 and high bone density: case series
- Case Reports
- Dual molecular genetic diagnosis with combined malonic and methylmalonic aciduria (CMAMMA): implications of coexisting genetic disorders on clinical presentation
- Family experience with individuals of different ages and clinical presentations diagnosed with DI: do familial DI cases tolerate polyuria better?
- Atypical pediatric presentation of hyperparathyroidism: CDC73 gene mutation and parathyroid carcinoma
- Pseudohypertriglyceridemia as a clue: clinical and genetic spectrum of glycerol kinase deficiency in three pediatric cases
- Transient worsening of thyrotoxic myopathy following methimazole and metoprolol initiation in a 12-year-old girl: a case report and literature review
- Letter to the Editor
- Cognitive behavioral therapy (CBT) effect on diabetic youth depression, death anxiety and glycemic control
- Annual Reviewer Acknowledgment
- Reviewer Acknowledgment