Geographic information system mapping and predictors of glycemic control in children and youth with type 1 diabetes: a study from Western India
-
Sushil Yewale


Abstract
Objectives
Geographic Information System (GIS) mapping, is a novel way to provide insights into spatial distribution of type 1 diabetes (T1D) and associations between T1D outcomes and potential predictors. We aimed to explore GIS in children with T1D, and identify predictors of poor glycemic control.
Methods
Design: Cross-sectional; Participants: 402 children and youth (187 boys) with T1D. Place of residence (coordinates) of participants were geocoded in GIS. They were divided into two groups living in urban or peri-urban areas using ArcGIS Pro. The characteristics of urban/peri-urban living were linked to sociodemographic and biochemical data and spatial autocorrelation analysis was performed. Association between glycemic control and distance to our unit was studied.
Results
Mean age was 13.2 ± 4.7 years; 196 children were living in urban areas, 206 in peri-urban areas. There was significant difference in HbA1c between groups (Urban 9.9 (9.7, 10.2) %, Peri-urban 10.5 (10.1, 10.8) %) (p=0.004); mean difference 0.5 (0.1, 1.0) with poorer glycemic control and higher prevalence of vitamin D sufficiency in peri-urban and higher prevalence of hypothyroidism in urban areas. There was significant correlation between glycemic control (HbA1c) and distance to our unit r=0.108 (0.023, 0.218) (p=0.031). Individuals with an HbA1c ≥9.5 were residing farther away (58.9 (49.4, 68.5) km) as compared to those with HbA1c <9.5 (44.5 (35.1, 53.9) km) (p<0.05).
Conclusions
Children with T1D when grouped using GIS had differences in glycemic control and comorbidities; peri-urban participants and those residing further away from our unit had poorer glycemic control. Future efforts may be aimed at identifying centers and channelizing resources towards children showing poor glycemic control, thus optimizing disease management.
Introduction
Type 1 diabetes (T1D) is a complex autoimmune disorder, involving an interplay of genetic as well as environmental factors. In 2022, there were 8.75 million individuals living with T1D worldwide, of which, 860,000 (nearly 10 %) belonged to India, with only USA reporting higher numbers [1], [2], [3]. On the contrary, India has the highest number (282,000) of children and adolescents living with T1D [1]. This global number of 8.75 million is set to double by 2040, as estimated by a modeling study published recently [4].
Geographic Information System (GIS) is a system that helps create, manage, analyze and map data, and by doing so it integrates location data (geographic or spatial data) with all types of descriptive information [5]. In the past, GIS has been mainly used in the epidemiology of communicable diseases, but more recently it has found its way into the domain of non-communicable diseases (NCDs) [6], 7].
We are past the centenary year of discovery of insulin, but its availability and affordability still continues to be a major problem in many low- and middle-income countries (LMICs) like India [8]. According to the International Diabetes Federation (IDF), there were an estimated 182,000 deaths due to T1D in 2022, 42,000 of these being reported from South-East Asia (SEA) region [1]. Moreover, the average life expectancy for an Indian diagnosed with T1D at 10 years of age ranges anywhere between 25 and 39 years, which is significantly lower as compared to that seen in some high-income countries [1]. The T1D Index (a joint initiative between global diabetes societies that uses a Markov model and machine learning techniques to estimate T1D prevalence globally and by individual country) estimated that nearly 20 % of the T1D deaths in 2022 were in non-diagnosed individuals less than 25 years of age, who succumbed within a year of onset of symptoms [1]. Unlike the system of insurance cover for diabetes-related expenses in high-income countries, most patients from LMICs including India bear the expenses themselves. Additionally, under-prioritization of T1D can lead to a further increase in healthcare costs, owing to potentially higher incidence of complications and hospitalizations.
Suboptimal glycemic control in conjunction with long duration of diabetes is known to be associated with increased risk of microvascular complications (nephropathy, retinopathy, neuropathy) as well as macrovascular complications and their independent risk factors (cardiovascular disease and dyslipidemia) [9]. Children and youth with T1D are also at an increased risk of developing comorbid autoimmune disorders such as hypothyroidism and celiac disease [10]. The challenges affecting access to insulin and diabetes healthcare are multifaceted and hence warrant a comprehensive solution [8]. With the increasing incidence of T1D worldwide, particularly in developing countries, GIS mapping by providing insights into the distribution of outcomes of the disorder and associations with potential predictors may help in the development of targeted interventions for better management of the disorder [7].
Thus, the objectives of this study were: 1) To geographically map the residence of children and youth diagnosed with T1D being treated at a tertiary care center in Western India; 2) To compare glycemic control, clinical parameters and prevalence of complications and co-morbidities in children and youth with T1D living in urban- vs. peri-urban area based on the geographic mapping of the residence; 3) To study the relationship between glycemic control and distance from the place of residence of the individual to our tertiary care unit.
Materials and methods
Study design and participants
This cross-sectional study involved children and youth with T1D who attended the diabetes clinic at a tertiary care hospital in Pune, India between August 2021 and April 2022. The study sample is fairly representative of the T1D population from the public sector as our unit caters to underprivileged children and youth with T1D from across Maharashtra (Western India) and incorporates a multi-disciplinary and holistic approach towards patient care. These children are supported with comprehensive medical care in the form of glucometers, strips for testing blood sugar, insulin and other medications, medical consultations as well as nutritionist’s advice. The study was approved by the Institutional Ethics Committee (dated 10 November 2023). Written informed consent was obtained from the parents, and children over 7 years of age gave written assent for the same. All children and youth with T1D who attended the clinic during study period (August 2021 to April 2022) (n=468) were approached to take part in this study. Individuals with missing geographic co-ordinates (n=5) or clinical and biochemical data (n=59) were not included in the study. Moreover, individuals residing in urban areas other than Pune (n=2) were also excluded from the analysis. Our sample (n=402) thus represents all participants with complete clinical, biochemical and geo-spatial data (Figure 1).
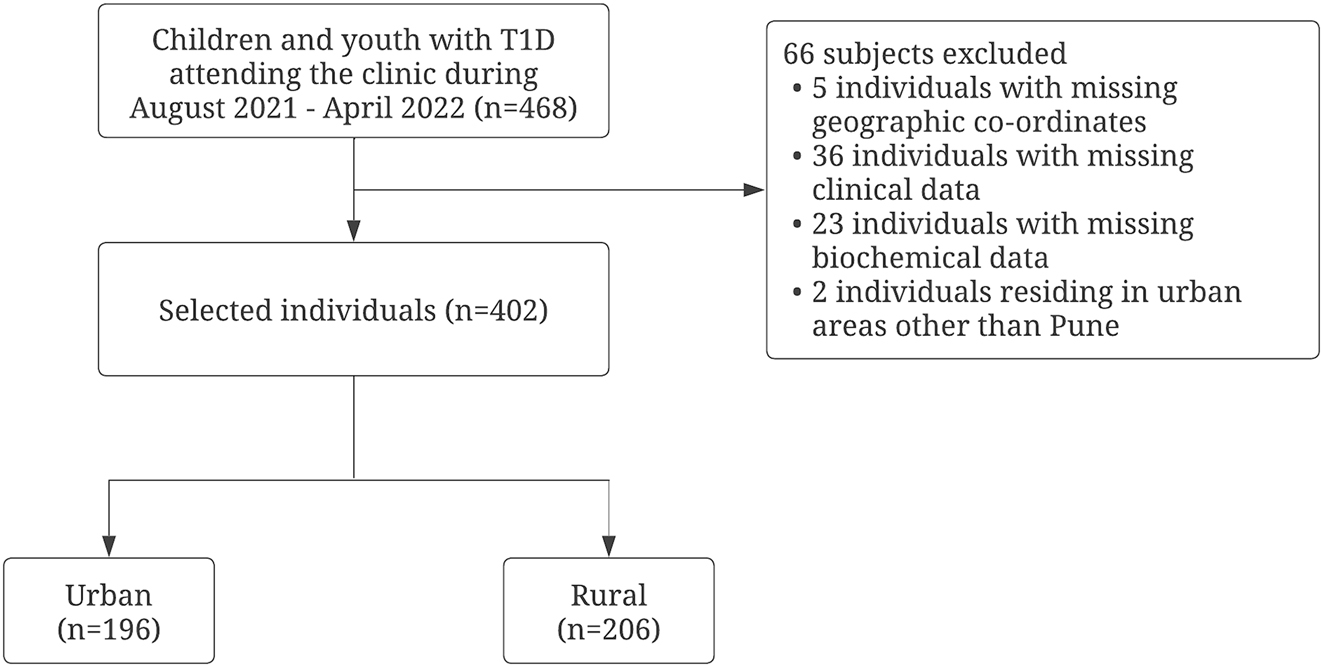
Flowchart demonstrating the study participants.
Socio-demography, clinical history and anthropometry
Socio-demographic data including age, gender, place of residence, education and occupation (of parents), family income, as well as clinical data including the age at onset of diabetes, disease duration, on-going medications and insulin regimen and daily dosages, and presence or absence of complications and co-morbidities were obtained with the aid of standardized questionnaires employed by physicians. Hospital medical records were referred to for verification of the data provided by parents and/or caregivers. Socio-economic class of each participant was determined using the Modified Kuppuswamy socioeconomic scale [11]. The total score of the scale ranges from three to 29, and individuals may be classified into five groups: upper, upper middle, lower middle, upper lower and lower based on a total score of 26–29, 16–25, 11–15, 5–10 and <5, respectively [11]. Standing height was measured to the nearest millimeter using a portable stadiometer (Leicester Height Meter, Child Growth Foundation, UK) and weight was measured to the nearest 100 g using an electronic weighing scale. Body Mass Index (BMI) was calculated by dividing weight in kilograms by height in meters squared. Waist circumference and hip circumference were measured as per recommendations by the WHO [12]. Height, weight, BMI and waist circumference were converted into corresponding Z-scores using ethnic specific reference data [13], 14].
Biochemical measurements
Blood sample (5 mL) collection was performed between seven and 9 AM in fasting state by a trained pediatric phlebotomist. Measurement of glycosylated hemoglobin (HbA1c) was carried out by high-performance liquid chromatography (HPLC, BIO-RAD, Germany). HbA1c ≥9.5 % was defined as ‘poor’ glycemic control [15]. For lipid profile assessment, total cholesterol, triglycerides and high density lipoprotein-cholesterol (HDL-C) were measured by the enzymatic method and low density lipoprotein-cholesterol (LDL-C) was derived using the Friedewald formula [16]. Dyslipidemia was defined as derangement of any one or more of the following parameters: LDL-C >100 mg/dL (>2.6 mmol/L), HDL-C <40 mg/dL (<1.1 mmol/L), total cholesterol >200 mg/dL (>5.2 mmol/L) and/or triglycerides (TG) >130 mg/dL (>1.5 mmol/L) and ≥100 mg/dL (≥1.1 mmol/L) in ages >10 years and <10 years respectively [9], 17], 18]. Thyroid stimulating hormone (TSH) concentrations were measured using chemiluminescent microparticle immune assay (CMIA). Subjects were confirmed to have hypothyroidism in the presence of a low free T4 level (<0.93 ng/dL) in addition to a raised TSH concentration (>4.2 mIU/L) [10]. The serum concentration of 25-hydroxy vitamin D was measured using radioimmunoassay (DiaSorin, Stillwater, MN, USA). Vitamin D status was classified as sufficiency (>20 ng/mL), insufficiency (12–20 ng/mL) or deficiency (<12 ng/mL) based on recommendations by the Indian Academy of Pediatrics [19]. Urine for microalbumin by radioimmunoassay and creatinine by Jaffe’s method were analyzed in the first voided morning sample and urine albumin/creatinine ratio (ACR) was computed. Albuminuria was defined as ACR ≥3 mg/mmol or ≥30 mg/g (spot urine) and individuals with persistent albuminuria in two or more samples over a 3–6 month period were classified to have nephropathy [9].
Body composition
Body composition analysis was performed using Bioelectrical Impedance Analyzer (BIA) (TANITA Model BC420MA) ensuring a minimum of 3 h of fasting and voiding prior to the measurements. By measuring bioelectrical impedance in the standing position, BIA estimates the body fat percentage, fat mass, fat free mass and total body water. Z-scores for body fat percentage and lean body mass percentage were computed using Indian reference data [20].
Geocoding and spatial mapping
Geographic point coordinates of the place of residence of each participant were obtained with the help of the location sharing feature of the mobile application WhatsApp (WhatsApp LLC, Menlo Park, CA, USA). Following the identification of the coordinates (latitude and longitude), they were geocoded into a Geographic Information System (GIS) using ArcGIS Pro software, version 3.0 (ESRI, Redlands, CA, USA). The shape files of administrative boundary maps encompassing Pune and western Maharashtra were obtained. Based on the geographic coordinates, the study population was categorized into two groups living in urban or peri-urban areas. Those residing under the administrative boundary of Pune Municipal Corporation (PMC) and Pimpri Chinchwad Municipal Corporation (PCMC) were categorized as urban, while those residing outside this boundary were categorized as peri-urban. The characteristic of an urban or peri-urban residence was linked to the sociodemographic, clinical and biochemical data of each participant. Heat maps of glycemic control were generated with rise in HbA1c depicted by transition from green to red. Mean (SD) of continuous variables such as HbA1c, age, diabetes duration, insulin requirement, height Z-score, weight Z-score, BMI Z-score, waist circumference, hip circumference and waist circumference Z-score were calculated separately for each of the two groups and the region-wise distribution of categorical variables such as prevalence of complications and co-morbidities were also studied.
Spatial analysis
Spatial autocorrelation explores spatial relationships and helps to explain the extent of spatial patterns in the observations. The spatial relationships were tested based on Tobler’s first law of geography, “Everything is related to everything else, but near things are more related than distant things” [21]. Spatial autocorrelation analysis commonly uses Global Moran’s I to measure spatial autocorrelation based on both feature locations and feature values simultaneously [22]. Spatial autocorrelation was assessed through a Moran’s I scatterplot and the spatial distribution observed in the geographic map. The slope of the regression line of Moran’s I scatterplot represents an estimation of the global Moran’s I.
Statistical analysis
All statistical analyses were carried out using the SPSS software program, version 26 (SPSS, Chicago, IL, USA). Normality testing was performed for all variables before performing any statistical analyses. Comparison of continuous variables between the two groups was carried out using Independent sample T-test, comparison of non-normal continuous variables was carried out using Mann–Whitney U test, and crosstabs were generated for comparing categorical variables between the two groups [23]. Distance between place of residence and our tertiary care unit was computed using the Haversine formula [24], 25]. Pearson correlation followed by Binary logistic regression analysis was used to study the relationship between the dichotomous dependent variable and continuous and categorical predictors. The dependent variable in the model was glycemic control (HbA1c) and the independent variables were socioeconomic class, age, gender, disease duration, and distance from the place of residence of the individual to our tertiary care unit. Two-tailed tests were used for analysis and p-value <0.05 was considered statistically significant.
Results
The mean age of our study population was 13.2 ± 4.7 years with a mean disease duration of 5.9 ± 3.9 years; the overall mean HbA1c was 10.2 ± 2.2 %. 98.8 % (n=397) of the population belonged to the lower or lower middle class according to the modified Kuppuswamy scale. The prevalence of children and youth with nephropathy, dyslipidemia and hypothyroidism was 9.5 , 60.4 and 10.9 % respectively. One hundred ninety-six children and youth belonged to the urban population whereas the remaining 206 were categorized as peri-urban (Table 1). There was no significant difference in age, gender, disease duration, anthropometric parameters including BMI, and insulin requirement between the two groups.
Comparison of glycemic control, clinical parameters and prevalence of complications and co-morbidities in children and youth with T1D in urban and peri-urban population.
| Parameter | Urban (n=196) | Peri-urban (n=206) | Level of significance (p-value) |
|---|---|---|---|
| Age, years | 13.2 ± 4.7 | 13.2 ± 4.7 | 0.94 |
| Gender | |||
| Male | 94 (48 %) | 93 (45.1 %) | 0.56 |
| Female | 102 (52 %) | 113 (54.9 %) | 0.56 |
| Disease duration, years | 5.6 ± 3.9 | 6.1 ± 3.9 | 0.80 |
| Height Z-score | −0.7 ± 1.1 | −0.6 ± 1.2 | 0.49 |
| Weight Z-score | −0.5 ± 1.0 | −0.6 ± 1.1 | 0.83 |
| BMI Z-score | −0.3 ± 1.1 | −0.4 ± 1.0 | 0.44 |
| Waist circumference, cma | 65.6 ± 11.6 | 64.5 ± 13.0 | 0.79 |
| Hip circumference, cma | 78.0 ± 14.5 | 76.9 ± 16.4 | 0.28 |
| Waist circumference Z-score | −1.1 ± 1.1 | −1.3 ± 1.2 | 0.98 |
| LBMZ | 0.2 ± 1.0 | 0.3 ± 0.9 | 0.35 |
| FATZ | −0.2 ± 1.0 | −0.3 ± 0.9 | 0.26 |
| Insulin requirement, IU/kg/day | 1.1 ± 0.3 | 1.1 ± 0.4 | 0.48 |
| HbA1c, % | 9.9 ± 1.9 | 10.5 ± 2.5 | 0.004 |
| HbA1c, mmol/mol | 85 ± 21 | 91 ± 27 | |
| Vitamin D, ng/mLa | 20.1 ± 11.8 | 23.4 ± 13.9 | 0.002 |
| Vitamin D sufficiency | 78 (39.8 %) | 109 (52.9 %) | 0.008 |
| Diabetic nephropathy | 21 (10.7 %) | 17 (8.3 %) | 0.41 |
| Dyslipidemia | 112 (57.1 %) | 131 (63.6 %) | 0.18 |
| Hypothyroidism | 29 (14.8 %) | 15 (7.3 %) | 0.016 |
-
All normal variables presented as mean ± SD. aAll non-normal variables presented as median ± IQR, all categorical variables expressed as n (%). p-Value <0.05 considered statistically significant (indicated in bold). BMI, body mass index; LBMZ, lean body mass percentage Z-score; FATZ, fat percentage Z-score; HbA1c, glycated hemoglobin.
Figure 2 depicts the geographic mapping of children and youth with T1D in Western Maharashtra. There was a significant difference in HbA1c between the two groups (Urban 9.9 (9.7, 10.2) %, Peri-urban 10.5 (10.1, 10.8) %) (p=0.004) with much poorer glycemic control observed in the peri-urban population. Mean difference in HbA1c between the two groups was 0.5 (0.1, 1.0). Heat maps generated for a better visual representation of difference in mean HbA1c as we move from urban to peri-urban areas of Western Maharashtra also showed greater odds of having higher HbA1c in peri-urban areas (depicted in shades of red in Figure 3). Vitamin D sufficiency was significantly higher in peri-urban group as compared to urban group (p=0.009). The prevalence of hypothyroidism in patients with T1D was also significantly different in both groups (p=0.016) with more than double the cases noted in the urban population as compared to the peri-urban population. Spatial autocorrelation of geographic coordinates with glycemic control and other clinical and biochemical parameters did not reveal any significant clustering (see Supplementary Figures S1–3, Supplementary Table S1).
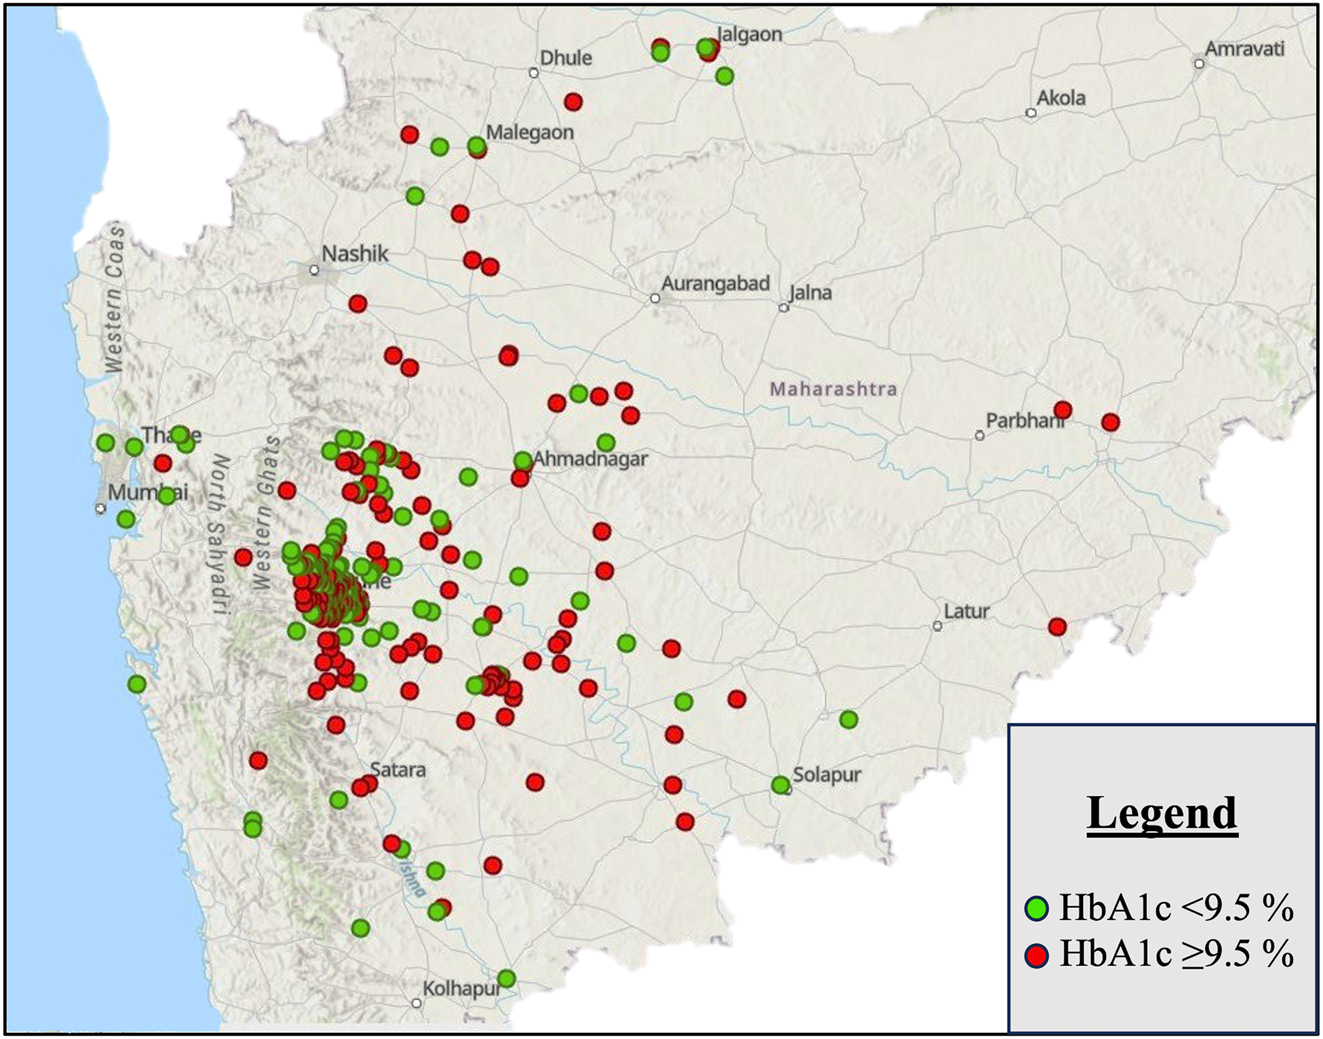
GIS mapping of children and youth with T1D in Western Maharashtra labelled according to HbA1c level; green circles correspond to HbA1c <9.5 % and red circles to an HbA1C ≥9.5 %.
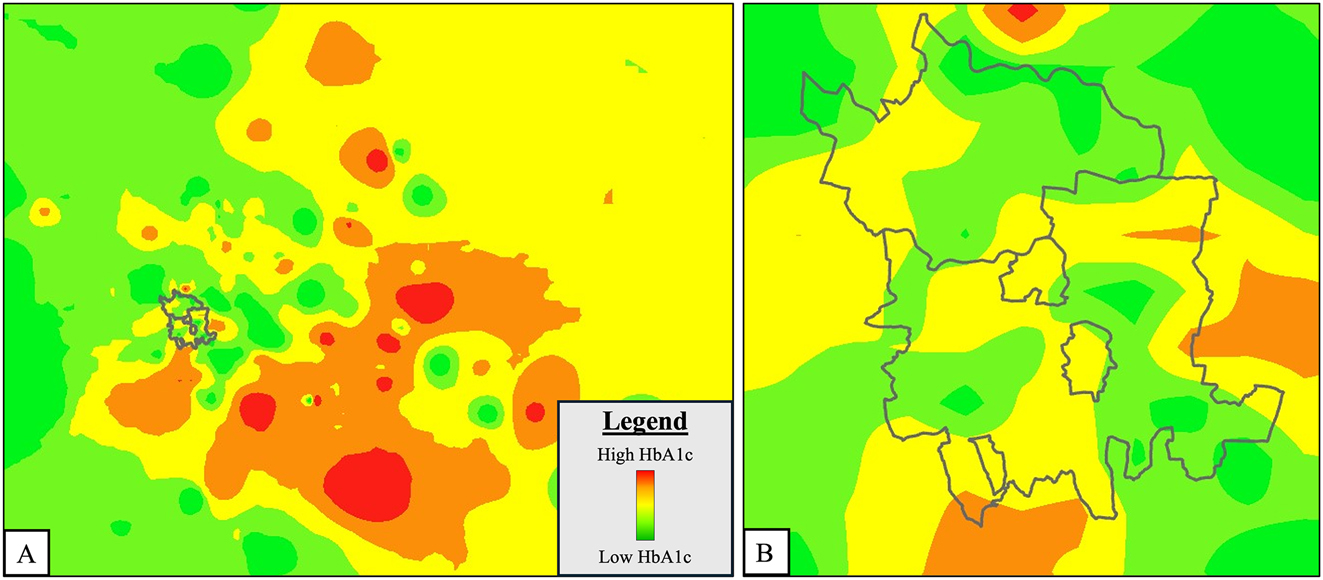
Heat map of glycemic control (HbA1c) in children and youth with T1D in Western Maharashtra. (A) Mean HbA1c level increases from colour green to red with peri-urban areas showing greater odds of having shades of red i.e. higher HbA1c; grey boundary indicates urban area (PMC/PCMC); (B) zoomed-in view of urban area (PMC/PCMC).
There was a significant correlation between glycemic control (HbA1c) and the distance to our tertiary care unit (rpb=0.108, p=0.031). Individuals with an HbA1c ≥9.5 were residing significantly farther away from our tertiary care unit (58.9 (49.4, 68.5) km) as compared to those with an HbA1c <9.5 (44.5 (35.1, 53.9) km) (p<0.05). Binomial logistic regression analysis showed that distance from the individual’s place of residence to our tertiary care unit was the most important and significant predictor of poor glycemic control (HbA1c≥9.5) when controlled for age, gender, socio-economic class and disease duration (Table 2). The odds of having poor glycemic control increased by 1.004 with every 1 km increase in distance to our tertiary care unit.
Binary logistic regression to study the relationship between glycemic control and distance from individual’s place of residence to our tertiary care unit (in km).
| OR (95 % CI) | p-Value | ||
|---|---|---|---|
| Poor glycemic control (HbA1c ≥9.5) | Age | 1.004 (0.954, 1.056) | 0.888 |
| Gender (males) | 1.024 (0.685, 1.533) | 0.906 | |
| Disease duration | 0.988 (0.929, 1.051) | 0.696 | |
| Socio-economic status score | 0.979 (0.842, 1.137) | 0.777 | |
| Distance between place of residence and tertiary care unita | 1.004 (1.000, 1.007) | 0.030 |
-
p-Value <0.05 considered statistically significant (indicated in bold); HbA1c, glycated hemoglobin.
Discussion
Our study investigated the predictors of poor glycemic control using GIS mapping in children and youth with T1D residing in urban and peri-urban areas of Western Maharashtra. To the best of our knowledge, this is the first study in the Indian subcontinent, to use GIS mapping in children with T1D. We report a significant difference in HbA1c between the urban and peri-urban population with the latter demonstrating poorer glycemic control. The prevalence of hypothyroidism and vitamin D insufficiency were significantly higher in those living in the urban areas. Distance to our tertiary care unit, which was the primary center for periodic clinical follow-up as well as dispensing insulin to each individual, was seen as a significant limiting factor in achieving better glycemic control [8], 26].
GIS mapping has been extensively used in the Scandinavian countries which report the highest prevalence of T1D across the globe. A study from Finland, reported marked geographic variation in the incidence of T1D with increasing numbers seen in the rural areas and the role of increasing concentration of nitrates in the drinking water in increased risk of T1D, whereas studies from Sweden, Utah and England reported similar findings [7], [27], [28], [29], [30], [31]. The results from studies performed in Finland and Germany were both conclusive of increased risk of T1D in more remote, rural and less densely populated areas [32], 33]. While these studies were primarily aimed at reporting the incidence of the disease, our study focuses mainly on the differences in glycemic control and prevalence of complications and co-morbidities associated with T1D across urban and peri-urban populations. Similar to the trend of higher incidence of T1D in rural areas, we report a poorer glycemic control in peri-urban areas as well. A study from New Zealand showed a higher median HbA1c in rural Maori populations compared to urban, although, it did not reach statistical significance [34]. Similarly, findings from a study on the effect of an internet-based insulin pump monitoring system on glycemic control in rural and urban children with T1D in Mexico were indicative of poorer glycemic control in the rural population at baseline [35].
Our study demonstrates the influence of distance from place of residence to the tertiary care unit on glycemic control, which may serve as a reliable proxy for the number of clinical visits. A study from Canada showed similar findings, wherein the HbA1c was significantly higher in individuals with fewer number of clinical visits [36]. In the future, spatial mapping of our cohort using GIS may help to identify tertiary care centers in the vicinity thereby aiding in optimizing disease management [8], 26].
The overall prevalence of hypothyroidism in our cohort was reported to be 10.9 % which is similar to the global prevalence of hypothyroidism in persons with T1D [10]. Moreover, we report a significant difference in the prevalence of hypothyroidism in children and youth with T1D between urban and peri-urban populations with more than twice the numbers seen in urban areas. To the best of our knowledge, ours is the first study to report prevalence of hypothyroidism in T1D based on location (urban or peri-urban); hence comparisons were made with available data. Similar to our study, higher prevalence of autoimmune hypothyroidism (in general population) in urban children was reported in a study in Iraq [37]. On the contrary, a study from southwestern Columbia reports comparable status of thyroid autoimmunity in urban and rural population groups, with marginally higher prevalence in rural areas [38]. Studies from Northern India have also shown contrasting findings, wherein prevalence of hypothyroidism (in adults) in the general population has been reported to be more in rural areas [39], [40], [41]. The most plausible explanation for this dissimilarity is the higher prevalence of iodine deficiency in rural areas in the North which may lead to overall increase in the prevalence of hypothyroidism.
The prevalence of vitamin D sufficiency in T1D was similar to that reported in a previous study from Florida, USA; however, our cohort had significantly higher numbers of vitamin D deficient individuals (19 % compared to their 4 %) [42]. The prevalence of vitamin D sufficiency in our T1D cohort was very similar to the national prevalence previously reported in the general population by the authors’ group [43]. Similarly, our study demonstrated significantly higher prevalence of vitamin D sufficiency in the peri-urban population as compared to urban when adjusted for age, gender and BMI [43]. This could thus be attributed to duration of sunlight exposure as evidenced in a study from Southern India [44].
The strengths of our study were the moderate sample size with children and youth residing in urban and peri-urban areas with no significant difference in age, gender and disease duration. Ours is the first study from India to have geographically mapped children and youth with T1D.
Spatial trends of socio-demographic factors such as neighborhood-level inequity and their association with glycemic control have been reported in the past [36]. However, in our study, there was no association recognized between glycemic control and socio-economic status, as most participants belonged to the lower socio-economic class. Thus, the lack of a sizeable number of participants spread across all the socio-economic strata was a major limitation of our study. Lack of data on CGM metrics (such as time-in-range) that could be used as outcome variables while determining predictors of poor glycemic control was another limitation of this study. Finally, due to the nature of the study, our sampling was not random and clusters of individuals with T1D residing in certain geographical areas were studied. Studies with larger sample sizes with participants from other geographical areas are thus required.
In conclusion, we investigated the predictors of poor glycemic control using GIS mapping in children and youth diagnosed with T1D residing in urban and peri-urban areas of Western Maharashtra. We were able to document an association between increasing distance to our tertiary care unit and less optimal glycemic control. With the help of GIS, future efforts may be aimed at identifying centers equipped in managing T1D and channelizing resources towards children showing poor glycemic control. Thus, lesser travel time and more regular follow-up with the clinician will help optimize glycemic control.
-
Research ethics: The study was conducted in accordance with the Declaration of Helsinki (as revised in 2013). The study was approved by the Ethics Committee of the Hirabai Cowasji Jehangir Medical Research Institute, Pune, dated 10th November 2023.
-
Informed consent: Informed consent was obtained from all individuals included in this study, or their legal guardians or wards.
-
Author contributions: All authors have accepted responsibility for the entire content of this manuscript and approved its submission.
-
Use of Large Language Models, AI and Machine Learning Tools: None declared.
-
Conflict of interest: The authors state no conflict of interest.
-
Research funding: None declared.
-
Data availability: The raw data can be obtained on request from the corresponding author.
References
1. Ogle, GD, Wang, F, Gregory, GA, Maniam, J. Type 1 diabetes estimates in children and adults. Brussels: International Diabetes Federation; 2022.Search in Google Scholar
2. Libman, I, Haynes, A, Lyons, S, Pradeep, P, Rwagasor, E, Tung, JY, et al.. ISPAD Clinical Practice Consensus Guidelines 2022: definition, epidemiology, and classification of diabetes in children and adolescents. Pediatr Diabetes 2022;23:1160–74. https://doi.org/10.1111/pedi.13454.Search in Google Scholar PubMed
3. Lin, X, Xu, Y, Pan, X, Xu, J, Ding, Y, Sun, X, et al.. Global, regional, and national burden and trend of diabetes in 195 countries and territories: an analysis from 1990 to 2025. Sci Rep 2020;10. https://doi.org/10.1038/s41598-020-71908-9.Search in Google Scholar PubMed PubMed Central
4. Gregory, GA, Robinson, TIG, Linklater, SE, Wang, F, Colagiuri, S, de Beaufort, C, et al.. Global incidence, prevalence, and mortality of Type 1 diabetes in 2021 with projection to 2040: a modelling study. Lancet Diabetes Endocrinol 2022;10:741–60. https://doi.org/10.1016/s2213-8587(22)00218-2.Search in Google Scholar
5. What is GIS? | geographic information system mapping technology [Internet]. [cited 2024 Feb 27]. Available from: https://www.esri.com/en-us/what-is-gis/overview.Search in Google Scholar
6. Rogers, S. John Snow’s data journalism: the cholera map that changed the world. The Guardian 2013. [Internet] [cited 2024 Jan 29]. Available from: https://www.theguardian.com/news/datablog/2013/mar/15/john-snow-cholera-map.Search in Google Scholar
7. Cuadros, DF, Li, J, Musuka, G, Awad, SF. Spatial epidemiology of diabetes: methods and insights. World J Diabetes 2021;12:1042–56. https://doi.org/10.4239/wjd.v12.i7.1042.Search in Google Scholar PubMed PubMed Central
8. Beran, D, Lazo-Porras, M, Mba, CM, Mbanya, JC. A global perspective on the issue of access to insulin. Diabetologia 2021;64:954–62. https://doi.org/10.1007/s00125-020-05375-2.Search in Google Scholar PubMed PubMed Central
9. Bjornstad, P, Dart, A, Donaghue, KC, Dost, A, Feldman, EL, Tan, GS, et al.. ISPAD Clinical Practice Consensus Guidelines 2022: microvascular and macrovascular complications in children and adolescents with diabetes. Pediatr Diabetes 2022;23:1432–50. https://doi.org/10.1111/pedi.13444.Search in Google Scholar PubMed
10. Fröhlich-Reiterer, E, Elbarbary, NS, Simmons, K, Buckingham, B, Humayun, KN, Johannsen, J, et al.. ISPAD Clinical Practice Consensus Guidelines 2022: other complications and associated conditions in children and adolescents with Type 1 diabetes. Pediatr Diabetes 2022;23:1451–67. https://doi.org/10.1111/pedi.13445.Search in Google Scholar PubMed
11. Saleem, SM, Jan, SS. Modified Kuppuswamy socioeconomic scale updated for the year 2021. Indian J Forensic Community Med 2021;8:1–3. https://doi.org/10.18231/j.ijfcm.2021.001.Search in Google Scholar
12. World Health Organization. Waist circumference and waist-hip ratio: report of a WHO expert consultation, Geneva, 8–11 December 2008. 2011. [cited 2024 Mar 8]. Available from: https://iris.who.int/handle/10665/44583.Search in Google Scholar
13. Khadilkar, V, Yadav, S, Agrawal, KK, Tamboli, S, Banerjee, M, Cherian, A, et al.. Revised IAP growth charts for height, weight and body mass index for 5- to 18-year-old Indian children. Indian Pediatr 2015;52:47–55. https://doi.org/10.1007/s13312-015-0566-5.Search in Google Scholar PubMed
14. Khadilkar, A, Ekbote, V, Chiplonkar, S, Khadilkar, V, Kajale, N, Kulkarni, S, et al.. Waist circumference percentiles in 2–18 year old Indian children. J Pediatr 2014;164:1358–62.e2. https://doi.org/10.1016/j.jpeds.2014.02.018.Search in Google Scholar PubMed
15. Petitti, DB, Klingensmith, GJ, Bell, RA, Andrews, JS, Dabelea, D, Imperatore, G, et al.. Glycemic control in youth with diabetes: the SEARCH for diabetes in youth study. J Pediatr 2009;155:668–72.e3. https://doi.org/10.1016/j.jpeds.2009.05.025.Search in Google Scholar PubMed PubMed Central
16. Warnick, GR, Knopp, RH, Fitzpatrick, V, Branson, L. Estimating low-density lipoprotein cholesterol by the Friedewald equation is adequate for classifying patients on the basis of nationally recommended cutpoints. Clin Chem 1990;36:15–9. https://doi.org/10.1093/clinchem/36.1.15.Search in Google Scholar
17. Expert Panel on Integrated Guidelines for Cardiovascular Health and Risk Reduction in Children and Adolescents; National Heart, Lung, and Blood Institute. Expert panel on integrated guidelines for cardiovascular health and risk reduction in children and adolescents: summary report. Pediatrics 2011;128:S213-56. https://doi.org/10.1542/peds.2009-2107c.Search in Google Scholar PubMed PubMed Central
18. Chiang, JL, Maahs, DM, Garvey, KC, Hood, KK, Laffel, LM, Weinzimer, SA, et al.. Type 1 diabetes in children and adolescents: a position statement by the American diabetes association. Diabetes Care 2018;41:2026–44. https://doi.org/10.2337/dci18-0023.Search in Google Scholar PubMed PubMed Central
19. Gupta, P, Dabas, A, Seth, A, Lakshmi Bhatia, V, Khadgawat, R, Kumar, P, et al.. Indian Academy of Pediatrics Revised (2021) guidelines on prevention and treatment of vitamin D deficiency and rickets. Indian Pediatr 2022;59:142–158.10.1007/s13312-022-2448-ySearch in Google Scholar
20. Chiplonkar, S, Kajale, N, Ekbote, V, Mandlik, R, Parthasarathy, L, Borade, A, et al.. Reference centile curves for body fat percentage, fat-free mass, muscle mass and bone mass measured by bioelectrical impedance in asian Indian children and adolescents. Indian Pediatr 2017;54:1005–11. https://doi.org/10.1007/s13312-017-1201-4.Search in Google Scholar PubMed
21. Miller, HJ. Tobler’s first law and spatial analysis. Ann Assoc Am Geogr 2004;94:284–9. https://doi.org/10.1111/j.1467-8306.2004.09402005.x.Search in Google Scholar
22. Moran, PAP. The interpretation of statistical maps. J Roy Stat Soc B (Methodological) 1948;10:243–51. https://doi.org/10.1111/j.2517-6161.1948.tb00012.x.Search in Google Scholar
23. Schoonjans, F. MedCalc’s comparison of proportions calculator. MedCalc. [Internet] [cited 2024 Jan 22]. Available from: https://www.medcalc.org/calc/comparison_of_proportions.php.Search in Google Scholar
24. Robusto, CC. The cosine-haversine formula. Am Math Mon 1957;64:38–40. https://doi.org/10.2307/2309088.Search in Google Scholar
25. Chopde, N, Nichat, M. Landmark based shortest path detection by using A* Algorithm and Haversine Formula. Int J Innovative Res Comput Commun Eng 2013;1:298–302.Search in Google Scholar
26. Katam, KK, Bhatia, V, Dabadghao, P, Bhatia, E. High direct costs of medical care in patients with Type 1 diabetes attending a referral clinic in a government-funded hospital in Northern India. Natl Med J India 2016;29:64.Search in Google Scholar
27. McCullough, ML, Wan, N, Pezzolesi, MG, Collins, TW, Grineski, SE, Wei, YD, et al.. Type 1 Diabetes incidence among youth in Utah: a geographical analysis. Soc Sci Med 2021;278:113952. https://doi.org/10.1016/j.socscimed.2021.113952.Search in Google Scholar PubMed PubMed Central
28. Moltchanova, E, Rytkönen, M, Kousa, A, Taskinen, O, Tuomilehto, J, Karvonen for the Spat Study Group M. Zinc and nitrate in the ground water and the incidence of Type 1 diabetes in Finland. Diabet Med 2004;21:256–61. https://doi.org/10.1111/j.1464-5491.2004.01125.x.Search in Google Scholar PubMed
29. Samuelsson, U. Geographical mapping of Type 1 diabetes in children and adolescents in South East Sweden. J Epidemiol Community Health 2004;58:388–92. https://doi.org/10.1136/jech.2002.004135.Search in Google Scholar PubMed PubMed Central
30. Sheehan, A, Freni Sterrantino, A, Fecht, D, Elliott, P, Hodgson, S. Childhood Type 1 diabetes: an environment-wide association study across England. Diabetologia 2020;63:964–76. https://doi.org/10.1007/s00125-020-05087-7.Search in Google Scholar PubMed PubMed Central
31. Rytkönen, M, Ranta, J, Tuomilehto, J, Karvonen, M. Bayesian analysis of geographical variation in the incidence of Type I diabetes in Finland. Diabetologia 2001;44:B37–44. https://doi.org/10.1007/pl00002952.Search in Google Scholar PubMed
32. Rytkönen, M, Moltchanova, E, Ranta, J, Taskinen, O, Tuomilehto, J, Karvonen, M. The incidence of Type 1 diabetes among children in Finland – rural–urban difference. Health Place 2003;9:315–25. https://doi.org/10.1016/s1353-8292(02)00064-3.Search in Google Scholar PubMed
33. Castillo-Reinado, K, Maier, W, Holle, R, Stahl-Pehe, A, Baechle, C, Kuss, O, et al.. Associations of area deprivation and urban/rural traits with the incidence of Type 1 diabetes: analysis at the municipality level in North Rhine–Westphalia, Germany. Diabet Med 2020;37:2089–97. https://doi.org/10.1111/dme.14258.Search in Google Scholar PubMed
34. Chepulis, L, Tamatea, JAU, Wang, C, Goldsmith, J, Mayo, CTH, Paul, RG. Glycaemic control across the lifespan in a cohort of New Zealand patients with Type 1 diabetes mellitus. Intern Med J 2021;51:725–31. https://doi.org/10.1111/imj.14816.Search in Google Scholar PubMed
35. Corriveau, EA, Durso, PJ, Kaufman, ED, Skipper, BJ, Laskaratos, LA, Heintzman, KB. Effect of Carelink, an internet-based insulin pump monitoring system, on glycemic control in rural and urban children with Type 1 diabetes mellitus. Pediatr Diabetes 2008;9:360–6. https://doi.org/10.1111/j.1399-5448.2008.00363.x.Search in Google Scholar PubMed
36. Clarke, ABM, Daneman, D, Curtis, JR, Mahmud, FH. Impact of neighbourhood-level inequity on paediatric diabetes care. Diabet Med J British Diabetic Assoc 2017;34:794–9. https://doi.org/10.1111/dme.13326.Search in Google Scholar PubMed
37. Nasheiti, NA. Childhood hypothyroidism in Iraq: a retrospective study. 2005;3:136–9.Search in Google Scholar
38. Vargas-Uricoechea, H, Mera-Mamian, A, Bastidas-Sanchez, B, Pinzon-Fernandez, M, Murillo-Palacios, J, Ramirez-Bejarano, L. Population status of iodine and its potential effects on thyroid function and autoimmunity in southwestern Colombia. J Clin Med Res 2022;14:126–35. https://doi.org/10.14740/jocmr4689.Search in Google Scholar PubMed PubMed Central
39. Malla, DNA. Prevalence of hypothyroidism in adults in Kashmir valley. JMSCR 2018;6. https://doi.org/10.18535/jmscr/v6i12.168.Search in Google Scholar
40. Kumar, S, Gupta, RC. Comparison of prevalence of subclinical hypothyroidism in urban and rural population of northern India. IJSR 2020;9(5):45–46. 10.36106/ijsr.Search in Google Scholar
41. Boruah, A, Dutta, A. Prevalence of hypothyroidism in urban population of Dibrugarh town. J Evol Med Dent Sci. [Internet]. [cited 2024 Jan 30]. Available from: https://www.academia.edu/61439693/Prevalence_of_Hypothyroidism_in_Urban_Population_of_Dibrugarh_Town.Search in Google Scholar
42. Carakushansky, M, Patel, P, Ben Khallouq, BA, Gurnurkar, S. Prevalence of vitamin D deficiency in children with Type 1 diabetes mellitus. Cureus 2020;12:e7836. https://doi.org/10.7759/cureus.7836.Search in Google Scholar PubMed PubMed Central
43. Khadilkar, A, Kajale, N, Oza, C, Oke, R, Gondhalekar, K, Patwardhan, V, et al.. Vitamin D status and determinants in Indian children and adolescents: a multicentre study. Sci Rep 2022;12:16790. https://doi.org/10.1038/s41598-022-21279-0.Search in Google Scholar PubMed PubMed Central
44. Harinarayan, CV, Ramalakshmi, T, Prasad, UV, Sudhakar, D. Vitamin D status in Andhra Pradesh: a population based study. Indian J Med Res 2008;127:211–8.Search in Google Scholar
Supplementary Material
This article contains supplementary material (https://doi.org/10.1515/jpem-2024-0401).
© 2024 the author(s), published by De Gruyter, Berlin/Boston
This work is licensed under the Creative Commons Attribution 4.0 International License.
Articles in the same Issue
- Frontmatter
- Review
- Osteogenesis imperfecta: shifting paradigms in pathophysiology and care in children
- Opinion Paper
- CRH receptor antagonist crinecerfont – a promising new treatment option for patients with congenital adrenal hyperplasia due to 21-hydroxylase deficiency
- Original Articles
- Age and sex mark clinical differences in the presentation of pediatric type 1 diabetes mellitus
- Geographic information system mapping and predictors of glycemic control in children and youth with type 1 diabetes: a study from Western India
- Body composition assessment measured via bioelectrical impedance analysis in euthyroid children with newly diagnosed Hashimoto’s thyroiditis
- Outcomes of newborns screened for congenital hypothyroidism in Turkey – a single center experience
- High yield of congenital hypothyroidism among infants attending Children Hospital, Nairobi, Kenya. Facility based study in the absence of newborn screening
- Immune checkpoint inhibitors and endocrinopathies in pediatric brain tumor patients
- Assessment of quality of life in families affected by maple syrup urine disease: a cross sectional study
- Case Reports
- Reninoma: an unusual cause of growth failure
- Persistent hypoglycemia in congenital syphilis: hyperinsulinemic hypoglycemia with a focal pancreatic lesion
- Diagnostic challenges in pediatric Cushing’s disease associated with chronic renal failure: a report of three patients
- A novel de novo missense OTC mutation in an Iranian girl: a case report