Friction surfacing for enhanced surface protection of marine engineering components: erosion-corrosion study
-
S. Rajakumar
 ,
V. Balasubramanian
,
V. Balasubramanian

Abstract
Good mechanical properties combined with outstanding corrosion-resistance properties of cast nickel-aluminum bronze (NAB) alloy lead to be a specific material for many marine applications, including ship propellers. However, the erosion-corrosion resistance of cast-NAB alloy is not as good as wrought NAB alloy. Hence, in this investigation, an attempt has been made to improve the erosion-corrosion resistance of cast NAB alloy by depositing wrought (extruded) NAB alloy applying the friction surfacing (FS) technique. Erosion-corrosion tests were carried out in slurries composed of sand particles of 3.5% NaCl solution. Silica sand having a nominal size range of 250–355 μm is used as an erodent. Specimens were tested at 30° and 90° impingement angles. It is observed that the erosion and erosion-corrosion resistance of friction surfaced NAB alloy exhibited an improvement as compared to cast NAB alloy. Scanning electron microscope (SEM) analysis showed that the erosion tracks developed on the cast NAB alloy were wider and deeper than those formed on the friction surfaced extruded NAB alloy.
1 Introduction
Cast nickel-aluminum bronze (NAB) alloys are good candidate material for marine applications owing to its complex physical metallurgy and practical combination of strength, toughness and corrosion resistance. Typical uses include valve guides and seats in aircraft engines, corrosion-resistant parts, bushings, gears, worms, pickling hooks and baskets, and agitators. The common problem in cast NAB is porosity which affects physical properties and offers poor service performance. This consequently turns into large sums invested in repairs or unscheduled stops, requiring extensive expertise and significant resources to control [1]. Fusion welding (FW) is one method to eliminate porosity but will result in its own defects. Surface engineering technologies enable advanced microstructural design, which enhances the wear and corrosion properties of the final products. Friction stir processing (FSP) is an alternative method to control porosity and also improves the mechanical properties of cast NAB [2], [3], [4], [5], [6], [7], [8].
Friction surfacing (FS) is a solid-state technology with lots of scope in surface engineering due to fine-grained coatings, which exhibit superior wear and corrosion properties. The coatings can be deposited at temperatures lower than liquidus temperature of the deposited materials. The sequence of the process is as follows (i) pressing the rotating stud made by the metal to be deposited on the substrate with certain pressure, (ii) holding for some time to create shear deformation of the stud caused by decrease in strength due to the frictional heat generated, and (iii) translational movement of the rotating stud is achieved to make the deposition of the plasticized stud. Here, for the effective FS, the important process parameters are rotational speed, traverse speed and normal pressure [9].
NAB alloys have up to 11% aluminum and a few percent nickel and iron which assist in additional heat treatment of these alloys, which already have a combination of good corrosion properties in sea water, their resistance against cavitation erosion (e.g. for ship propellers) and their satisfactory mechanical properties [10]. Cast NAB alloys posses an inhomogeneous copper-rich α-phase/β-phase and precipitates like KI through KIV due to iron and/or nickel existence with these alloys [11]. Many surface modifications were attempted like laser, induction and flame hardening to improve material properties of the cast components, but these techniques mainly concentrated to increase in hardness on the surface. Microstructural modifications and its effect on failure due to corrosion as well as erosion reported that the failure often begins at interfaces between different phases [12], [13], [14], [15].
It was demonstrated that FSP is a reliable method for surface treatment of cast NAB components [16]. Even where new material has to be added, repairing of castings and worn or damaged surfaces, the previously methods may not be the most suitable. FW is also employed in repairing cast components [17], [18]. FS will be a useful alternative to deposit one metal over another with a favorable microstructure and ease of underwater surfacing feasibility. Hanke et al. [19] investigated the cavitation erosion mechanisms of NAB coating layers deposited by FS on plates of the same material. Preliminary studies on the similar deposition by FS of steels [20], aluminum alloys [21], [22] and titanium alloy [23] have been reported.
FS does not involve melting any material, but involves a high degree of shear deformation and simultaneously rapid heating and cooling leading to grain refinement and a homogenized microstructure by dynamic recrystallization [24]. Although the corrosion behavior of NAB was studied extensively, the available literature on erosion-corrosion behavior of friction surfaced NAB is very limited. This paper reveals the erosion-corrosion behavior of extruded NAB friction surfaced coatings on a cast NAB substrate.
2 Materials and experimental methods
FS was performed using ¢ 20 mm and 70 mm length extruded NAB mechtrode on cast NAB substrate plates of size 150 mm×150 mm×10 mm. The chemical composition of the materials used is given in Table 1. The plates to be surfaced were ground with 120-grit abrasive paper and degreasing with acetone. A fully computerized numerical controlled (CNC) friction stir welding (FSW) machine (R.V Machine tools, Coimbatore, Tamilnadu, India) was used to perform the surfacing. The parameters used for surfacing are 200 mm/min traverse speed, 60 mm/min plunge speed and rotational speed of the studs of 2500 rpm rotational speed of the studs. Single layer surfacing deposit was considered in this study. The coating produced by the FS sample of deposition stage and coating is shown in Figure 1A and B.
Chemical composition of cast% of substrate and mechtrode material.
| Element | Cu | Al | Ni | Fe | Mn | Si |
|---|---|---|---|---|---|---|
| Substrate | 81.6 | 10.10 | 3.78 | 4.01 | 0.30 | 0.16 (max) |
| Mechtrode | 80.9 | 10.20 | 3.77 | 4.6 | 0.27 | 0.17 |

Friction surfaced sample.
(A) Deposition stage, (B) coating.
2.1 Slurry erosion test
Figure 2 represents the specially designed test rig to conduct slurry erosion tests. Slurry erosion corrosion test equipment is built in-house with AC-Gill Photentiostat supplied by Wear and Friction Tech, Chennai, India. This machine is capable of controlling the parameters like impact velocity (v), angle of impingement (h), mass flux rate (m), particle size (S) and distribution (d), and standoff distance between the nozzle outlet and target surface individually. Slurry erosion testing was conducted as per the ASTM G-73 standard procedure. Specimens were cut into a size of 10 mm diameter, 10 mm thick by using a wire cut electrical discharge machining (EDM) (Electronica-Pune, Maharshtra, India). Samples were polished with 2500-grid emery papers over the roughly finished surface. The samples prepared for slurry erosion-corrosion for substrate and friction surfaced samples are shown in Figure 3. Prior to testing, all the samples, surfaced as well as unsurfaced, were ground using emery papers up to 1500 grit size. Then, those were polished using 1-μm alumina slurry paste on a disc polishing machine (Metatech-Industries, Pune, Maharashtra, India). A precision weighing balance with an accuracy of 0.0001 mg was used to measure mass loss measurements. After initial tests, an increase in weight was observed due to the addition of corrosion products. So in order to remove those corrosion products, samples were washed with water combined with conc. HCl acid solution in the ratio of 2:1 and dried in air before weight measurement.
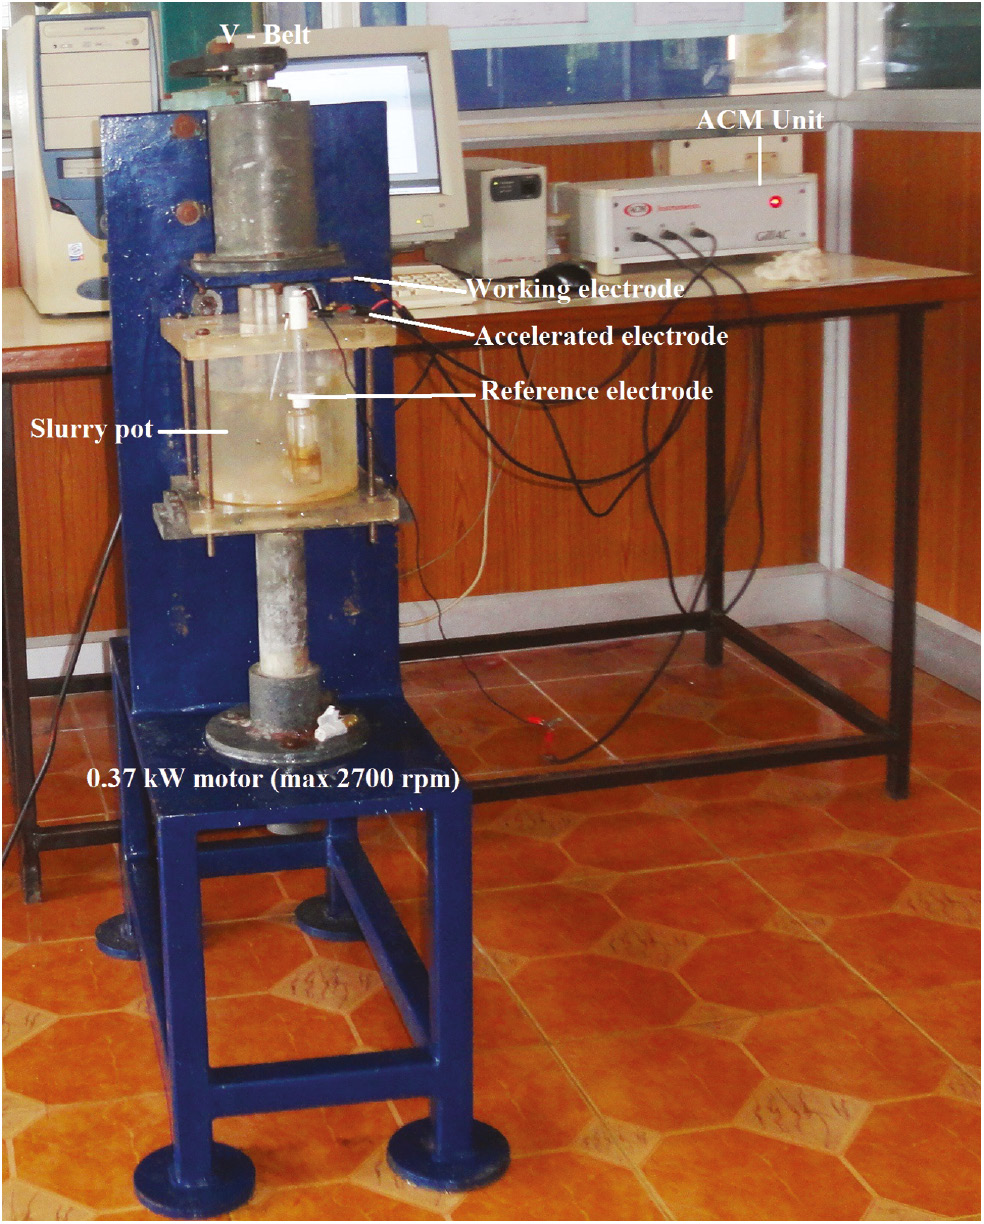
Erosion corrosion test rig.

Erosion corrosion samples.
(A) Base metal, (B) friction surfaced samples.
3 Results
3.1 Erosion and corrosion
The weight loss of the substrate and friction surfaced samples as a function of the impact angle in the presence of slurry was measured. It was noted that when the impact angle increased from 30° to 90°, the weight loss is decreased. Erosion rate is the difference between sample weights before the test with sample weights after the test. The corrosion rate was calculated from the formula (Eq. 1), and erosion and corrosion rates of base metal for 30° and 90° angle of impact is given in Tables 2 and 3. Figure 4A and B show the effect of impact angle on erosion-corrosion behavior of friction-surfaced NAB material. From Figure 4, it is observed that in both charts the erosion and corrosion rate decreases at 90°, compared with 30°. For the base metal, the corrosion and erosion rate is higher than the coated samples (Figure 4B).
where
K=constant (8.76×10⁴),
T=time of exposure in hours (1 h),
A=area in cm2,
W=mass loss in grams, and
D=density in g/cm3 (8.94 g/cm3).
Erosion and corrosion rate of substrate (base metal) material (cast NAB alloy).
| S. No | Angle (degree) | Base metal weight before test (g) | Base metal weight after test (g) | Mass loss (g) | Corrosion rate (mm/year) |
|---|---|---|---|---|---|
| 1 | 30 | 4.3510 | 4.3422 | 0.0088 | 90.7355 |
| 2 | 90 | 4.6559 | 4.6534 | 0.0025 | 25.7771 |
Erosion and corrosion rate of coating material, friction surfaced deposit (extruded NAB alloy).
| S. No | Angle (degree) | Coated metal weight before test (g) | Coated metal weight after test (g) | Mass loss (g) | Corrosion rate (mm/year) |
|---|---|---|---|---|---|
| 1 | 30 | 3.7395 | 3.7317 | 0.0078 | 80.4246 |
| 2 | 90 | 3.8997 | 3.8982 | 0.0015 | 15.4662 |
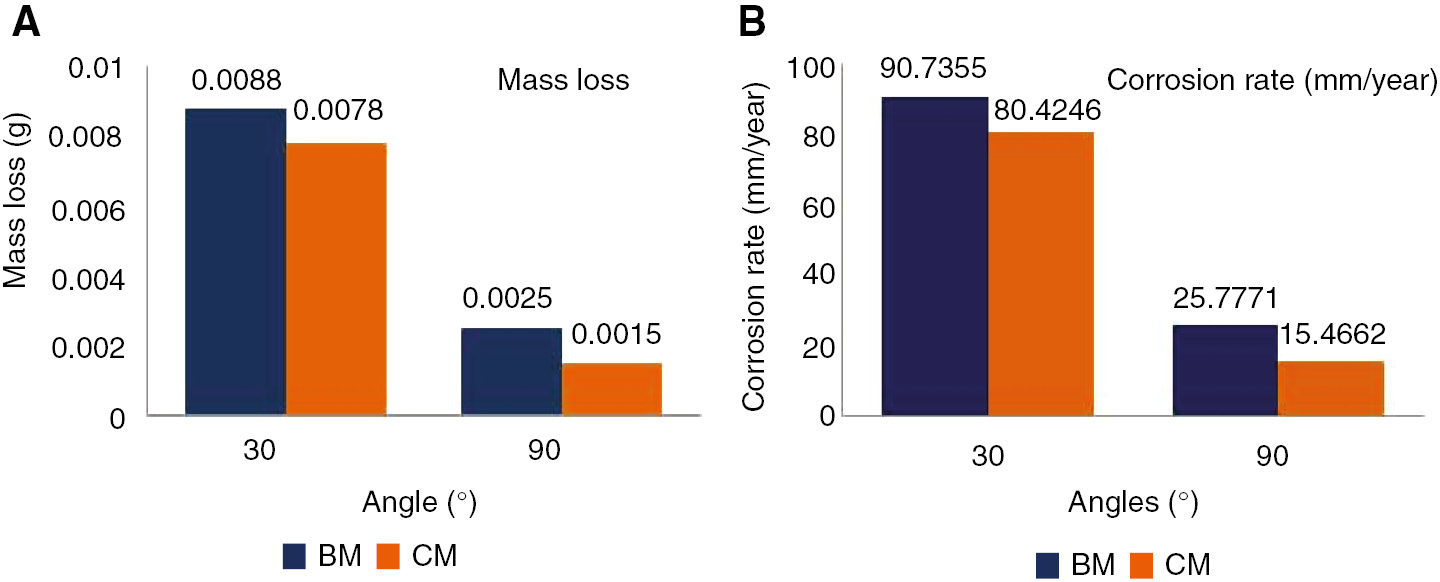
Bar chart shows the effect of impact angles in erosion rate (A) mass loss and (B) corrosion rate (CM-coated metal, BM-base metal).
The corrosion rate is measured in mm per year (mm/year).
3.2 Evolution of microstructure
Figure 5A–F shows the optical micrographs of the substrate (cast NAB), mechtrode (extruded NAB) and friction surfaced zone. The cast NAB material has (Figure 5A) (i) α-phase, (ii) β′-phase formed during solidification alter to the FCC primary α-phase, (iii) globular kappa κii (Fe3Al) (medium gray), (iv) fine κiv precipitates which are also nominally Fe3Al and (v) eutectoid mixture of β transformed →α+κiii phase of proeutectoid κiii (NiAl) globular morphology (dark gray).
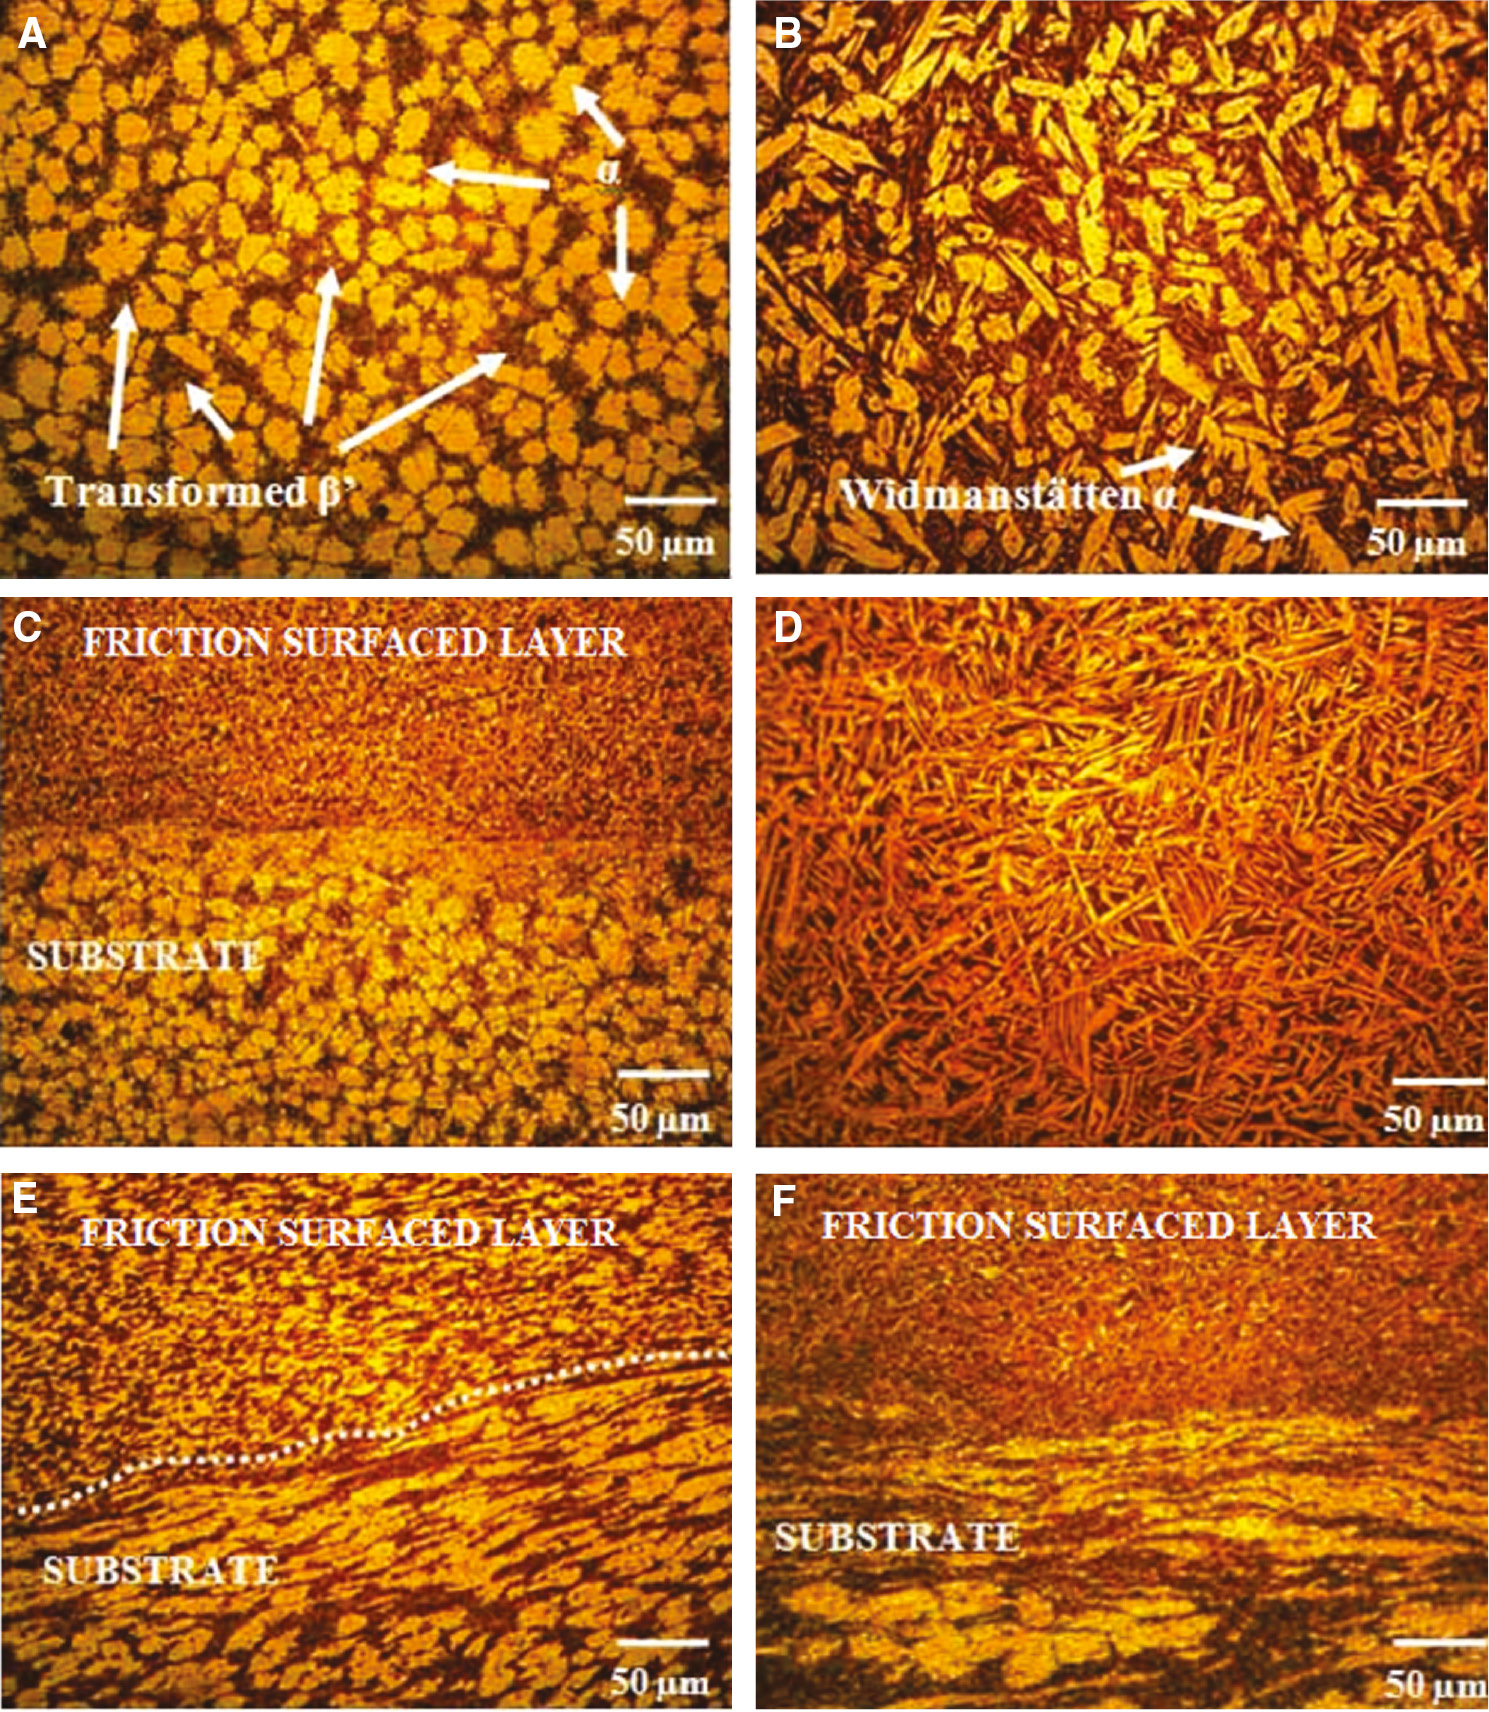
Optical microstructures of substrate, mechtrode and friction surfaced interfaces.
(A) Base material-cast NAB, (B) mechtrode-extruded NAB, (C) interface-friction surfacing and substrate, (D) unmixed friction surfacing, (E) interface-friction surfacing and substrate, (F) interface-friction surfacing and substrate (α grains and β phase).
Tool (mechtrode) material shows a Widmanstätten pattern of microstructure (Figure 5B). The microstructure consists of lamellar/few globular α-grains in addition to some flakes of α-grains, surrounded by quenched β-phase. Close to the surface of the layer, the phase is of lamellar shape. The friction surfaced interface microstructure reveals the good bonding of these layers. Figure 5C shows elongated α-grains mixed together with dark etching β-transformed products. This is due to the severe plastic deformation of the stir zone and experiencing a higher temperature than 800°C leading to the eutectoid reversion in to β-structure. In the unmixed friction surfaced region (Figure 5D), the microstructure clearly unveils the existence of α-grains (white needles) is smaller than that in the as-cast condition, which is actually very fine as compared to Figure 5B. This fine microstructure is due to the hot forging nature of the FS process [3], [25]. In interface locations, the microstructure comprises elongated α-grains and β-grains, but the size of α-grains is greater while the volume fraction of β-transformation products is lesser as observed in Figure 5E. In other locations (Figure 5F), both α-grains and β-transformation products are visible, but α-grains are highly deformed as compared to Figure 5E.
After the erosion-corrosion test, the damaged surfaces of the specimens were examined by optical microscopy as shown in Figure 6A–D. It is noted that due to the continuous impact of slurry on the samples, there was a presence of corrosion pits on the surface of the samples. It is observed that corrosion pits are more on the substrate than the deposit in both 30° (Figure 6A and B) and 90° (Figure 6C and D). The number of corrosion pits is directly proportional to the weight loss. This is the main reason behind the weight loss of the samples after the test.
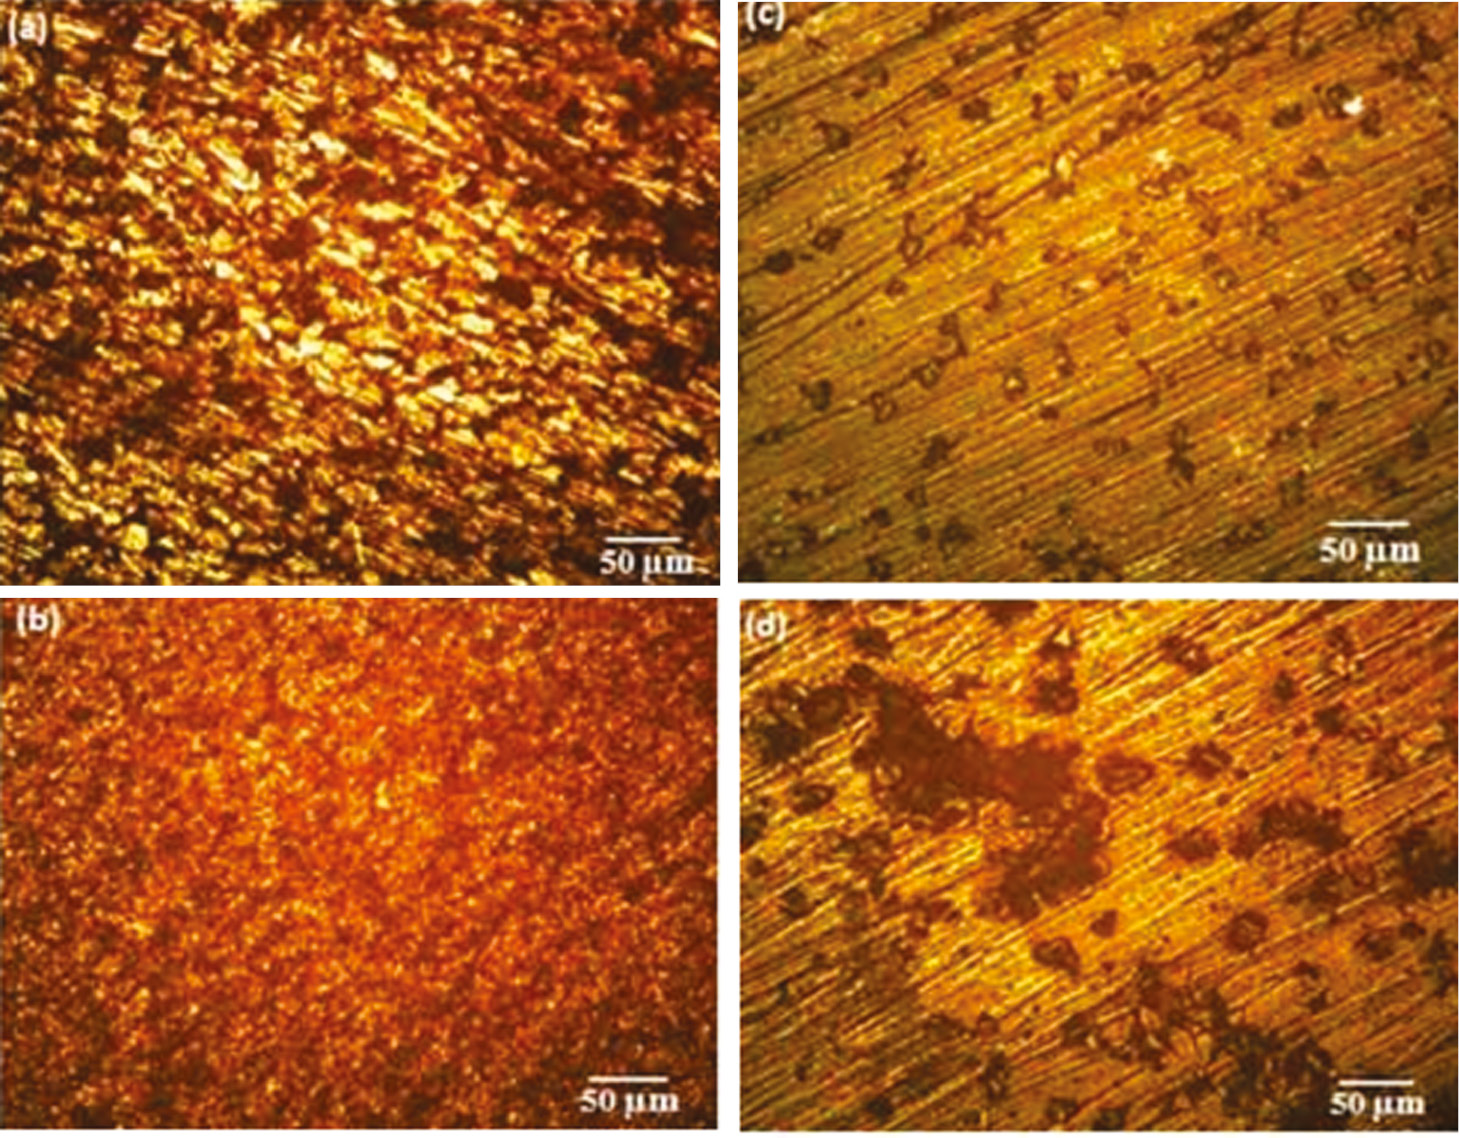
Optical microstructure of erosion corrosion.
(A) Base metal at 30°, (B) base metal at 90°, (C) friction surfaced at 30°, (D) friction surfaced at 90°.
3.3 Scanning electron microscope (SEM) results
Figure 7A reveals the SEM of sand particles used in this study. The average silica sand before the test (size range of 220–500 μm) is shown in Figure 7A. It is noted that the size of the sand particles decreases from the nominal size range of 344 μm–177 μm (Figure 7B). Due to the continuous impingement of sand particles during testing, the sand particle size reduces. Using a SEM, specimens tested at 30° and 90° were scanned on the surfaces at 250× magnifications, and micrographs are shown in Figure 8A–D. The base metal is heavily eroded (Figure 8A) when compared with the coated metal (Figure 8B). The corrosion products are formed all over the surface of the base material (both in 90° and 30°), whereas in coated sample, corrosion products are formed in selected areas only (Figure 8B and D). The rough surfaces are an indication of erosion. The white form or bright areas in the images shown in the figure represent the corrosion products. It is also noted that the corrosion products are more in 90° substrate samples compared with 90° friction surfaced deposit samples as shown in Figure 8C and D.
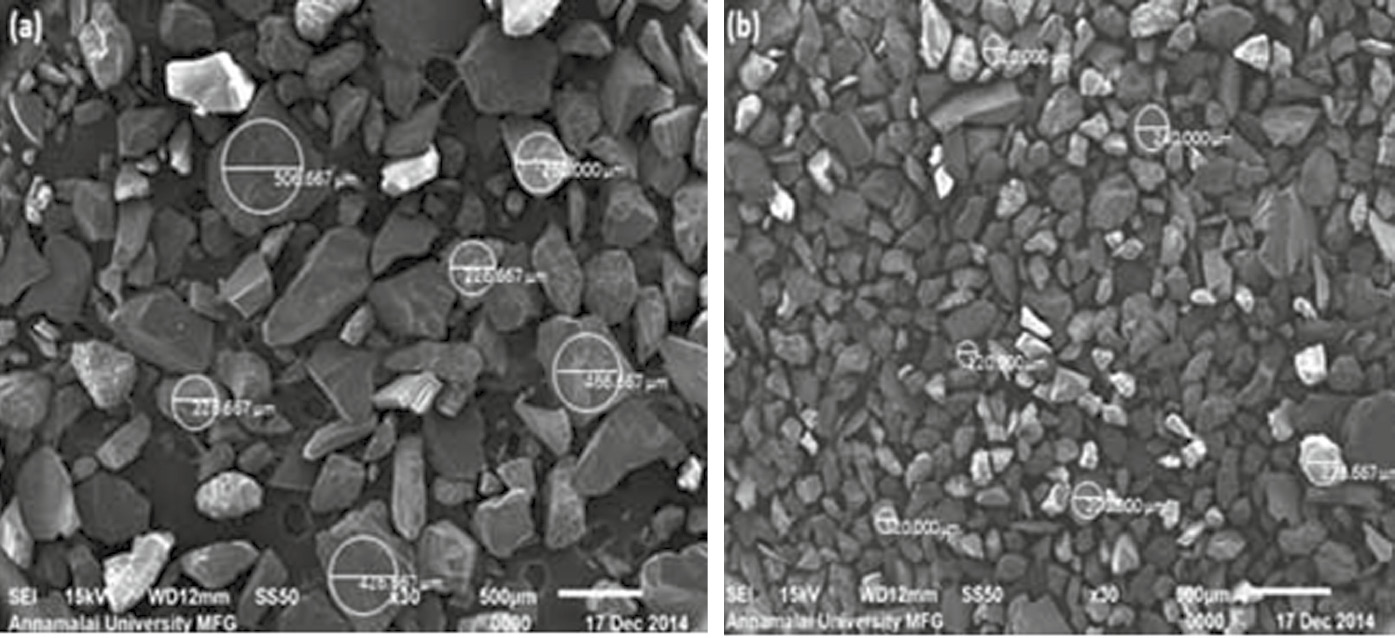
Scanning electron micrograph of silica sand.
(A) Before erosion corrosion test, (B) after erosion corrosion test.

Effect of impact angle on erosion-corrosion morphology.
(A) Base metal at 30°, (B) coating at 30°, (C) base metal at 90°, (D) coating at 90°.
3.4 Pitting corrosion
Conjoint effect of erosion and corrosion behavior of friction surface and the base metal of NAB alloy is shown in Figure 9A–D. From the pitting results, typical polarization curves are generated from impact angles of 30° and 90°, respectively. The respective Icorr value and rest potential are noted from the result generated by the software. It is noted that the corrosion rate is increased in 90° samples compared with 30° samples. The corrosion rate of coated samples decreases when compared with the base metal samples. The result generated by potentiostat is tabulated in Table 4.
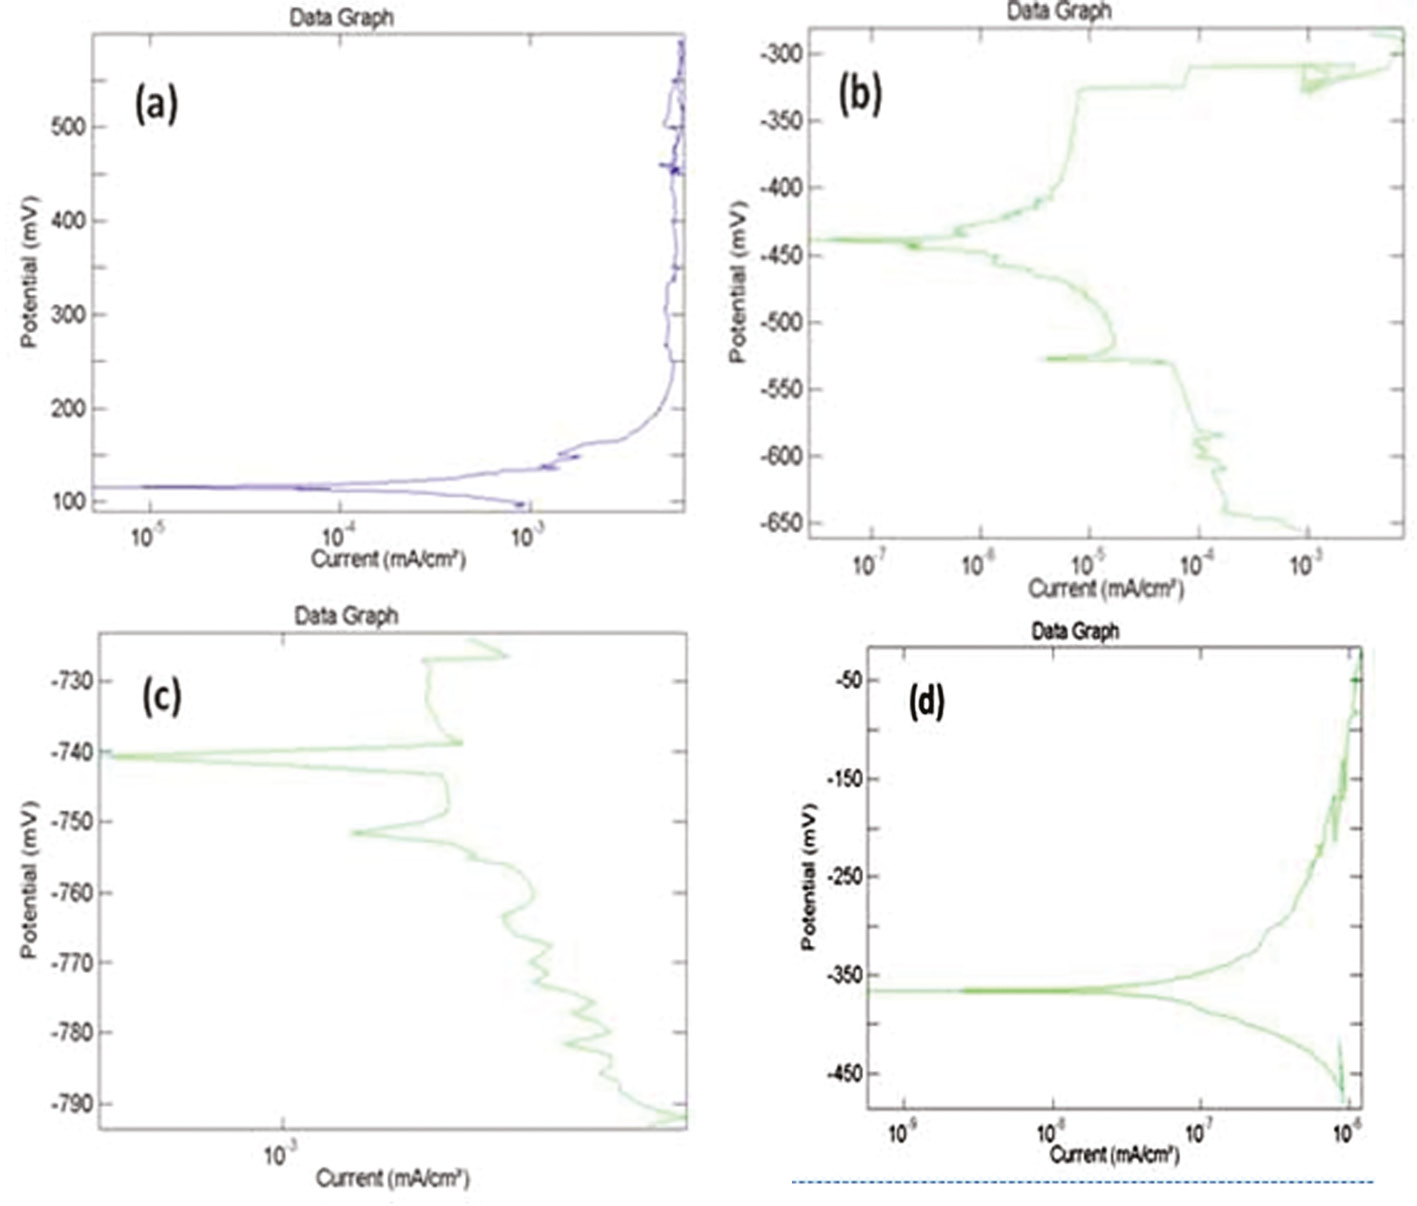
Polarization curve.
(A) 30° friction surfaced, (B) 30° base metal, (C) 90° friction surfaced, (D) 90° base metal.
Corrosion parameter of substrate and deposit material.
| Angle of impingement | Material | Rest potential (V) | Icorr (mA/cm2) | Corrosion rate (mm/year) |
|---|---|---|---|---|
| 30° | Substrate | 344.49381 | 0.0003433 | 0.3074438 |
| 30° | Deposit | -407.14372 | 3.218E-05 | 0.0288237 |
| 90° | Substrate | -543.07946 | 0.0073212 | 6.5573572 |
| 90° | Deposit | -232.53697 | 1.932E-07 | 0.0001566 |
4 Discussions
The types of erosion mode shown by the friction surfaced coatings were identified by the values of impact angles. Materials that show low erosion rates at high impingement angle (90°) fall under the category of impact mode of erosion materials. If the maximum erosion rate is shown at 30°, then the material belongs to the category of shear mode materials [26]. At low impact angle, i.e. 30°, shear stress is dominant, and at 90°, the impact stress becomes dominant [27]. From the erosion-corrosion test results, it is inferred that NAB shows brittle/shear mode of erosion. From the optical micrographs, it is understood that as-cast microstructure of a substrate contains coarse grains, whereas in deposits, it contains a fine homogeneous microstructure. It is mainly due to grain refinement by FS. This fine microstructure in deposits can be achieved by stirring action of mechtrode with the substrate [28].
The SEM study in Figure 8 shows that the NAB surface corrosion was initially confined to the eutectoid regions with a slight attack of the copper rich α-phase within the α+KIII eutectoid. While the eutectoid α-phase was preferentially attacked, the α-grains show very little attack; this is a form of selective phase corrosion [9], [28]. The accumulation of Cu2O deposits at these locations will limit the diffusion (mass transport of species including copper ions, chloride and dissolved oxygen) toward and away from the NAB surface; thus, there is a potential for a microenvironment to develop beneath the deposit. If the pH of this microenvironment becomes acidic, e.g. below pH 4.0, the KIII phase becomes anodic to the α-phase and corrodes preferentially. From the experimental results, it is observed that the fine grain structure is more preferential to achieve high strength and less prone to erosion corrosion. The cast NAB base material samples are more eroded and forms more corrosion products than the friction surfaced samples.
5 Conclusions
The slurry erosion-corrosion performance of a friction surfaced extruded NAB alloy was investigated. From this investigation, the following important conclusions are derived:
Friction surfaced deposits are effective in controlling the slurry erosion of a cast NAB alloy.
The friction surfaced extruded NAB alloy showed a much lower corrosion rate in the erosion-corrosion condition than the cast NAB alloy due to the fine grain microstructure and annihilation of casting porosities during FS.
The weight loss rate of both the substrate and deposits increased as the angle of impact decreased from 90° to 30°.
At localized sites, erosion corrosion occurred, and due to the continuous nature of the κIII-phase, this resulted in the accumulation of corrosion.
Acknowledgments
The authors wish to register sincere thanks to the University Grants Commission (UGC) /Research Award scheme funding for the project: Friction Surfacing for Enhanced Surface Protection of Marine Engineering components [F.30-68/2012 (SA-II)]. The authors very much indebted and thankful to Shri Govind Shaw, Managing Director, Govind Metal Co., Ahmedabad for supplying NAB alloy for this investigation. Finally, authors are thankful to Mr. M. Praveen and S. Muthukumar, project assistants, for their help and support for experimental work.
References
[1] Culpan EA, Rose G. Br. Corros. J. 1979, 14, 160–166.10.1179/bcj.1979.14.3.160Suche in Google Scholar
[2] Ferrara RJ, Caton TE. Mater. Perform. 1982, 21, 30–34.Suche in Google Scholar
[3] Lorimer GW, Hasan F, Iqbal J, Ridley N. Br. Corros. J. 1986, 21, 244–248.10.1179/000705986798272046Suche in Google Scholar
[4] Tang CH, Cheng FT, Man HC. Mater. Sci. Eng. A 2004, 373, 195–203.10.1016/j.msea.2004.01.016Suche in Google Scholar
[5] Kear G, Barker BD, Stokes K, Walsh FC. J. Appl. Electrochem. 2004, 34, 1235–1240.10.1007/s10800-004-1758-1Suche in Google Scholar
[6] Kear G, Barker BD, Stokes K, Walsh FC. J. Appl. Electrochem. 2004, 34, 1241–1248.10.1007/s10800-004-1759-0Suche in Google Scholar
[7] Fuller MD, Swaminathan S, Zhilyaev AP, McNelley TR. Mat. Sci. Eng. A-Struct. 2007, 463, 128–137.10.1016/j.msea.2006.07.157Suche in Google Scholar
[8] Batchelor AW, Jana S, Koh CP, Tan CS. J. Mater. Proc. Technol. 1996, 57, 172–181.10.1016/0924-0136(95)02057-8Suche in Google Scholar
[9] Gandra J, Krohn H, Miranda RM, Vilac P, Quintino L, Dos Santos JF. J. Mater. Proc. Technol. 2014, 214, 1062–1093.10.1016/j.jmatprotec.2013.12.008Suche in Google Scholar
[10] Hanken S, Beyer M, Aulis Silvonen, Dos Santos JF, Fischer A. Wear 2013, 301, 415–423.10.1016/j.wear.2012.11.016Suche in Google Scholar
[11] Shinoda T, Li JQ. Surf. Eng. 2000, 16, 31–35.10.1179/026708400322911483Suche in Google Scholar
[12] Russel AM. Structure–Property Relations in Nonferrous Metals, Wiley-Interscience: 2005, p. 311.10.1002/0471708542Suche in Google Scholar
[13] Jahanafrooz A, Hasan F, Lorimer GW, Ridley N. Metall. Trans. 1983, 14, 1951–1956.10.1007/BF02662362Suche in Google Scholar
[14] Kawazoe T, Kawazoe T, Ura A, Saito M, Nishikido S. Surf. Eng. 1997, 13, 37–40.10.1179/sur.1997.13.1.37Suche in Google Scholar
[15] Tang CH, Cheng FT, Man HC. Surf. Coat. Technol. 2004, 182, 300–307.10.1016/j.surfcoat.2003.08.048Suche in Google Scholar
[16] Lee MK, Hong M, Kim GH, Kim KH, Rhee CK, Kim WW. Mater. Sci. Eng. 2006, 425, 15–21.10.1016/j.msea.2006.03.039Suche in Google Scholar
[17] Mahoney MW. Mater Sci. Forum 2003, 426, 2843–2848.10.4028/www.scientific.net/MSF.426-432.2843Suche in Google Scholar
[18] Sasaki Y. Res. Dev., Kobe Steel Engineering Reports 1983, 33, 69–72.Suche in Google Scholar
[19] Hanke S, Fischer A, Beyer M, dos Santos J. Wear 2011, 273, 32–37.10.1016/j.wear.2011.06.002Suche in Google Scholar
[20] Bedford GM, Vitanov VI, Voutchkov II. Surf. Coat. Technol. 2001, 141, 34–39.10.1016/S0257-8972(01)01129-XSuche in Google Scholar
[21] Vilac P, Gandra J, Vidal C. In: Ahmad Z, ed. Aluminium Alloys—New Trends in Fabrication and Applications. InTech: Rijeka, Croatia, 2012.Suche in Google Scholar
[22] Suhuddin U, Mironov S, Krohn H, Beyer M, Dos Santos JF. Metall. Mater. Trans. A 2012, 43A, 5224–5231.10.1007/s11661-012-1345-8Suche in Google Scholar
[23] Beyer M, Resende A, Santos JF. Friction surfacing for multi-sectorial appli-cations – FRICSURF, Institute for Materials Research, GKSS ForschungszentrumGeesthacht GmbH, Technical report, 2003.Suche in Google Scholar
[24] Lotfollahi M, Shamanian M, Saatchi A. Mater. Des. 2014, 62, 282–287.10.1016/j.matdes.2014.05.037Suche in Google Scholar
[25] Oh-ishi K, McNelley TR. Metall. Mater. Trans. A 2004, 35A, 2951–2961.10.1007/s11661-004-0242-1Suche in Google Scholar
[26] Liang G, Peng X, Xu L, Cheng YF. J. Mater. Eng. Perform 2013, 22, 3043–3048.10.1007/s11665-013-0579-ySuche in Google Scholar
[27] Diogo Jorge Oliveira Andrade Pereira, FCT/UNL, UNL, Friction Surfacing of Aluminium Alloys, 2013.Suche in Google Scholar
[28] Ni DR, Xiao BL, Ma ZY, Qiao YX, Zheng YG. Corros. Sci. 2010, 52, 1610–1617.10.1016/j.corsci.2010.02.026Suche in Google Scholar
©2016 Walter de Gruyter GmbH, Berlin/Boston
This article is distributed under the terms of the Creative Commons Attribution Non-Commercial License, which permits unrestricted non-commercial use, distribution, and reproduction in any medium, provided the original work is properly cited.
Artikel in diesem Heft
- Frontmatter
- Eccentric annular crack under general nonuniform internal pressure
- Path-dependent J-integral evaluations around an elliptical hole for large deformation theory
- On the correct interpretation of compression experiments of micropillars produced by a focused ion beam
- Influences of post weld heat treatment on tensile strength and microstructure characteristics of friction stir welded butt joints of AA2014-T6 aluminum alloy
- Effect of tool velocity ratio on tensile properties of friction stir processed aluminum based metal matrix composites
- Friction surfacing for enhanced surface protection of marine engineering components: erosion-corrosion study
- Propagation of SH waves in a regular non-homogeneous monoclinic crustal layer lying over a non-homogeneous semi-infinite medium
- Tsallis statistics and neurodegenerative disorders