Bielefeld May In Fact Not Exist – Empirical Evidence From Official Population Data
-
Patrick Winter


Abstract
The “Bielefeld conspiracy” has long disputed the existence of Bielefeld, a (supposed) German city. In this paper, an approach is developed to test such a theory empirically by auditing officially reported population numbers, arguing that real cities would not fake these. It is shown that Bielefeld’s data, in fact, violate the Benford law, a statistical law that they should follow if they were genuine. This anomaly is found only for Bielefeld, in contrast to all other tested similar and dissimilar cities, across two decades, and with highest significance by five statistical tests. The Bielefeld conspiracy remains as the most or even only plausible explanation for these findings.
1 Introduction
For more than 25 years now, rumors have persisted that the ostensible city of Bielefeld in the west of Germany does not really exist, not at all or at least not as an actual city (see Butkus et al. 2010 for background). Some of these rumors seem rather “far-fetched”, and also easily refutable by anecdotal evidence like “but I already have been there twice” on first glance. Although the latter is even known to be false – interested readers are referred to Halle (2013) for explanations and convincing counter arguments, as those are not in the focus of this paper – these two may be primary reasons why researchers have so far dismissed the theories altogether as one great “Bielefeld conspiracy” and in advance. Almost no actual research has thus been carried out on the true nature of Bielefeld, not even on those theory variants that do have a valid line of argumentation (e.g., that Bielefeld may be the cover for a secret governmental project) and therefore deserve some respectful attention.
It is not straightforward though to investigate claims such as these. Two theoretical considerations will be helpful. For one thing, the supposed existence of Bielefeld does not differ from those of genuine cities in any obvious way; approaching it at a logical, deductive level should therefore hardly be possible. Instead, it should be regarded an empirical hypothesis and approached with corresponding methods. For another thing, however, a hypothesis of non-existence can empirically only be falsified but never be verified with complete certainty under the paradigm of falsificationism. One consequentially can approximate a proof of the Bielefeld conspiracy only indirectly, namely by showing that its opposite – that is, the existence of Bielefeld as an actual city – were very unlikely given the empirical evidence.
Which data would allow to derive such a conclusion? Necessarily, they need to differ between existence and non-existence of Bielefeld, but they should also be as unbiased by other determinants as possible, which generally means not too specific. Data therefore seem most suited that directly relate to Bielefeld as a city; their mere existence would already proof its genuineness, but only if they can be regarded as genuine themselves. Vice versa, it were unlikely that a genuine city would fake such data (this point will be discussed in more detail later). Thus, in order to prove the Bielefeld conspiracy, it should be sufficient to find satisfactory evidence that the data officially published about Bielefeld are fake.
In this paper, such a proof will be approached with regard to data that arguably present the most constitutive data about a city at all, namely the population numbers of Bielefeld. More concretely, it will be tested whether these numbers respect a general law – the Benford law (introduced in Section 2) – that such data should follow if they are genuine (Section 3). The result will then be substantiated by additional supporting analyses and robustness checks (Section 4), from which finally a conclusion can be derived on the validity of the Bielefeld conspiracy (Section 5).
2 The Benford Law
When observing the respective first digit of a given set of numbers, one would intuitively not expect that these digits follow a special distribution. Benford (1938) (re)discovered,[1] however, that for most sets of numbers which have originated “naturally”, in particular have neither been forged nor manipulated, a common distribution exists, and a surprisingly skewed one at that: following this Benford distribution, almost each third such number begins with digit 1 (30.1%), while only roughly each twenty-second begins with digit 9 (4.6%); in general, digit d occurs with a probability P(d) of
The reasons for the appearance of this statistical pattern, called the Benford law, are complex, varying in dependence on the numbers’ origin, and correspondingly diverse (see, e.g., Fewster 2009 for a plausible explanation). Nevertheless, it has been found and confirmed by Benford himself as well as in many subsequent studies for a multitude of applications, amongst them river courses, physical constants, numbers printed in newspapers, address data, molecular weights, and mortality rates. The website https://testingbenfordslaw.com presents graphically visualized results for several further areas.
Of special relevance for this paper are results in the context of population numbers. In fact, these exhibit a particularly strong tendency to follow the Benford law (Sandron 2002): The growing or shrinking of an area can be described as an exponential process, and from that follows under weak additional assumptions (1) (Ross 2011). This holds true regardless of the granularity at which areas are considered (e.g., countries vs. regions vs. cities, etc.). Empirical results confirm the theoretical prediction: The pattern has been found to be applicable for, amongst others, the worldwide nations (Olofsson 2015), the US counties (Nigrini 1999), and the cities of Indiana (Ross 2011). Further examples in the context of population numbers can be found at the above-mentioned website.
When data are manipulated, on the other hand, the fragile “balance” on which the Benford law is based is disturbed, and for (naively) forged data it usually does not exist from the beginning (Gauvrit et al. 2017; Hill 1999). This can be used for testing whether suited data are genuine: if they violate the Benford law, they are probably not (the converse argument would, of course, not be true in general; see Durtschi et al. 2004 for a discussion). Although rather simple, this idea is of great practical relevance, since it is the basis of many fraud detection methods in business, taxation, and other sensitive areas (e.g., Nigrini 2012). It has enabled researchers to uncover manipulations even of highest political order, such as in the balance sheets of Greece (Rauch et al. 2011).
In the following, the same approach will now be applied to the population numbers of Bielefeld, in order to test whether they are genuine or also manipulated.
3 Inspecting the Population Numbers of Bielefeld
According to its professed statistics authority (https://www.bielefeld.de/statistik), Bielefeld has 339,367 inhabitants (as of 31 December 2018), who live distributed among 10 city districts or 72 quarters (statistical divisions). Since the Benford law does not depend on area granularity, as mentioned above, in principle both structurings could be evaluated by it. The number of city districts is too small to present reliable evidence, however, so the breakdown by quarters is used in the following.
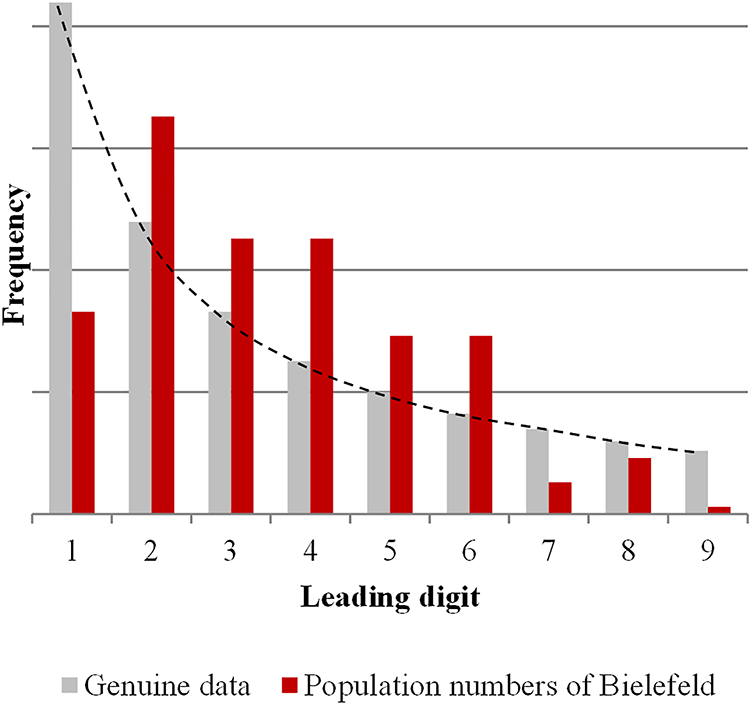
From this breakdown, the frequency distribution of the first digits was derived; it is given in Table 1 and visualized in Figure 1, both times in comparison to the expected Benford distribution P(d).
Expected versus actual distribution of the leading digits in the population numbers of Bielefeld.
| Leading digit | Expected frequency in genuine data (Benford) | Actual frequency in the population numbers of Bielefeld |
|---|---|---|
| 1 | 21.67 (30.1%) | 9 (12.5%) |
| 2 | 12.68 (17.6%) | 17 (23.6%) |
| 3 | 9.00 (12.5%) | 12 (16.7%) |
| 4 | 6.98 (9.7%) | 12 (16.7%) |
| 5 | 5.70 (7.9%) | 8 (11.1%) |
| 6 | 4.82 (6.7%) | 8 (11.1%) |
| 7 | 4.18 (5.8%) | 2 (2.8%) |
| 8 | 3.68 (5.1%) | 3 (4.1%) |
| 9 | 3.29 (4.6%) | 1 (1.4%) |
| Sum | 72.00 (100.0%) | 72 (100.0%) |
Expected versus actual distribution of the leading digits in the population numbers of Bielefeld.
The two distributions apparently strongly diverge; especially striking is – besides the large frequency differences from 18% (digit 8) to 72% (digit 4) – that the actual distribution does not monotonously decrease but increase again at two places (digits 2 and 8). This is not only in contrast to the structure of the expected distribution, it also contradicts the above-mentioned mathematical reason for the presence of the Benford law in (genuine) population numbers (Ross 2011).
But of course, one should not rely on a mere visual inspection of the data; a statistical test is necessary of whether the actual frequency distribution really differs significantly from the expected one or whether the deviations can be explained by statistical variation. The most popular procedure for such a test is the χ2 test; however, it exhibits some severe weaknesses for Benford-type applications (Cerasa 2022; Morrow 2014), which is why nowadays more specific procedures are used for this case. Here, the m test by Leemis et al. (2000) is employed, which is sometimes regarded as particularly suited (Morrow 2014). It will be shown later that this choice is not critical, since other procedures would lead to similar results.
For carrying out the test, the reported population numbers of Bielefeld were imported in the data analysis program R (R Core Team 2022) and evaluated therein by the package BenfordTests (Joenssen 2015). α=0.01 was chosen as level of significance, since the other common one, α=0.05, is sometimes considered too conservative with regard to Benford-type analyses (Kruger and Yadavalli 2017). So, put explicitly, the test may reject the assumption that the population numbers follow the Benford law only if the probability to observe them under this condition is below 1%.
The test result shows that this probability is actually even lower by far, namely at a level of p=0.0007 (0.07%). This confirms the visual impression at highest statistical significance. It can therefore be concluded (within the usual bounds of empirical evidence validity) that the population numbers of Bielefeld violate the Benford law and thus are very probably non-genuine.
4 Supporting Analyses
Some objections still could be raised against the obtained result. These are addressed in the following sections to further corroborate the findings.
4.1 Robustness
A first possible objection may be that for testing whether the population numbers of Bielefeld obey the Benford law or not, a certain procedure had to be chosen, and that the result might not be robust with regard to that choice. The test was repeated for this reason (ceteris paribus) with other common procedures (see Morrow 2014 and Cerasa 2022 for studies on how these compare generally in Benford-testing); Table 2 shows the respective p values.
Results of Benford-testing the population numbers of Bielefeld with alternative test procedures (sensitivity analysis).
| Test | p-Value |
|---|---|
| m test (Leemis et al. 2000) | 0.0007 |
| χ2 test | 0.0129 |
| d test (Cho and Gaines 2007) | 0.0011 |
| Joenssen test (Joenssen 2015, see jpsq.benftest) | 0.0007 |
| Kolmogorov–Smirnov test | 0.0044 |
| Watson test with modification of Freedman (1981) | 0.0006 |
As can be seen, four of five other procedures show as well that the Benford law is violated at the chosen significance level of 1%, and the p value of the remaining one, the χ2 test – which is not very reliable for Benford-tests generally, as mentioned above – is very close to that threshold (and far below the other common one of 5%). Thus, there is hardly any justification to doubt robustness.
4.2 Other Cities
The next possible objection to the main result of this paper may be that it might also be obtainable for other cities than Bielefeld. This could be the case, for instance, if it followed rather from statistical artefacts (e.g., when partitioning the city into divisions) than from actual manipulations in the population numbers. In order to meet that objection, the analysis described in Section 3 was also carried out for a number of further cities (ceteris paribus). The cities chosen for this purpose firstly include all other cities of NRW (the state to which Bielefeld officially belongs) with a similar number of inhabitants. Furthermore, Osnabrück (as a replacement for Paderborn, which has too few districts for a valid statistical evaluation) and Hanover have been included as nearby but significantly smaller or larger (resp.) cities. Nuremberg and Hamburg were additionally tested because they have an especially large number of districts, meaning high reliability. For each city, population numbers close to the reference date of 31 December 2018 were retrieved from the websites of their respective statistics authority, just as it had been done for Bielefeld. Table 3 contains the results of the corresponding tests.
Results of Benford-testing the population numbers of cities close, similar, or dissimilar to Bielefeld but actually existing.
| City | State code | Distance to Bielefeld (beeline) | Districts | Inhabitants in 2018 | p-Value | Benford law violated at α=0.01? |
|---|---|---|---|---|---|---|
| Bielefeld | NRW | – | 72 | 339,367 | 0.0007 | YES |
| Münster | NRW | 39 mi | 45 | 310,610 | 0.4017 | NO |
| Bochum | NRW | 68 mi | 30 | 370,797 | 0.0257 | NO |
| Gelsenkirchen | NRW | 71 mi | 18 | 264,576 | 0.6708 | NO |
| Wuppertal | NRW | 80 mi | 69 | 361,264 | 0.2374 | NO |
| M.-Gladbach | NRW | 107 mi | 44 | 270,429 | 0.3368 | NO |
| Bonn | NRW | 109 mi | 50 | 330,224 | 0.5190 | NO |
| Aachen | NRW | 136 mi | 34 | 256,294 | 0.1873 | NO |
| Osnabrück | NI | 27 mi | 23 | 168,506 | 0.8120 | NO |
| Hanover | NI | 57 mi | 49a | 541,773 | 0.0768 | NO |
| Nuremberg | BY | 210 mi | 81 | 535,746 | 0.0729 | NO |
| Hamburg | HH | 122 mi | 104 | 1,885,413 | 0.6393 | NO |
-
a2 × 2 of actually 51 districts are aggregated in the official statistics.
It can be seen that Bielefeld is in fact the only city to violate the Benford law. For all other cities, it seems valid, regardless of state, distance to Bielefeld, number of districts, or number of inhabitants. Particularly meaningful are the comparisons to Münster, which is in immediate proximity, and Wuppertal, which has a similar size and almost the same number of inhabitants (and consequently a similar population density); the p values for them are, however, many hundred times higher than that for Bielefeld.
It should be remarked that three other p values are rather low in comparison, namely those for Hanover, Nuremberg, and Bochum. This is not too surprising, since it is an artefact of the definition of significance that when testing enough cases, there will always be a few for which the test falsely rejects the null hypothesis (here of following the Benford law). So, when further increasing the number of cities, one would probably find a false-negative sometime. However, it cannot be argued vice versa that Bielefeld would just be such an empirical error, since it had been the defined starting point of the analysis and not been selectively chosen from a list of hundreds of cities. One should also take into account that even the closest p value (for Bochum) is still far above the significance threshold and tremendously larger than that for Bielefeld, namely by a factor of 37.
4.3 Earlier Years
Finally, it could be objected that just the tested population numbers of Bielefeld from 2018 may violate the Benford law, while those of earlier years might adhere to it. This is of importance especially when one questions that genuine cities would not report false data. There may be incentives to do so; for instance, population numbers are usually an important factor determining the budget allocation across city districts as well as cities, so that exaggerating them could lead to better finance. Besides, it would simply be possible that mistakes have happened during data collection, editing, or reporting. It would not be convincing, however, to argue that such behaviors would occur every year, especially not when the same results repeat over decades and, thus, different governments and people in charge. Therefore, the above analysis was also carried out with the historical population numbers of Bielefeld reported for the years 2015, 2012, 2009 – when there was a change in government – and 2005 (no data were available for the equidistant year 2006). Table 4 shows the results.
Results of Benford-testing the historical population numbers of Bielefeld.
| Year | Inhabitants | p-Value |
|---|---|---|
| 2018 | 339,367 | 0.0007 |
| 2015 | 333,998 | 0.0021 |
| 2012 | 327,097 | 0.0022 |
| 2009 | 325,275 | 0.0029 |
| 2005 | 328,673 | 0.0056 |
One can see that the violation of the Benford law found for the reference year is confirmed for all other years at highest significance. This invalidates the aforementioned objection and also demonstrates again that the obtained result is not just a random outlier.
5 Conclusion
In this paper, it has been shown the reported population numbers of Bielefeld – and only these, in contrast to those of all other cities in the same state and of similar size, as well as those of further cities – violate a statistical law that almost all genuine data, and population numbers in particular, should follow. This result has been confirmed by five different statistical tests at highest significance. It thus provides strong evidence for the population numbers of Bielefeld being manipulated or even made-up.
But why should a city do that? Possible explanations that are based on incentives or mistakes of the people in charge were found to be very unlikely given that the same data anomaly has occurred – at least – since the year 2005 and continuously from then on. If Bielefeld does not exist, on the other hand, as it has long been argued by the (so-called) Bielefeld conspiracy, no one can live there, and the reported population numbers need to be made-up. Similarly, if Bielefeld does exist as an entity but just mimics the semblance of a city as a cover for its real nature (e.g., a secret governmental project), as other conspiracy variants argue, the numbers need to be manipulated.
The Bielefeld conspiracy can therefore be regarded the most plausible explanation for the found anomaly, if not the only remaining plausible explanation.
-
Data availability: All data and software used in this paper are publicly available; see the text for details.
Important Afterword
In recent times, a lot of junk science has surfaced that applies real scientific methods to real data (in some cases even correctly) and then draws plausible-seeming inferences from the results, to finally arrive at conclusions which are completely outlandish. This paper is an example of that procedure. It is, of course, not meant seriously – that is unless you are a Bielefeld official in charge of #Bielefeldmillion, in which case you still owe me 1 million €. To that competition, which was arranged on the occasion of the 25th anniversary of the Bielefeld conspiracy in 2019, I had submitted (an earlier and German version of) this paper initially, but disgracefully I have never received any response, in particular no refutation. And in fact, it should be difficult to come up with one, since I, while I certainly have used every trick possible, have tried with great care not to make any clear mistakes (e.g., in the statistics) and to reason all my arguments and decisions in great detail, so that they become at least acceptable, if not convincing. This is what I actually want to demonstrate by my paper: That even with such an approach on official data, it is still very much possible to come to absurd (and often predefined) but nevertheless hard-to-refute conclusions, such as that Bielefeld would not exist. But that still does in no way imply that anyone should believe these from now on, of course. Or so THEY say at least.
References
Benford, F. (1938). The law of anomalous numbers. Proc. Am. Phil. Soc. 78: 551–572.Suche in Google Scholar
Butkus, G., Droste, W., Grosche, E., Wischmeyer, D., Niermeyer, S., Tietz, F., Zippert, H., Niemann, R., Mon, F., and Lindenberg, U. (2010). Rätselhaftes Bielefeld: Die Verschwörung. Pendragon, Bielefeld, German.Suche in Google Scholar
Cerasa, A. (2022). Testing for Benford’s law in very small samples: simulation study and a new test proposal. PLoS One 17: e0271969, https://doi.org/10.1371/journal.pone.0271969.Suche in Google Scholar
Cho, W.K.T. and Gaines, B.J. (2007). Breaking the (Benford) law: statistical fraud detection in campaign finance. Am. Statistician 61: 218–223, https://doi.org/10.1198/000313007x223496.Suche in Google Scholar
Durtschi, C., Hillison, W., and Pacini, C. (2004). The effective use of Benford’s law to assist in detecting fraud in accounting data. J. Forensic Account. 5: 17–34.Suche in Google Scholar
Fewster, R.M. (2009). A simple explanation of Benford’s law. Am. Statistician 63: 26–32, https://doi.org/10.1198/tast.2009.0005.Suche in Google Scholar
Freedman, L.S. (1981). Watson’s U2N statistic for a discrete distribution. Biometrika 68: 708–711, https://doi.org/10.2307/2335458.Suche in Google Scholar
Gauvrit, N., Houillon, J.C., and Delahaye, J.P. (2017). Generalized Benford’s law as a lie detector. Adv. Cognit. Psychol. 13: 121–127, https://doi.org/10.5709/acp-0212-x.Suche in Google Scholar
Halle, K.H.V. (2013). Gibt es Bielefeld oder gibt es Bielefeld nicht?: Wie die Wissenschaft eine ganze Stadt verschwinden lässt. Eichborn, Frankfurt am Main, German.Suche in Google Scholar
Hill, T.P. (1999). The difficulty of faking data. Chance 12: 27–31, https://doi.org/10.1080/09332480.1999.10542154.Suche in Google Scholar
Joenssen, D.W. (2015). BenfordTests: statistical tests for evaluating conformity to Benford’s law, R package version 1.2.0, Available at: https://cran.r-project.org/package=BenfordTests (Accessed 01 May 2022).Suche in Google Scholar
Kruger, P.S. and Yadavalli, V.S.S. (2017). The power of one: Benford’s law. S. Afr. J. Ind. Eng. 28: 1–13, https://doi.org/10.7166/28-2-1753.Suche in Google Scholar
Leemis, L.M., Schmeiser, B.W., and Evans, D.L. (2000). Survival distributions satisfying Benford’s law. Am. Statistician 54: 236–241, https://doi.org/10.2307/2685773.Suche in Google Scholar
Morrow, J. (2014). Benford’s law, families of distributions and a test basis. In: Centre for economic performance (CEP) discussion paper no. 1291, Available at: https://cep.lse.ac.uk/_new/publications/abstract.asp?index=4486 (Accessed 09 April 2022).Suche in Google Scholar
Newcomb, S. (1881). Note on the frequency of use of different digits in natural numbers. Am. J. Math. 4: 39–40, https://doi.org/10.2307/2369148.Suche in Google Scholar
Nigrini, M.J. (1999). Fraud detection: I’ve got your number. J. Account. 187: 79–83.Suche in Google Scholar
Nigrini, M.J. (2012). Benford’s law: applications for forensic accounting, auditing, and fraud detection. Wiley, Hoboken.10.1002/9781119203094Suche in Google Scholar
Olofsson, P. (2015). Probabilities: the little numbers that rule our lives, 2nd ed. Wiley, Hoboken.10.1002/9781118898864Suche in Google Scholar
R Core Team (2022). R: a language and environment for statistical computing. R Foundation for Statistical Computing, Vienna.Suche in Google Scholar
Rauch, B., Göttsche, M., Brähler, G., and Engel, S. (2011). Fact and fiction in EU-governmental economic data. Ger. Econ. Rev. 12: 243–255, https://doi.org/10.1111/j.1468-0475.2011.00542.x.Suche in Google Scholar
Ross, K.A. (2011). Benford’s law, a growth industry. Am. Math. Mon. 118: 571–583, https://doi.org/10.4169/amer.math.monthly.118.07.571.Suche in Google Scholar
Sandron, F. (2002). Do populations conform to the law of anomalous numbers? Population 57: 755–761, https://doi.org/10.2307/3246664.Suche in Google Scholar
© 2022 the author(s), published by De Gruyter, Berlin/Boston
This work is licensed under the Creative Commons Attribution 4.0 International License.
Artikel in diesem Heft
- Frontmatter
- Editorial
- Editorial Announcement
- Original Article
- Political Ignorance and the Internet
- Under Debate
- Bielefeld May In Fact Not Exist – Empirical Evidence From Official Population Data
- Comment to “Bielefeld May In Fact Not Exist – Empirical Evidence From Official Population Data” (DOI https://doi.org/10.1515/jbnst-2022-0038) by Patrick Winter
- Reply to the Comments by Peter Winker to “Bielefeld May In Fact Not Exist – Empirical Evidence From Official Population Data” (https://doi.org/10.1515/jbnst-2022-0038)
- Literature Review
- Export Boosting Policies and Firm Performance: Review of Empirical Evidence Around the World
- Data Observer
- DeZIM.panel – Data for Germany’s Post-Migrant Society
- Combined Business Tax Statistics 2016 of the Federal Statistical Office of Germany – A Micro Data Set for Scientific Use