Energy Use Patterns in German Manufacturing from 2003 to 2017
-
Kathrine von Graevenitz


Abstract
The manufacturing sector accounts for a substantial share of the German gross domestic product, employment and carbon emissions. Therefore, reducing its energy use and carbon emissions is of crucial importance to Germany’s energy Transition. In this paper, we analyse energy use patterns in German manufacturing between 2003 and 2017, using rich administrative micro-data. We find that although the manufacturing sector has been faced with rising energy costs as a share of total costs, energy use has not declined except briefly during the economic crisis. We also find that energy intensity, and to a larger degree, carbon intensity follow a decreasing trend between 2003 and 2017. The stronger response of the latter variable can be attributed to changes in the fuel mix.
1 Introduction
The transition away from fossil and to some extent nuclear fuels began in the late 1990s in Germany. A large number of different policy measures were introduced over the years starting with the introduction of ecotaxes in 1999. Further policy instruments were introduced to incentivize the expansion of renewable electricity generation (e.g. feed-in-tariffs for solar and wind energy financed through the associated Renewable Energy Surcharge on electricity introduced in 2000). In 2005, the EU emissions trading scheme was established regulating carbon emissions for certain sectors across the EU. In addition, the nuclear phaseout initiated in 2000 and reinvigorated after the Fukushima disaster in 2011 has changed the energy landscape in Germany. The support for renewable energy generation has increased the cost of electricity for end users.
The introduction of these policy measures has spurred an intense debate on what the cost in terms of loss of competitiveness may be. This concern is rooted in the observation that climate policy remains a largely national affair with many unregulated regions around the world. The German economy still depends heavily on the export-oriented manufacturing sector, which accounted for approximately 17 % of employment and 25 % of GDP in 2021 (DeStatis 2022a, 2022b). Due to concerns about competitiveness, several policy measures feature exemptions for particularly energy-intensive and/or trade-exposed sectors. For example, generous feed-in-tariffs have contributed to the expansion of renewable electricity generation driving down electricity costs on the wholesale market. The Renewable Energy Surcharge was designed to cover the gap between the wholesale electricity prices and the feed-in-tariffs. In consequence of the rising take-up of renewable energies, the amount necessary to cover this gap increased substantially, resulting in a dramatic increase of the Renewable Energy Surcharge over the years. Policy makers responded by expanding the exemption scheme and exempting more plants from paying the full surcharge from 2012 onwards. Energy intensive and trade-exposed sectors have also benefited from free allowances in the EU Emissions Trading Scheme and electricity price compensation for indirect emission costs.
This paper takes stock of the energy use patterns and trends in the manufacturing sector from 2003 to 2017. Manufacturing accounted for roughly 30 % of final energy demand and 40 % of electricity use in 2021 (AG Energiebilanzen e.V. 2022). We examine the evolution of fuel use, energy intensity and carbon emissions using administrative data on the German manufacturing sector. Our findings are sobering: By and large, energy intensity in German manufacturing has remained largely unchanged up to 2013, and only decreased to a limited extent in the last three years of data availability. Fuel switching has, however, contributed to bringing down carbon intensity to a larger degree. A growing trend towards self-generation of electricity can be observed, which is consistent with incentives to avoid electricity surcharges. Energy costs have been rising over time, also in terms of their share of total costs, but primarily before 2010. Between 2014 and 2017, the energy cost share has decreased again. We conclude that German manufacturing is still far from achieving substantial emissions reductions. In consequence, more research is necessary to better understand the effectiveness of individual policy measures targeting energy efficiency and how they can be improved.
The paper is structured as follows: Section 2 describes the data available for the analysis and our data preparation. Section 3 discusses the development of energy and fuel use in manufacturing and energy and carbon intensity. Section 4 takes a closer look at energy costs at the firm level. Section 5 examines heterogeneity within manufacturing and is followed by a short conclusion in Section 6.
2 Data
2.1 The AFiD Panels
We investigate the developments in energy use patterns in the manufacturing sector in Germany using official micro-level data from the Federal Statistical Offices of the Bund and the Länder, the so-called AFiD panels (“Amtliche Firmendaten für Deutschland”: Official Firm Data for Germany). Specifically, we make use of the panels “industrial plants”, “energy use” and “cost structure”.
The panel “industrial plants” contains information on the number of employees per plant, sales, payroll statistics, the value of output, exports (in €) and further variables on the economic activities of plants. The AFiD panel collects this information from four individual sources: the “monthly reports on manufacturing, mining and quarrying plants”, the “annual report of manufacturing, mining and quarrying plants”, the “investment survey for manufacturing, mining and quarrying plants” and the “quarterly production survey for manufacturing plants”. Participation in the survey is mandatory for all industrial plants in the German manufacturing sector with more than 20 employees. We have data available from 1995 to 2017.
The information from the panel “industrial plants” is combined with the panel “energy use”. The latter contains information on the energy use of industrial plants, such as the consumption of different fuels, electricity procurement, or electricity self-generation. Again, all plants with more than 20 employees are required to report in the survey. Until 2002, the information on the energy use of plants was based on information from the “monthly report on manufacturing, mining and quarrying plants”. In 2003, a separate survey on the annual energy use of manufacturing, mining and quarrying plants was introduced. Due to the creation of this stand-alone survey, information on energy use are more accurate and more detailed from 2003 onwards. Since more characteristics of energy use are available after 2002 and the modification of the reporting leads to breaks in the data (see e.g. Petrick et al. 2011 on this point), we limit our analysis to the time span from 2003 to 2017.
The “cost structure survey for the manufacturing, mining and quarrying industries” contains information at the firm-level. Hence, while we analyse energy use, emissions and production variables at the plant-level, analyses of (energy) costs are conducted at the firm-level. The cost structure survey covers a sample of around 18,000 firms per year. Bigger firms are more likely to be sampled, and firms with more than 500 employees are always included in the survey.
Throughout our analyses, we focus on the manufacturing sector that accounted for around 25 % of GDP (DeStatis 2022a) and a similar share of carbon emissions (Umweltbundesamt 2022) in 2021.[1] The focus on the manufacturing sector leaves us with a panel of around 40,000 plants per year.
2.2 Data Cleaning
The research data centres and the statistical offices conduct various quality controls with the data. In addition, we adopt the following separate data cleaning procedure. First, we drop all observations that report implausible annual revenues of 0 or 1 €. Furthermore, we exclude all observations with an annual output value of below 10.000 €.
We further exclude all observations that report a negative energetic fuel use and those observations where our calculated measure of total energy use is below zero. There are a few firms in which one plant reports the energy statistics for several plants within the firm. While we can identify these firms, we cannot properly allocate the fuel and electricity use across plants and therefore drop the respective firms. Finally, we drop outliers in terms of fuel and electricity use for whom one standard deviation within the plant is bigger than 100 times the median of the plant.
Figure 1 shows the total energy use per year for the full data set before and after cleaning the data as described. Overall, we drop roughly 1100 plants (in 2003) to 2400 plants (in 2010) per year, which amounts to 2.5 % and 5.5 % of plant observations in the respective years. In total, we drop 27,659 observations.

Aggregate energy use of the whole industry sector, single-plant firms, and the median (single) plant. Source: DOI: 10.21242/43531.2003.00.03.1.1.0 to 10.21242/43531.2017.00.03.1.1.0. Own calculations.
2.3 Further Data Sources
The administrative micro-data from the AFiD panels constitute our main data source. We complement those data with information on emission factors. To measure a plant’s carbon emissions, we convert its fuel use and electricity procurement into carbon emissions using emission factors from the German Environment Agency (Umweltbundesamt – UBA). Emission factors for fuel consumption and electricity procurement are taken from the Umweltbundesamt (2020) and Umweltbundesamt (2018b), respectively. The exact emission factors used can be found in Table 5 in the Appendix. Note that all emission factors take conversion losses into account. The emission factor for electricity procurement also includes transmission losses and is therefore larger than the emission factors applied to the primary energy carriers.
In contrast, fuel consumption in AFiD is stated before conversion losses, i.e. implicitly assuming an efficiency of 100 % for extracting the energy content of a fuel. To render fuel consumption numbers comparable across different fuels and electricity procurement (for which no conversion losses occur), we follow the procedure described in Rottner and von Graevenitz (2021). Specifically, we combine the AFiD data with efficiency factors on the conversion from fuels to heat from the EU (2015), as well as with information on fuel inputs and usable energy outputs from the “Survey of electricity producing units in manufacturing” for conversion losses of electricity self-generating manufacturing plants. We correct fuel consumption in AFiD downward to account for the occurrence of conversion losses that differ over time, across sectors and across fuel types, so that our measure of total energy use is not sensitive to changes in the fuel mix.[2]
Finally, we use the commercial producer price index from DeStatis to deflate the monetary values of output (DeStatis 2018). This is necessary when comparing the value of output over time: the value of output can change both because of price changes and because of changes in real output. We use the commercial producer price index from DeStatis at the 3-digit sector-level (NACE codes).
3 Results
3.1 Energy and Fuel Use in the German Manufacturing Sector
Figure 1 depicts the development of the aggregate energy use of the manufacturing sector over time as well as the median energy use. As can be seen, energy use increased substantially between 2003 and 2017. In our cleaned data set, energy use increases from roughly 613 TWh in 2003 to around 769 TWh in 2017, which is an increase of 156 TWh, or approximately 25 %. The 2009 recession in Germany is clearly visible in the data: From 2008 to 2009, energy use decreased by almost 100 TWh, which is equivalent to a 12 % drop as compared to the previous year. However, energy use recovered quickly and returned to pre-crisis levels already in 2010.
In contrast, the median energy use increased only slightly from 822 MWh in 2003 to 838 MWh in 2017 (i.e. a 2 % increase as compared to 2003). This apparently small increase masks substantial variation in annual changes, e.g. the sharp decline of 7 % of the energy use of the median plant from 2013 to 2014. It is not clear what causes this decrease from 2013 to 2014, which is not driven by a change in the number of reporting plants. From 2014 onwards, median energy use remains rather constant. Energy use of the median single-plant firm follows a virtually identical pattern. For single-plant firms the increase in total energy use between 2003 and 2017 is smaller than for the full sample (16 %). This suggests that the increase in total energy use is mostly driven by multi-plant firms. Revenues have been increasing over the same period of time over all deciles of the distribution (see Figure 2). For the average plant, revenues increased by almost 20 % between 2003 and 2017, for the median plant even by 24 %. These numbers are in the same range as the roughly 25 % rise in total energy consumption in manufacturing over the time period.

Revenues of all plants across sectors (mean, median, top and bottom percentiles) in 2015 prices. Source: DOI: 10.21242/42111.2003.00.01.1.1.0 to 10.21242/42111.2017.00.01.1.1.0. Own calculations.
Energy use is very heterogeneous between plants within German manufacturing (see Figure 3). The mean energy use of the German manufacturing plant is consistently higher than the 90th percentile. In other words, the distribution of energy use across plants in the German manufacturing sector is severely right-skewed with a few large users driving the mean above the 90th percentile. This is in line with the findings of Petrick et al. (2011) and has not changed over time. Most of the variation in the energy use of manufacturing plants comes from variation in their fuel use: Electricity use has been pretty constant over time at about 220 TWh, even in the 2009 recession. In contrast, the use of primary fuels by plants has increased significantly over time from 425 TWh in 2003 to 586 TWh in 2017.

Mean, median and dispersion of total energy use by industrial plants between 2003 and 2017. Source: DOI: 10.21242/43531.2003.00.03.1.1.0 to 10.21242/43531.2017.00.03.1.1.0. Own calculations.
While all 42,192 plants in our sample in 2014 used electricity, gas is the most commonly used primary fuel (see Table 1): In 2014, 29,245 plants (and hence nearly 70 % of all manufacturing plants) consumed gas for energetic purposes (e.g. generating heat or electricity).[3] In terms of aggregate energy use, gas was even more important than electricity with a use of 268 TWh as compared to 219 TWh for electricity. Coal constitutes the next most important fuel in terms of aggregate use (108 TWh) even though there are only 414 users. More than a third of all plants use oil, but the aggregate use is just 11 percent of total energy use at 82 TWh. District heating and renewable energy sources are less commonly used: In 2014, 3297 plants used a total of 46 TWh of district heating, whereas 1856 plants used renewable energy sources for energetic purposes with an aggregate use of 25 TWh.
Users and aggregate use of different fuels in 2014.
| Number of users | Aggregate use (TWh) | % of users from total manufacturing plants | |
|---|---|---|---|
| Electricity | 42,192 | 219 | 100 |
| Gas | 29,245 | 268 | 69 |
| Oil | 15,266 | 82 | 36 |
| Coal | 414 | 108 | 1 |
| Heat | 3297 | 46 | 8 |
| Renewables | 1856 | 25 | 4 |
| Others | 128 | 17 | 0 |
-
Source: DOI: 10.21242/43531.2003.00.03.1.1.0 to 10.21242/43531.2017.00.03.1.1.0. Own calculations.
Figure 4 depicts the development of aggregate fuel and electricity use over time. Once again, it is visible that electricity use has remained constant over time. In contrast, consumption of gas and district heating have both increased. However, while gas accounts for a major share of total fuel use, district heating only constitutes a minor share. It is notable that since 2007, the aggregate use of renewable energy sources has not increased substantially.

The consumption of different fuels and electricity over time in all sectors. Source: DOI: 10.21242/43531.2003.00.03.1.1.0 to 10.21242/43531.2017.00.03.1.1.0. Own calculations.
The increase in energy use and the change in the fuel mix in manufacturing over time affect overall carbon emissions. Figure 5 shows the evolution of total carbon emissions from the whole sector, taking account of both indirect emissions from electricity procurement and direct emissions from fuel use. Total carbon emissions have increased from 2003 to 2017, following a path similar to energy use with the 2009 recession constituting a major drop in emissions. Like energy use, however, emissions almost completely rebounded to the pre-crisis level already in 2010.

The development of total emissions from energy use in million tonnes and total energy use in TWh from 2003 to 2017 in all sectors. Source: DOI: 10.21242/43531.2003.00.03.1.1.0 to 10.21242/43531.2017.00.03.1.1.0. Own calculations. For information on the emission factors used for calculating the emissions, see Table 5 in the Appendix.
Interestingly, electricity procurement and the corresponding indirect emissions follow a different pattern (see Figure 5). While the economic crisis in 2009 is also clearly visible for electricity procurement and indirect emissions, both of those variables remain below their pre-crisis levels after 2009. Since electricity consumption is relatively constant over time (see Figure 4), declining electricity procurement after 2009 implies that electricity self-generation must have increased in those years. Indeed, self-generation of electricity has become more important in the manufacturing sector: While self-generated electricity amounted to approximately 31 TWh in 2003, it equalled 54 TWh in 2017, an increase of almost 75 % as compared to 2003. The share of self-generated electricity in total electricity use increased only slightly from 14 % in 2003 to 17 % in 2009. After 2009, however, the respective share increased more strongly to 25 % in 2017.[4]
3.2 Energy and Carbon Intensity
The previous section has shown an upward trend of energy use, but also revenues in the German manufacturing sector. Even though total energy use has increased, energy intensity may have declined in the German manufacturing sector over the years. Petrick et al. (2011) find that between 1995 and 2006, energy intensity decreased almost monotonically: According to their results, the median plant in the manufacturing sector used 18 kWh per 1.000 € of output less in 2002 as compared to 1995. However, they do not account for inflation in their analysis which implies that the decreases in energy intensity are overstated. Figure 6 shows the development of energy intensity between 2003 and 2017, once in current prices and once in deflated prices (2015-prices). We calculate energy intensity as the ratio between total energy use (in kWh) and the value of (deflated) output (in 1.000 €). While the graphs show decreasing trends in energy intensities over all moments of the distribution between 2003 and 2017, these trends are much weaker once inflation is accounted for.[5] The decreasing trend in energy intensity is mostly driven by the last years of the sample from 2014 onwards.

Energy intensity of all plants across sectors (mean, median top and bottom percentiles) in current prices (top) and in 2015 prices (bottom). Source: DOI: 10.21242/43531.2003.00.03.1.1.0 to 10.21242/43531.2017.00.03.1.1.0. and DOI: 10.21242/42111.2003.00.01.1.1.0 to 10.21242/42111.2017.00.01.1.1.0. Own calculations. Information on price deflators are taken from DeStatis (2018).
The intuition provided by the graphs is also supported by regression results reported in Table 2: We regress the logarithm of energy intensity on a linear year-trend, with (and without) plant fixed effects μ i , with standard errors being clustered at the plant level:
If energy intensity has decreased, the coefficient β should take on a negative value. Without plant-level fixed effects, energy intensity has indeed declined by 0.6 percent per year on average. However, using plant fixed effects, the coefficient is close to zero and even slightly positive (β = 0.003) corresponding to an increase in energy intensity of 0.3 percent. The difference between the within-plant regression (with plant fixed effects) and the between-plants regression without fixed effects suggests that the composition of the manufacturing sector has shifted slightly towards less energy intensive plants over time, whereas energy intensity within existing plants has not improved.
Regression of energy and carbon intensity on a linear time trend.
| Energy intensity | Energy intensity | Carbon intensity | Carbon intensity | |
|---|---|---|---|---|
| (1) | (2) | (3) | (4) | |
| year | 0.003c | −0.006b | −0.005c | −0.013c |
| (0.0003) | (0.0005) | (0.0003) | (0.0006) | |
| Plant FE | YES | NO | YES | NO |
| N | 569,367 | 569,367 | 569,367 | 569,367 |
| N groups | 61,843 | - | 61,843 | - |
| R2 | 0.003 | 0.000 | 0.000 | 0.001 |
-
The regressions include observations from 2003 to 2017. The dependent variable is the logarithm of energy intensity (columns (1) and (2)) or carbon intensity (columns (3) and (4)). Standard errors are clustered at the plant level. p-values are in parentheses. a, b and c indicate significance at 10 %, 5 % and 1 %, respectively.
The previous section described how the fuel mix of the German manufacturing sector has changed over time. Fuel switching has allowed the decrease in energy intensity to translate into a stronger decrease in carbon intensities in real terms, as shown in Figure 7. The median of carbon intensity decreased by roughly 14 kg per 1000 € of output between 2003 and 2017; reductions in the upper tail of the distribution (i.e. at the 90th percentile) were larger in absolute terms. Rerunning the regression in Equation (1) for carbon intensity yields a statistically significant and negative coefficient for β of around −0.005, supporting that within-plant carbon intensity has decreased over time: On average, carbon intensity decreased by around 0.5 percent each year. Again, the between-plants regression suggest a larger effect of 1.3 percent decline in carbon intensity per year on average.[6]
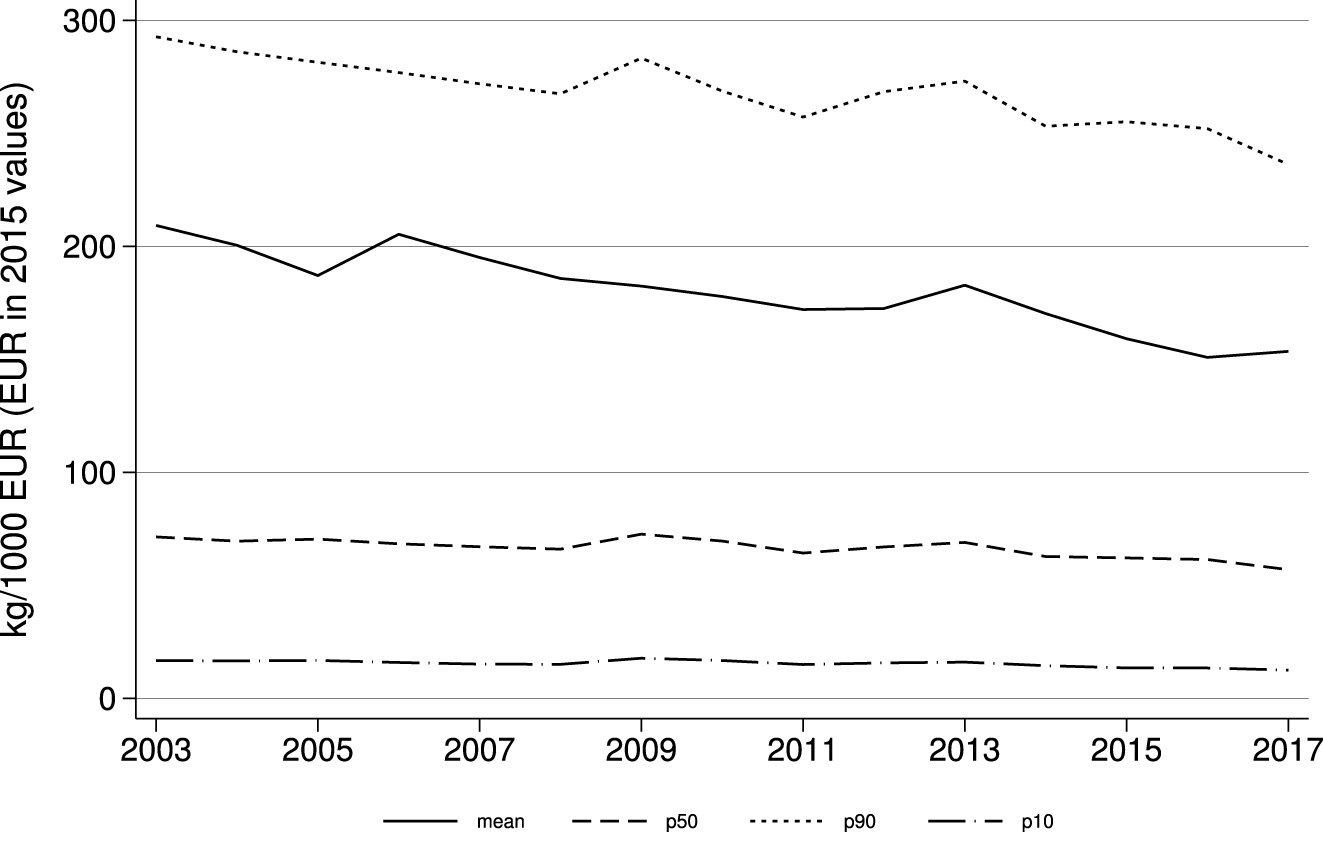
Aggregate carbon intensity of all plants across sectors at 2015 prices. Source: DOI: 10.21242/43531.2003.00.03.1.1.0 to 10.21242/43531.2017.00.03.1.1.0. and DOI: 10.21242/42111.2003.00.01.1.1.0 to 10.21242/42111.2017.00.01.1.1.0. Own calculations. Information on price deflators are taken from DeStatis (2018).
4 Energy Costs in German Manufacturing
Energy is an important input factor in the production process in German manufacturing. However, the share of energy costs on total costs is rather small, as can be seen in Figures 8 and 9, making up 2–3 percent of total costs on average in our sample.[7] , [8]

Development of total costs over time at current prices. Source: DOI: 10.21242/42251.2003.00.01.1.1.0 to 10.21242/42251.2017.00.01.1.1.0. Own calculations. The sample consists of a subsample of firms in the manufacturing sector.

Development of mean, median, top and bottom percentiles of energy cost share from total costs over time. Source: DOI: 10.21242/42251.2003.00.01.1.1.0 to 10.21242/42251.2017.00.01.1.1.0. Own calculations. The sample consists of a subsample of firms in the manufacturing sector.
The costs for resources and intermediates, labour costs and costs for repair, maintenance, rent, retail and others constitute the bulk of costs in the German manufacturing sector. Still, in absolute terms, energy costs have grown substantially over the years: In 2003, the sampled firms in the manufacturing sector spent roughly 19 billion € on energy. In 2017, this number had risen to nearly 28 billion € (in current, not in real prices). This 47 % surge is slightly larger than the roughly 45 % increase in total costs from 1200 billion € in 2003 to 1744 billion € in 2017, leading to an overall small increase in the energy cost share from total costs.
Over time and at different moments of the distribution, the share of energy costs in total costs differs substantially, as shown in Figure 9. Energy cost shares were generally particularly large in 2013 and 2014, after which they have tended to decrease again. The average energy cost share increased by roughly 21 % between 2003 and 2017, the median even by 34 % (albeit from low levels). The increases amount to 26 % and 21 %, respectively, for the 10th and 90th percentile of the distribution. Hence, the energy cost share has not only increased for those plants for whom energy constitutes an important input factor and which already had a relatively high energy cost share in 2003, but the whole distribution is affected.[9]
Since energy intensity follows a downward-sloping trend over time, as discussed in the previous section, it seems likely that increases in the energy cost share are due to increases in energy and electricity prices. In fact prices for gas and oil increased substantially between 2003 and 2008 and returned to a high level after the crisis until 2014 when they again started to fall (see Figure 27 in the Appendix). According to Eurostat, electricity prices consistently increased between 2007 and 2014 largely due to increases in taxes and levies, after which they stagnated or decreased for different consumption bands (see Figure 28 in the Appendix), mimicking the development in energy cost shares from Figure 9.
The fact that the cost share tends to increase, while energy intensity displays an opposing trend suggests that energy demand is responding to energy price increases. However, uncovering exact price elasticities requires further analysis of the response of individual plants to energy costs, see e.g. Gerster and Lamp (2020) or von Graevenitz and Rottner (2022). However, the energy cost share is not necessarily the best measure of the potential impact of rising energy costs on competitiveness of German plants. The “real unit energy cost” (Energiestückkosten) has been used as an indicator in the monitoring process of the energy transition (see e.g. Löschel et al. 2014; Germeshausen and Löschel 2015). This measure relates energy costs to value added, i.e. the energy requirement in Euros to produce one Euro of value added. While it is more informative than the energy cost share alone, the real unit energy cost underestimates the burden as it does not account for “indirect” energy costs embodied in intermediate inputs. Löschel et al. (2015) estimate that the importance of such indirect energy costs has been increasing sharply over time. We find that the median real unit energy cost increased from around 3 cents per Euro value added in 2003 to 4.1 cents per Euro in 2017. For the 90th percentile, the real unit energy cost rose from 14 cents per Euro value added to 17 cents per Euro, with the strongest increase in the period before the financial crisis in 2009.[10]
5 Sectoral Variation in Energy Use and Energy Intensity
The difference between average energy use of plants in the German manufacturing sector and the energy use of plants at the 10th percentile of the distribution of energy use shown in Figure 3 already gave a glimpse of the heterogeneity between manufacturing plants. Petrick et al. (2011) showed that even within more narrowly defined 3-digit sectors, there are large differences between plants. This section examines the sectoral variation in energy use and energy intensity in more detail.[11]
Figure 10 shows the ten 3-digit sectors with the highest median energy intensity in 2014 within German manufacturing. Prominently among the top ten sectors with respect to energy intensity are sectors in the ceramics and cement industry (i.e. NACE code 235, 233, 239, 232 and 234). Also the pulp and paper industry (171) and the textiles industry (133) rank among the sectors with the highest median energy intensity. The list closely resembles the one of Petrick et al. (2011) for the year 2006; the sectors that were the most energy intensive ones in 2006 are the same ones that appear in our list for 2014.
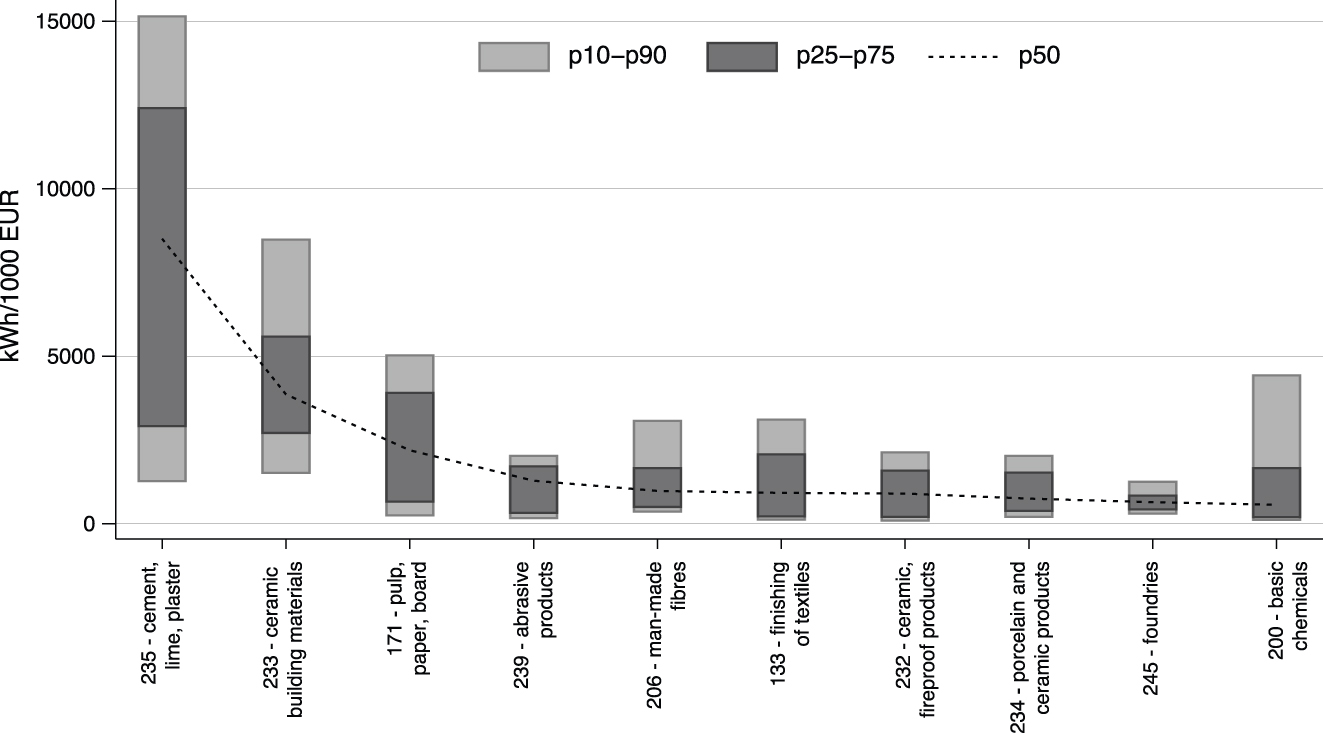
The ten sectors with the highest median energy intensity in 2014. Source: DOI: 10.21242/43531.2003.00.03.1.1.0 to 10.21242/43531.2017.00.03.1.1.0. and DOI: 10.21242/42111.2003.00.01.1.1.0 to 10.21242/42111.2017.00.01.1.1.0. Own calculations. Note that sector “manufacture of coke” (191) is among the top ten sectors with respect to energy intensity, but cannot be shown for confidentiality reasons.
The figure also visualizes the within-sector variation in energy intensity: The light bars display the range between top and bottom quartiles, the darker bars show the range between top and bottom deciles of the distribution of energy intensity across plants within a sector. As can be seen, even within quite narrowly defined 3-digit sectors there is substantial variation in the plants’ energy intensities that cannot be captured by focusing on the average or median energy-intensity of a sector. For example, plants at the 10th percentile of the sector with the highest median energy intensity (manufacture of cement, lime and plaster, NACE code 235) are less energy intensive than the median plant in the sector that ranks fourth with respect to median energy intensity (manufacture of abrasive products and non-metallic mineral products n.e.c., NACE 239). The median cement, lime and plaster plant is more than four times as energy intensive as plants at the 10th percentile in the same sector.
Bivariate correlations show that sectors with higher median energy intensities tend to also have higher median energy uses (correlation coefficient 0.89), higher median emissions (correlation coefficient 0.86) and higher median emission intensities (correlation coefficient 0.99).[12] The correlation between median energy intensity and median electricity share in the energy mix is negative (−0.24), indicating that the energy-intensive sectors rely more heavily on primary fuels. However, it is notable that as compared to the findings of Petrick et al. (2011), the correlation coefficient has decreased to −0.24 in 2017 as compared to −0.4 in 2006. In light of the general increase in onsite-electricity generation, this may indicate that also sectors with a lower median energy intensity are increasingly relying on primary fuels with a corresponding decrease in median electricity shares. We also find positive correlations of the median energy intensity with the median of several production variables (value of output with a correlation coefficient of 0.14, payroll with a coefficient of 0.10, workforce with 0.08). Plausibly, sectors with high energy intensities tend to also be capital intensive, require large investments and therefore generally consist in larger manufacturing plants with high median output.
While the medians of energy use, energy intensities and production variables correlate, there is no clear pattern in the within-sector dispersion (see Figure 11), nor between median energy intensity and the dispersion in energy intensity (as shown in Figure 12). The dispersion of energy intensity and other variables is measured by the interquartile-range-to-median-ratio, i.e. the dispersion of a given variable in a given sector is normalized by the median in order to render the measure comparable across different distributions with different medians.

Dispersion ((p75-p25)/p50) of several key variables for the ten most and five least energy intensive sectors in 2014. Source: DOI: 10.21242/43531.2003.00.03.1.1.0 to 10.21242/43531.2017.00.03.1.1.0. and DOI: 10.21242/42111.2003.00.01.1.1.0 to 10.21242/42111.2017.00.01.1.1.0. Own calculations. Note that sector “manufacture of coke” (191) is among the top ten sectors with respect to energy intensity, but cannot be shown for confidentiality reasons.

Dispersion ((p90-p10)/p50) of energy intensity relative to the median (left) and median of energy intensity (right) for the top ten and bottom five sectors with respect to variation in energy intensity (2014 data). Source: DOI: 10.21242/43531.2003.00.03.1.1.0 to 10.21242/43531.2017.00.03.1.1.0. and DOI: 10.21242/42111.2003.00.01.1.1.0 to 10.21242/42111.2017.00.01.1.1.0. Own calculations. Sectors are ranked according to ((p90-p10)/p50). Note that sector “manufacture of coke” (191) cannot be shown for confidentiality reasons. For “Manufacture of magnetic and optical media” (268), confidentiality allows only to depict the median.
Sectors that are very heterogeneous with respect to energy intensity of plants do not necessarily exhibit a large variation with respect to the plants’ energy use: Computing a simple bivariate correlation yields a correlation coefficient of only around 0.35. The same holds for the value of output, payroll and workforce.[13] Petrick et al. (2011) also found no clear patterns for the year 2006 and this finding still holds in 2014. Moreover, sectors with a high median energy-intensity are not necessarily the sectors where there is large dispersion with respect to energy intensity: While cement, lime and plaster (NACE 235) exhibits the highest median energy intensity in 2014, the within sector variation in energy intensity is larger in the manufacture of irradiation, electromedical and electrotherapeutic equipment (NACE code 266), which belongs to the least energy intensive sectors. Correspondingly, the correlation between the sectors’ median energy intensities and their interquartile-range-to-median-ratio equals −0.04 in 2014. Variation within sectors is substantial, especially with respect to energy use. According to Petrick et al. (2011), this was also the case in 2006.
Sectors within the manufacturing sector are also quite diverse with respect to their fuel mix: Tables 3 and 4 shows the top ten and bottom five sectors with respect to the fuel share of different fuels in their energy mix.[14] Overall, the results confirm the earlier intuition: Sectors that are very energy intensive have lower electricity shares in their energy mix. Both the Cement industry (235) and the Ceramic industry (233) that are among the top five with respect to their energy intensity in 2014 are among those sectors with the lowest electricity share in 2014. As compared to the results by Petrick et al. (2011), it is notable that, while we find the same sectors to be very coal- and oil-intensive, the shares of those fuels in their energy mix has decreased. This is in line with fuel switching in the German manufacturing sector.
The sectors with the highest and lowest respective fuel share in their 2014 energy mix.
| Electricity | Gas | Oil |
|---|---|---|
| 237 – Ornamental/building stone: 76.9 % | 191 – Coke: 94.4 % | 192 – Mineral oil processing: 71.6 % |
| 273 – Wiring, wiring devices: 75.0 % | 233 – Ceramic building materials: 83.6 % | 200 – Basic chemicals, pesticides: 17.1 % |
| 268 – Magnetic/optical media: 72.3 % | 232 – Fireproof ceramics: 80.9 % | 322 – Musical instruments: 15.2 % |
| 324 – Games/toys: 71.5 % | 234 – Porcelain/ceramics: 75.3 % | 143 – Knitted/crocheted apparel: 12.8 % |
| 257 – Cutlery, tools, hardware: 71.1 % | 133 – Finishing of textiles: 74.3 % | 321 – Jewellery: 12.7 % |
| 272 – Batteries/accumulators: 69.6 % | 231 – Glass: 72.2 % | 140 – Wearing apparel/fur: 11.8 % |
| 261 – Electronic components/boards: 69.3 % | 105 – Milk processing: 67.7 % | 237 – Ornamental/building stone: 11.4 % |
| 222 – Plastics products: 68.9 % | 100 – Fruits, vegetables, oils: 64.9 % | 264 – Consumer electronics: 10.4 % |
| 267 – Optical instruments/photographic equipments: 67.0 % | 106 – Grain mill products/starches: 64.7 % | 292 – Bodies/semi-trailers: 10.1 % |
| 281 – General purpose machinery: 66.8 % | 236 – Products of concrete, cement and gypsum: 60.7 % | 331 – Repair of fabricated metal products/machinery: 8.4 % |
| 240 – Basic iron/steel: 15.7 % | 162 – Wooden ware, cork, wickerwork goods: 9.7 % | 171 – Pulp, paper, paperboard: 0.3 % |
| 235 – Cement, lime, plaster: 14.4 % | 261 – Electronic components/boards: 9.4 % | 272 – Batteries/accumulators: 0.2 % |
| 233 – Ceramic building materials: 12.3 % | 237 – Ornamental/building stone: 7.4 % | 206 – Chemical fibres: 0.1 % |
| 192 – Mineral oil processing: 9.7 % | 235 – Cement, lime, plaster: 5.2 % | 268 – Magnetic/optical media: x% |
| 191 – Coke: 5.6 % | 161 – Sawmilling, planing, impregnation of wood: 0.2 % | 191 – Coke: x% |
-
Source: DOI: 10.21242/43531.2003.00.03.1.1.0 to 10.21242/43531.2017.00.03.1.1.0. Own calculations. All shares are computed from sector aggregates, including plants with no fuel use. Sectors with the lowest respective fuel share in 2014 (bottom part of the table) are only shown if distinct from zero. Confidential cases are marked by an x.
The sectors with the highest respective fuel share in their 2014 energy mix.
| Heat | Renewables | Coal | Other fuels |
|---|---|---|---|
| 211 – Basic pharmaceuticals: 56.1 % | 161 – Sawmilling, planing, impregnation of wood: 72.2 % | 240 – Basic iron, steel: 60.4 % | 235 – Cement, lime, plaster: 32.8 % |
| 206 – Chemical fibres: 35.4 % | 162 – Wooden ware, cork, wickerwork goods: 62.9 % | 235 – Cement, lime, plaster: 37.4 % | 171 – Pulp, paper, paperboard: 3.2 % |
| 204 – Soap/detergents: 26.6 % | 310 – Furniture: 29.2 % | 239 – Abrasive/non-metallic mineral products: 36.1 % | 200 – Basic chemicals, pesticides: 3.0 % |
| 291 – Motor vehicles/engines: 22.1 % | 171 – Pulp, paper, paperboard: 14.6 % | 245 – Foundries: 17.1 % | 204 – Soap/detergents: x% |
| 261 – Electronic components/boards: 21.9 % | 322 – Musical instruments: 10.0 % | 108 – Other food products: 15.8 % | 233 – Ceramic building materials: 1.8 % |
| 302 – Railway vehicles: 21.6 % | 172 – Articles of paper/paperboard: x% | 205 – Other chemical products: 13.6 % | 211 – Basic pharmaceuticals: x% |
| 267 – Optical instruments/photographic equipments: 17.6 % | 212 – Pharmaceutical preparations: 5.4 % | 204 – Soap/detergents: x% | 212 – Pharmaceutical preparations: 1.6 % |
| 331 – Repair of fabricated metal products/machinery: 16.5 % | 107 – Bakery/farinaceous products: 5.4 % | 171 – Pulp, paper, paperboard: 7.6 % | 239 – Abrasive/non-metallic mineral products: 0.8 % |
| 212 – Pharmaceutical preparations: 16.0 % | 323 – Sports equipment: 5.3 % | 252 – Metal tanks, boilers, radiators: x% | 192 – Mineral oil processing: x% |
| 100 – Fruits, vegetables, oils: 15.2 % | 252 – Metal tanks, boilers, radiators: x% | 133 – Finishing of textiles: x% | 274 – Electric lighting equipment: x% |
-
Source: DOI: 10.21242/43531.2003.00.03.1.1.0 to 10.21242/43531.2017.00.03.1.1.0. Own calculations. All shares are computed from sector aggregates, including plants with no fuel use. Sectors with the lowest respective fuel share in 2014 are all zero and therefore not depicted. Confidential cases are marked by an x.
6 Conclusions
The manufacturing sector accounts for a substantial share of the German gross domestic product, employment and carbon emissions. Therefore, reducing its energy use and carbon emissions is of crucial importance to Germany’s energy transition. In this paper, we analyse energy use patterns in the German manufacturing sector between 2003 and 2017, using a rich data set of administrative micro-data. We show that energy use has not declined (except briefly during the economic crisis), although the manufacturing sector has been faced with rising energy costs as a share of total costs. We also find that energy intensity in the manufacturing sector follow a decreasing trend at least across plants, owing mostly to developments over the last years of our sample from 2014 onwards. Carbon intensity has declined more strongly between 2003 and 2017. This can be attributed to changes in the fuel mix in the manufacturing sector: In particular, we show that gas has become more important in terms of aggregate use over the period under study. We also observe a substantial increase in electricity self-generation in the manufacturing sector. Whether this shift is due to regulations, e.g. rising electricity charges and exemptions for self-generated electricity, is an important question for future research.
The manufacturing sector remains very heterogeneous in terms of energy use: We confirm the findings by Petrick et al. (2011) and show that sectors within German manufacturing are very different in terms of their energy use, energy intensity and emissions intensity also in 2014. We find that even within 3-digit sectors, plants vary substantially with regards to their energy use behaviour.
Our paper sheds light on how energy use patterns in the manufacturing sector have evolved over time. The extent to which these developments have been driven by policy or fuel prices is, however, unclear. Further research should address the causal impact of individual policy measures and their interaction effects to identify potential for improving policy design and achieving further necessary reductions in carbon emissions.
Funding source: Bundesministerium für Bildung und Forschung
Award Identifier / Grant number: 01LA1815A
Award Identifier / Grant number: 03SFK4Z0
Acknowledgements
We thank Robert Germeshausen, Andreas Gerster, and Ulrich Wagner and an anonymous referee for suggestions and insightful comments. We also thank participants of the seminars at the ZEW–Leibniz Centre for European Economic Research. We gratefully acknowledge the Research Data Centre (FDZ) of the Federal Statistical Office and the Statistical Offices of the German Länder for granting us access to the AFiD data and for the use of their research facilities, in particular Michael Rößner, Stefan Seitz, Kathrin Stief, Kerstin Stockmayer and Diane Zabel for their advice and technical support.
-
Research funding: We thank the Federal Ministry of Education and Research (BMBF) for the financial support through the Kopernikus-Project ENavi (Grant number 03SFK4Z0) and TRACE (Grant number 01LA1815A). The views expressed in this paper are those of the authors and do not necessarily represent those of the institutions mentioned above.
Appendix
A.1 Tables
Emission factors for different fuels and electricity procured.
| All years | 2003 | 2004 | 2005 | 2006 | 2007 | 2008 | 2009 | 2010 | 2011 | 2012 | 2013 | 2014 | 2015 | 2016 | 2017 | |
|---|---|---|---|---|---|---|---|---|---|---|---|---|---|---|---|---|
| Electricity | 638 | 617 | 616 | 622 | 640 | 602 | 580 | 570 | 572 | 595 | 606 | 593 | 575 | 572 | 533 | |
| District heata | 332.4 | |||||||||||||||
| Natural gas/associated gas | 201.2 | |||||||||||||||
| Liquified gas | 233.8 | 234.9 | 235.1 | 235.3 | 239.8 | 234.8 | 234.9 | 235.2 | 235.4 | 235.4 | 235.5 | 235.7 | 238.8 | 238.8 | 238.8 | |
| Light fuel oil | 266.5 | |||||||||||||||
| Hard coal | 337.9 | 338 | 337.9 | 338.2 | 337.7 | 339.5 | 338.8 | 338.5 | 339.2 | 337.2 | 336.1 | 336.8 | 336.6 | 336.8 | 336.1 | |
| Coke | 389.3 | |||||||||||||||
| Raw lignite | 392.8 | 393.2 | 389.6 | 386.3 | 386.5 | 383.3 | 381.8 | 382.8 | 381.7 | 377.9 | 378.5 | 373.6 | 374.2 | 380.9 | 382.5 | |
| Brown coal briquettes | 356.4 | 357.4 | 357.4 | 356.4 | 358.7 | 359.4 | 357.7 | 356.4 | 357.4 | 357.4 | 356.7 | 358.4 | 357.8 | 358.3 | 357.5 | |
| Heavy fuel | 287.1 | 287.1 | 286.4 | 286.9 | 287.2 | 288.3 | 284.2 | 286.9 | 287.5 | 288.2 | 288 | 292.8 | 291.2 | 293.9 | 291 | |
| Other coal productsb | 276.1 | |||||||||||||||
| Other petroleum productsc | 277.2 | 277.7 | 277.1 | 277.2 | 277.7 | 278.2 | 281.6 | 284.9 | 282.2 | 282.5 | 281.8 | 282.9 | 284.7 | 280.8 | 298.5 | |
| Renewables | 0d | |||||||||||||||
| Other gas productse | 332.7 | 332.6 | 327.2 | 330.8 | 323.9 | 331.4 | 339.3 | 333 | 338.5 | 337.2 | 334.1 | 331.1 | 335.2 | 330.9 | 332.2 | |
| Industrial waste and other fuels | 256 | 256 | 256.1 | 256.1 | 256.1 | 256.1 | 256 | 256 | 256 | 256 | 256 | 256 | 256 | 256 | 256 |
-
aEmission factors for heat are taken from Umweltbundesamt (2018a). This publication contains emission factors for the years 2000 and 2005; since it is not clear whether this yields more reliable emission factors, we abstain from extrapolating the emission factors between 2000 and 2005 and just use the 2005 emission factor. Measurement error with respect to the emission factor for district heat should not have large consequences, since per year less than 3.500 plants use heat (before data cleansing). bThe emission factor is calculated by taking the average of the emission factors from hard coal briquettes, other coal products, brown coal coke, fluidized bed coal and pulverized coal. Since it is not clear to which weights those coal products are contained in the variable “other coal products”, we use a simple unweighted average here. Less than 250 plants per year consume other coal products. cThe emission factor is obtained by taking the unweighted average of the emission factors of other petroleum products, diesel oil, refinery gas and petroleum coke. Users of other petroleum products amount to less than 210 per year. dFor renewable energy sources, we use an emission factor of 0. While in principle, also burning biomass or landfill gas is associated with emissions, hydropower or solar power do not cause emissions. From our data, it is hard to distinguish those cases and to assign an appropriate emission factor. Therefore we use an emission factor of 0 as has also been done in previous studies (e.g. Petrick et al. 2011). eThe emission factors consist of unweighted averages of the emission factors of coke oven gas, blast furnace and converter gas, other gases and mine gas. Weights on the different components of “other gas products” are unavailable. However, other gas products are used by few plants in any case (maximally 50 plants per year).
List of merged sectors.
| Merged sector code | Original sector code |
|---|---|
| 100 | The fruit and vegetable processing industry (103) |
| Manufacture of vegetable and animal oils and fats (104) | |
| 120 | Beverage production (110) |
| Tobacco processing (120) | |
| 140 | Manufacture of wearing apparel, except fur apparel (141) |
| Manufacture of articles of fur (142) | |
| 180 | The production of printing products (181) |
| The reproduction services of recorded media (182) | |
| 200 | Manufacture of basic chemicals, fertilisers and nitrogen compounds, plastics and synthetic rubber in |
| Primary forms (201) | |
| Manufacture of pesticides and other agro-chemical products (202) | |
| 240 | Manufacture of basic iron and steel and of ferro-alloys (241) |
| Manufacture of tubes, pipes, hollow profiles and related fittings of steel (242) | |
| 303 | Manufacture of air and spacecraft and related machinery (303) |
| Manufacture of military fighting vehicles (304) |
Correlation of sector heterogeneity between selected variables.
| Correlation of heterogeneity (p90-10)/p50 | Total energy use | Energy intensity | Value of output | Electricity share | Carbon intensity | Workforce | Payroll |
|---|---|---|---|---|---|---|---|
| Total energy use | 1 | ||||||
| Energy intensity | 0.35c | 1 | |||||
| Value of output | 0.57c | 0.13c | 1 | ||||
| Electricity share | 0.16c | 0.14c | 0.01 | 1 | |||
| Carbon intensity | 0.32c | 0.98c | 0.15c | 0.12c | 1 | ||
| Workforce | 0.25c | −0.00 | 0.68c | 0.22c | 0.03c | 1 | |
| Payroll | 0.24c | 0.02c | 0.76c | 0.11c | 0.05c | 0.95c | 1 |
-
a, b and c indicate significance at 10 %, 5 % and 1 %, respectively. Source: DOI: 10.21242/43531.2003.00.03.1.1.0 to 10.21242/43531.2017.00.03.1.1.0. and DOI: 10.21242/42111.2003.00.01.1.1.0 to 10.21242/42111.2017.00.01.1.1.0. Own calculations.
A.2 Figures

Aggregate energy intensity in current prices for the sample for which price deflators are available. Source: DOI: 10.21242/43531.2003.00.03.1.1.0 to 10.21242/43531.2017.00.03.1.1.0. and DOI: 10.21242/42111.2003.00.01.1.1.0 to 10.21242/42111.2014.00.01.1.1.0. Own calculations. The sectors 131, 133, 254, 256, 268, 301, 303, 304, 329, 331 and 332 are not included/not included for the whole time period in this graph.

Distribution of log-energy intensity at 2015 prices in 2003, 2009 and 2014. Source: DOI: 10.21242/43531.2003.00.03.1.1.0 to 10.21242/43531.2017.00.03.1.1.0. and DOI: 10.21242/42111.2003.00.01.1.1.0 to 10.21242/42111.2017.00.01.1.1.0. Own calculations. The graph depicts the Kernel-density of the logarithm of deflated energy intensity. Information on price deflators are taken from DeStatis (2018).
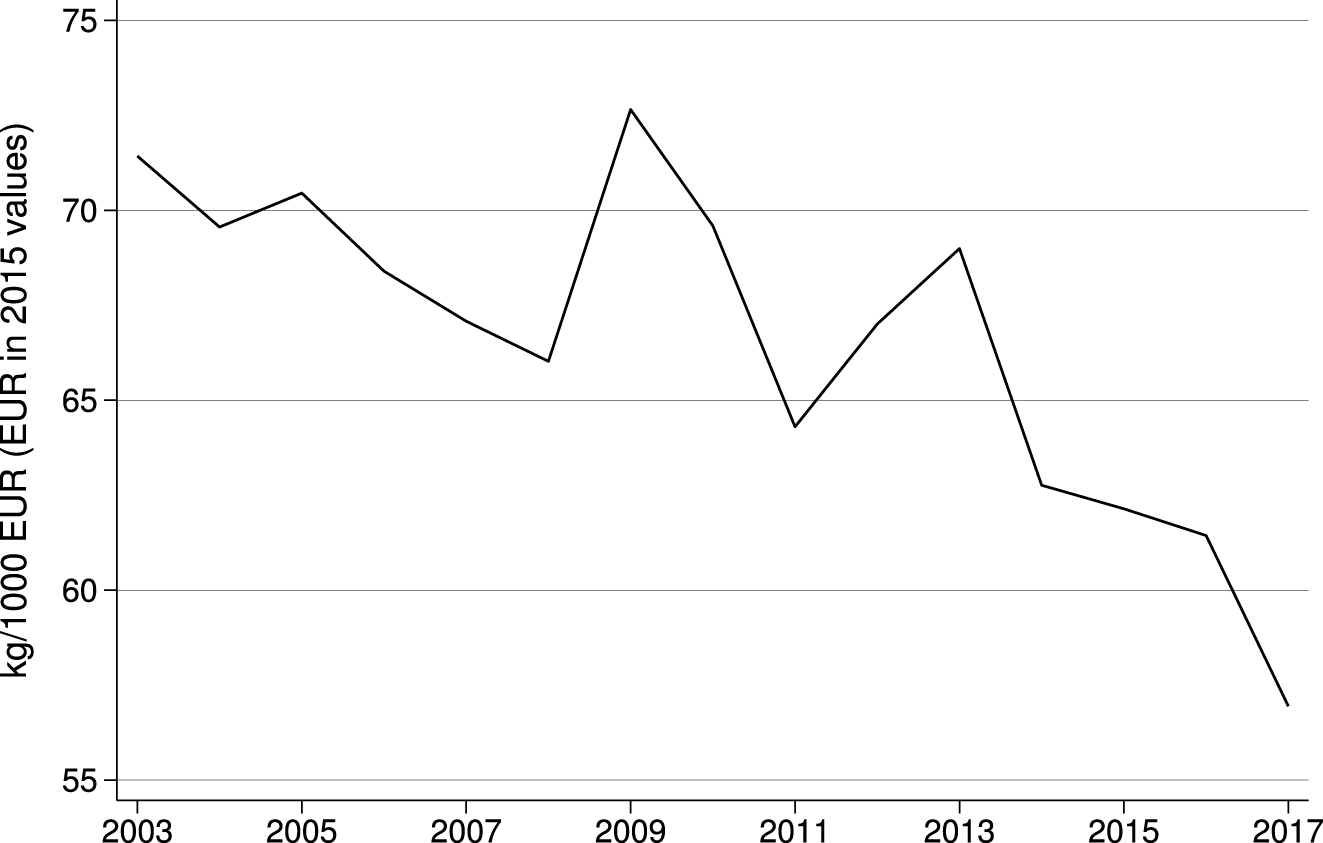
Development of median carbon intensity over time at 2015 prices. Source: DOI: 10.21242/43531.2003.00.03.1.1.0 to 10.21242/43531.2017.00.03.1.1.0. and DOI: 10.21242/42111.2003.00.01.1.1.0 to 10.21242/42111.2017.00.01.1.1.0. Own calculations. Information on price deflators are taken from DeStatis (2018).

Distribution of log-carbon intensity at 2015 prices in 2003, 2009 and 2014. Source: DOI: 10.21242/43531.2003.00.03.1.1.0 to 10.21242/43531.2017.00.03.1.1.0. and DOI: 10.21242/42111.2003.00.01.1.1.0 to 10.21242/42111.2017.00.01.1.1.0. Own calculations. The graph depicts the Kernel-density of the logarithm of deflated carbon intensity. Information on price deflators are taken from DeStatis (2018).

Distribution of log-energy share from total costs for 2007 and 2014. Source: DOI: 10.21242/42251.2003.00.01.1.1.0 to 10.21242/42251.2017.00.01.1.1.0. Own calculations. The graph depicts the Kernel-density of the log-energy share from total costs. The sample consists in a subsample of firms in the German manufacturing sector.

Distribution of log-real unit energy costs for 2007, 2010 and 2014. Source: DOI: 10.21242/42251.2003.00.01.1.1.0 to 10.21242/42251.2017.00.01.1.1.0. Own calculations. The graph depicts the Kernel-density of the log of real unit energy cost for the years 2007, 2010 and 2014. The sample consists of the subsample of firms in the German manufacturing sector reporting in the cost structure survey.

The ten sectors with the highest median energy use in 2014. Source: DOI: 10.21242/43531.2003.00.03.1.1.0 to 10.21242/43531.2017.00.03.1.1.0. and DOI: 10.21242/42111.2003.00.01.1.1.0 to 10.21242/42111.2017.00.01.1.1.0. Own calculations. Note that sector “manufacture of coke” (191) is among the top ten sectors with respect to energy use, but cannot be shown for confidentiality reasons.

The ten sectors with the highest median carbon intensity in 2014. Source: DOI: 10.21242/43531.2003.00.03.1.1.0 to 10.21242/43531.2017.00.03.1.1.0. and DOI: 10.21242/42111.2003.00.01.1.1.0 to 10.21242/42111.2017.00.01.1.1.0. Own calculations. Note that sector “manufacture of coke” (191) is among the top ten sectors with respect to carbon intensity, but cannot be shown for confidentiality reasons.

The five sectors with the lowest median energy intensity in 2014. Source: DOI: 10.21242/43531.2003.00.03.1.1.0 to 10.21242/43531.2017.00.03.1.1.0. and DOI: 10.21242/42111.2003.00.01.1.1.0 to 10.21242/42111.2017.00.01.1.1.0. Own calculations.

The five sectors with the lowest median energy use in 2014. Source: DOI: 10.21242/43531.2003.00.03.1.1.0 to 10.21242/43531.2017.00.03.1.1.0. Own calculations.

The five sectors with the lowest median carbon intensity in 2014. Source: DOI: 10.21242/43531.2003.00.03.1.1.0 to 10.21242/43531.2017.00.03.1.1.0. and DOI: 10.21242/42111.2003.00.01.1.1.0 to 10.21242/42111.2017.00.01.1.1.0. Own calculations.

The ten sectors with the highest median electricity share in their 2014 energy mix. Source: DOI: 10.21242/43531.2003.00.03.1.1.0 to 10.21242/43531.2017.00.03.1.1.0. Own calculations. For “Manufacture of magnetic and optical media” (268), confidentiality allows only to depict the median.

The five sectors with the lowest median electricity share in their 2014 energy mix. Source: DOI: 10.21242/43531.2003.00.03.1.1.0 to 10.21242/43531.2017.00.03.1.1.0. and DOI: 10.21242/42111.2003.00.01.1.1.0 to 10.21242/42111.2017.00.01.1.1.0.Own calculations. Note that sector “manufacture of coke” (191) is among the bottom five sectors with respect to the electricity share in the energy mix, but cannot be shown for confidentiality reasons.

The ten sectors with the highest median natural gas share in their 2014 energy mix. Source: DOI: 10.21242/43531.2003.00.03.1.1.0 to 10.21242/43531.2017.00.03.1.1.0. Own calculations.

Fuel prices for gas, hard coal and oil. Fuel prices for gas, hard coal and oil from 2003 until 2018. The prices on gas and hard coal come from the website of the Federal Office for Economic Affairs and Export Control (BAFA). The prices for oil come from the US Energy Information Administration (EIA) website.

The development of electricity prices for different consumption bands. Source: Eurostat time series nrg_pc_205 and nrg_pc_205_c.
References
AG Energiebilanzen e.V (2022). Auswertungstabellen zur Energiebilanz Deutschland – Daten für die Jahre von 1990 bis 2021. AG Energiebilanzen e.V, Berlin.Suche in Google Scholar
DeStatis (2018). Erzeugerpreisindex gewerblicher Produkte, Available at: https://www.destatis.de/DE/Themen/Wirtschaft/Preise/Erzeugerpreisindex-gewerbliche-Produkte/_inhalt.html.Suche in Google Scholar
DeStatis (2022a). Basistabelle Bruttowertschöpfung: Produzierendes Gewerbe, Available at: https://www.destatis.de/DE/Themen/Laender-Regionen/Internationales/Thema/Tabellen/Basistabelle_IndWertschoepfung.html.Suche in Google Scholar
DeStatis (2022b). Erwerbstätige und Arbeitnehmer nach Wirtschaftsbereichen (Inlandskonzept) 1 000 Personen, Available at: https://www.destatis.de/DE/Themen/Arbeit/Arbeitsmarkt/Erwerbstaetigkeit/Tabellen/arbeitnehmer-wirtschaftsbereiche.html.Suche in Google Scholar
EU (2015). Commission delegated regulation 2015/2402 of 12 October 2015 reviewing harmonised efficiency reference values for separate production of electricity and heat in application of Directive 2012/27/EU of the European parliament and of the council and repealing commission implementing decision 2011/877/EU.Suche in Google Scholar
Germeshausen, R. and Löschel, A. (2015). Energiestückkosten als Indikator für Wettbewerbsfähigkeit. Wirtschaftsdienst 95: 46–50, https://doi.org/10.1007/s10273-015-1776-0.Suche in Google Scholar
Gerster, A. and Lamp, S. (2020). Energy tax exemptions and industrial production. In: Working paper.10.2139/ssrn.3841576Suche in Google Scholar
Löschel, A., Erdmann, G., Staiss, F., and Ziesing, H.-J. (2014). Stellungnahme zum ersten Fortschrittsbericht der Bundesregierung für das Berichtsjahr 2013. ZEW – Leibniz Centre for European Economic Research, Mannheim.Suche in Google Scholar
Löschel, A., Kaltenegger, O., and Baikowski, M. (2015). Die Rolle der indirekten Energiekosten im deutschen Produzierenden Gewerbe. Wirtschaftsdienst 95: 837–844, https://doi.org/10.1007/s10273-015-1911-y.Suche in Google Scholar
Petrick, S., Rehdanz, K., and Wagner, U.J. (2011). Energy use patterns in German industry: evidence from plant-level data. Jahrb. Natl. Stat. 231: 379–414, https://doi.org/10.1515/jbnst-2011-0306.Suche in Google Scholar
Rottner, E. and von Graevenitz, K. (2021). What drives carbon emissions in German manufacturing: scale, technique or composition? In: ZEW discussion paper (21-027).10.2139/ssrn.3805650Suche in Google Scholar
Umweltbundesamt (2018a). Bestimmung spezifischer Treibhausgas-Emissionsfaktoren für Fernwärme. In: Climate change 08/08.Suche in Google Scholar
Umweltbundesamt (2018b). Entwicklung der spezifischen Kohlendioxid-Emissionen des deutschen Strommix in den Jahren 1990–2017. In: Climate change 11/2018.Suche in Google Scholar
Umweltbundesamt (2020). Carbon dioxide emissions for the German atmospheric emission reporting 1990-2018. Umweltbundesamt, Dessau.Suche in Google Scholar
Umweltbundesamt (2022). Trendtabellen Treibhausgase nach Sektoren. Umweltbundesamt, Dessau.Suche in Google Scholar
von Graevenitz, K. and Rottner, E. (2022). Do manufacturing plants respond to exogenous changes in electricity prices? Evidence from administrative micro-data. In: ZEW discussion paper (22-038).10.2139/ssrn.4251564Suche in Google Scholar
Supplementary Material
This article contains supplementary material (https://doi.org/10.1515/jbnst-2022-0031).
© 2023 the author(s), published by De Gruyter, Berlin/Boston
This work is licensed under the Creative Commons Attribution 4.0 International License.
Artikel in diesem Heft
- Frontmatter
- Editorial
- Empirical Studies with Micro-Data from Official Statistics in Germany
- Special Issue Articles
- German Firms in International Trade: Evidence from Recent Microdata
- Localising the Upper Tail: How Top Income Corrections Affect Measures of Regional Inequality
- Energy Use Patterns in German Manufacturing from 2003 to 2017
- What Does the German Minimum Wage Do? The Impact of the Introduction of the Statutory Minimum Wage on the Composition of Low- and Minimum-Wage Labour
- Data Observer
- Micro Data on Robots from the IAB Establishment Panel
- The German Local Population Database (GPOP), 1871 to 2019
- Corona Monitoring Nationwide (RKI-SOEP-2): Seroepidemiological Study on the Spread of SARS-CoV-2 Across Germany
- The ZEW Financial Market Survey Panel