What Determines COVID-19 Vaccination Rates in Germany?
-
Maximilian Ambros

 und
Michael Frenkel
und
Michael Frenkel

Abstract
We study the driving forces behind COVID-19 vaccination in German counties using a cross-sectional and a panel approach. We identify several factors that have a significant impact on vaccination rates. Our results are robust to different model specifications.
1 Introduction
With an official global death toll of 5.3 million people or almost 0.1% of the world’s population by November 2021, COVID-19 is one of the deadliest pandemics ever recorded (Radtke 2021). As the numbers continued to rise, governments around the world took various measures to slow the spread of the disease in order to flatten the curve of infected people. At the same time, pharmaceutical companies had a strong incentive to develop vaccines against COVID-19. The pace of development was unprecedented: as of December 2021, 137 vaccines were in clinical development, and 194 vaccines were in preclinical development (WHO 2021). Vaccination was declared a public good and began in several countries in December 2020, and by mid-2021, approximately four billion doses of vaccines had been administered worldwide. However, the pace of vaccination varies widely among countries and also within countries. In Germany, for example, 61.6% of the population in Saxonia had received their first dose by December 10, 2021, compared with 84.5% in Bremen. With identical administration models, such a difference of more than 20 percentage points may seem surprising. On the county level, the differences are even greater. Figure 1 illustrates these differences.
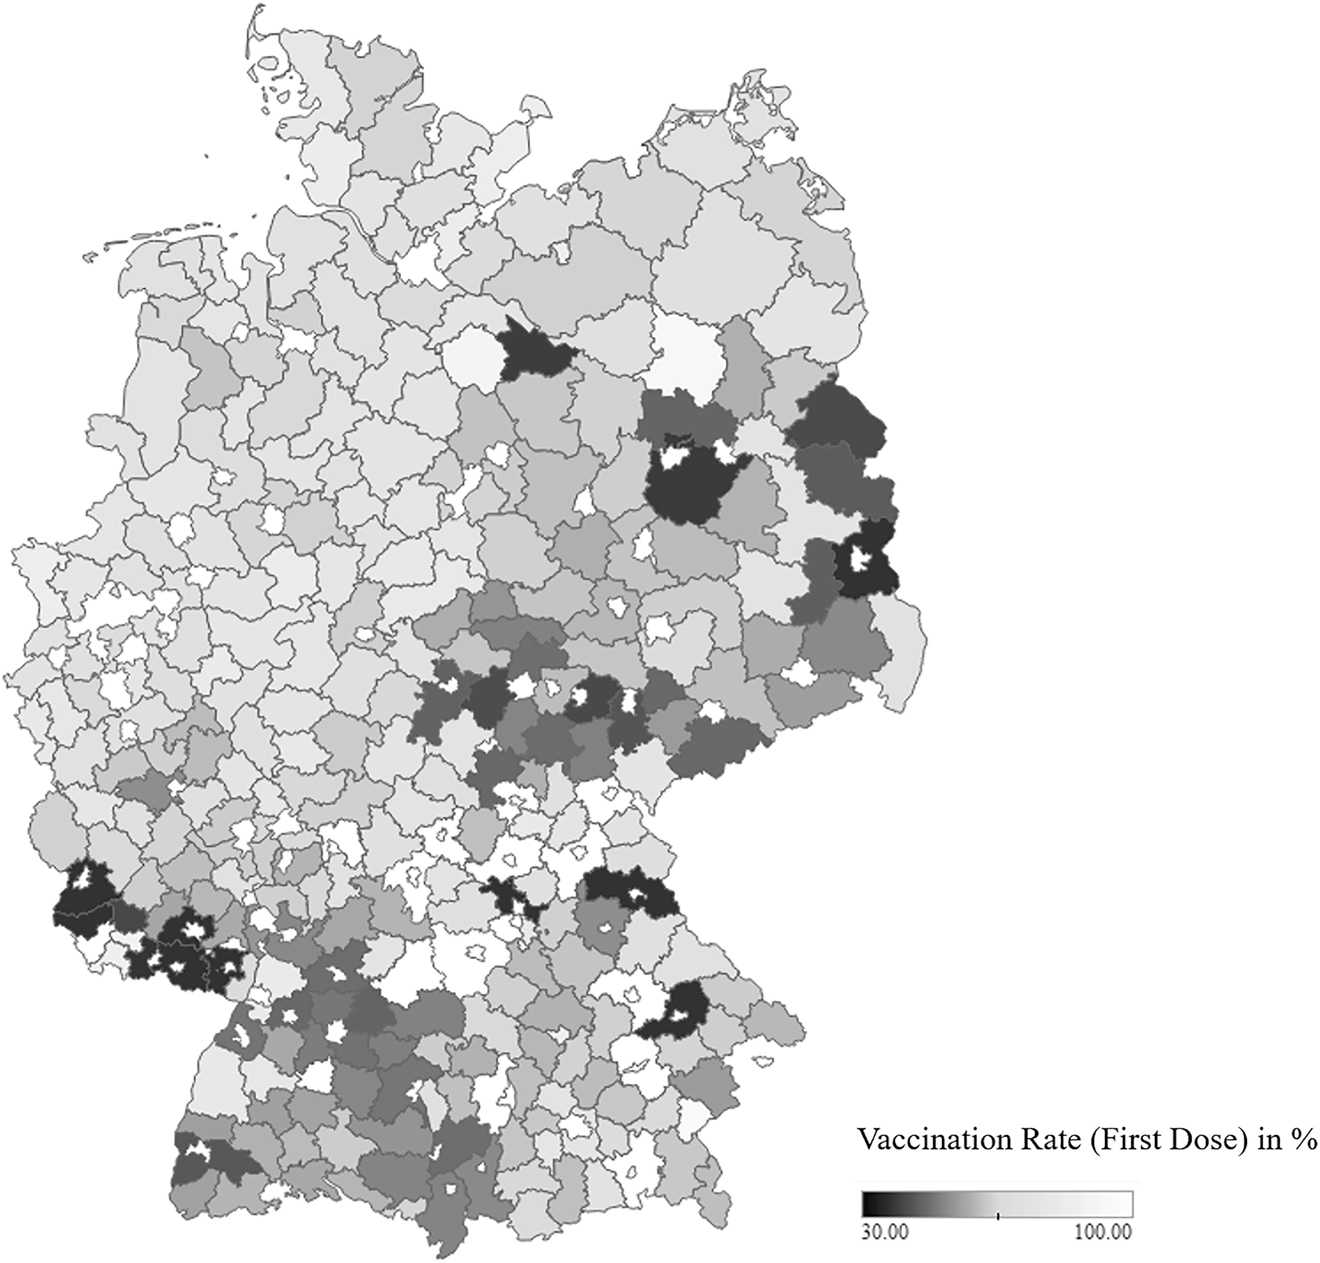
Vaccination rates in German counties as of November 30, 2021 (first dose). Map data copyrighted by OpenStreetMap contributors and available at https://www.openstreetmap.org.
While several research papers focus on the impact of COVID-19 on financial markets,[1] labor markets,[2] and trade,[3] few papers examine the vaccination process. Existing studies on COVID-19 vaccinations use cross-sectional data on vaccination intentions collected in online surveys (e.g., Baumgaertner et al. 2020; Dodd et al. 2021; Graeber et al., 2021). Vaccination is a sensitive topic in public debate and, thus, social desirability could influence survey responses. To circumvent this potential problem, we use data on actual vaccinations to study the driving forces behind vaccination. To our knowledge, this is the first study to analyze actual vaccination outcomes.
We use data from more than 300 counties in Germany and construct one cross-sectional model that explains vaccination rates as of November 30, 2021. We also construct a panel model that tracks the changes in vaccination rates between January and November 2021. We find several factors that could explain differences in vaccination rates across counties.
2 Data and Methodology
We use a cross-sectional dataset of COVID-19 data we compiled from the following sources: Data on COVID-19 cases and deaths are from the Robert Koch-Institut (RKI 2021a), county-level vaccination data are from the RKI as well (RKI 2021b), and county-level per-capita income data as well as population density data are from the German income account statistics (Volkswirtschaftliche Gesamtrechnungen der Länder 2021).
Our study applies two approaches to identify the factors that determine vaccination rates. First, using a cross-sectional approach, we focus on different states and counties in Germany as of November 30, 2021. Second, we use a panel approach to examine the German counties’ change of monthly vaccination rates. Identifying supply- and demand-side factors is beyond the scope of our paper. The first vaccinations in Germany took place at the end of December 2020, and there was presumably a supply shortage in the first half of 2021. In the second half of 2021, vaccine supply was sufficient, but the demand was probably the bottleneck. However, this might not be the case in each county, and the data does not allow us to make such distinctions.
We examine the impact of the location of German counties on the percentage of individuals who received the first dose (FirstDose). People can get vaccinated in counties other than their residency, and some counties might not even have vaccination centers. For example, the FirstDose in Bayreuth county is only 25.2%, while it is 125.1% in the city of Bayreuth. Bayreuth county surrounds the city of Bayreuth and does not have a vaccination center, so citizens of Bayreuth county often receive their vaccination in the city of Bayreuth. To address this issue, we decided to delete all observations where FirstDose is not within one standard deviation of the mean (i.e., between 41.96 and 95.03%). Our baseline model has the following form:
where Deaths measures the death rate as a percentage of COVID-19 cases the pandemic began in March 2020, Physicians measures the physician density (number of physicians per 100,000 population), Seniors measures the share of people over the age of 65, and Foreigners measures the proportion of foreign residents in a county. Existing surveys suggest that vaccination rates should increase with income (Graeber et al. 2021) and population density, as the willingness to vaccinate appears to be higher among people living in cities (“Hesitancy in numbers” 2021). To that end, we also estimate one model specification with population density as an additional variable. We do not include income at the same time due to multicollinearity concerns. We hypothesize that the vaccination rate increase with mortality rates, as one can interpret mortality rates as a measure of disease severity in a county.
Within Germany, there are significant differences in vaccination rates and mortality rates. For instance, the mortality rate ranges from 0.65% in the city of Zweibrücken to 3.96% in Tirschenreuth. Equation (1) does not take into account the location of a county. To account for location differences, we add location dummies to our model:
where Loc is a location dummy variable that we use in two different specifications. First, we use dummy variables for each state except for the city-states Berlin and Hamburg, since these consist of only one county. Second, we use only one dummy variable, which indicates whether the federal state was part of Eastern Germany before the reunification.
To capture changes over time, we examine the change of monthly vaccination rates of the German counties in a panel approach. We analyze the monthly difference in the proportion of first doses administered (ΔFirstDose) between January and November 2021:
Here, Physicians, Seniors, and Foreigners are defined as before and do not change over time. To account for the dynamics of infections, we create a variable called Deaths, which measures the relative deaths (as a percentage of the population) over the past three months. Again, we first estimate the model in Eq. (3) as a baseline model and then add our two forms of location specifications.
3 Estimation Results
The results of the cross-sectional analysis using OLS (Table 1) show that COVID-19 death rate in a county has a significant positive estimated coefficient in all four model specifications. This is empirical evidence that the local severity of COVID-19 matters for vaccination decisions. Furthermore, physician density has a significant positive parameter estimate. This variable likely measures various aspects of the local health system, such as the quality of care or population health awareness and supply-side factors such as the number of vaccine doses delivered. The proportion of seniors positively affects vaccination rates in Models 2 and 4, whereas the proportion of foreigners has a negative estimated coefficient in these two models. Furthermore, the population density has a positive and significant effect on vaccination rates in Model 4.
Regression results of first dose vaccination rates in German counties.
| Model 1 | Model 2 | Model 3 | Model 4 | |
|---|---|---|---|---|
| Constant | 45.671*** | 31.890*** | 40.767*** | 33.880*** |
| (5.619) | (5.972) | (7.792) | (6.024) | |
| COVID-19 death rate | 2.486** | 2.643*** | 2.311** | 2.509*** |
| (1.025) | (0.942) | (0.927) | (0.944) | |
| Physician density | 0.120*** | 0.139*** | 0.112*** | 0.126*** |
| (0.013) | (0.013) | (0.013) | (0.015) | |
| Share of population >65 years old | −0.180 | 0.435* | 0.365 | 0.476* |
| (0.247) | (0.260) | (0.233) | (0.261) | |
| Share of foreigners | −0.061 | −0.246* | 0.067 | −0.381*** |
| (0.131) | (0.125) | (0.131) | (0.144) | |
| Population density | 0.002* | |||
| (0.001) | ||||
| East | −9.490*** | −10.143*** | ||
| (1.701) | (1.768) | |||
| State-level effects | ||||
| Brandenburg | −5.936 (6.111) | |||
| Baden-Württemberg | −15.182*** (5.173) | |||
| Bayern | −7.048 (5.018) | |||
| Hessen | −7.686 (4.951) | |||
| Mecklenburg-Vorpommern | −7.678 (5.166) | |||
| Niedersachsen | −3.883 (4.930) | |||
| Nordrhein-Westfalen | −2.232 (4.870) | |||
| Rheinland-Pfalz | −7.211 (5.204) | |||
| Schleswig-Holstein | 0.610 (5.433) | |||
| Saarland | 7.830 (7.209) | |||
| Sachsen | −16.084*** (5.347) | |||
| Sachsen-Anhalt | −12.796** (5.118) | |||
| Thüringen | −17.580*** (6.096) | |||
| Number of observ. | 328 | 328 | 326 | 328 |
| R 2 | 0.25 | 0.32 | 0.48 | 0.33 |
-
The table shows the regression results for Models 1–4, in which the endogenous variable is the first dose vaccination rate; heteroscedasticity-robust standard errors in parentheses. In Model 2, the reference category refers to the state of Bremen. The city-states Berlin and Hamburg have been excluded from Model 2 as they contain only one county. *, **, and ***Indicate significance at the 10%, 5%, and 1% level, respectively.
The estimation results also provide empirical evidence of location effects. The dummy variable East has a large negative coefficient and is highly significant. The effect is estimated as a decrease in the vaccination rate of −9.49 percentage points in Model 2 and −10.14 percentage points in Model 4. In the model including state-level effects (Model 3), we estimate large negative coefficients for Baden-Württemberg, Saxony, Saxony-Anhalt, and Thuringia. These are four out of the five states with the lowest vaccination rates in Germany as of November 30, 2021.
Table 2 presents the results of the panel data analysis using pooled OLS. The results confirm our findings for the cross-sectional case. The number of deaths in the three months preceding a vaccination period has a positive and significant parameter estimate. Physician density also has a significant positive estimated coefficient. The effect of East is also negative and significant in the panel context. Our results are robust to the choice of estimators (e.g., random effects and fixed effects).
Regression results of monthly change of first dose vaccination rates in German counties.
| Model 1 | Model 2 | Model 3 | Model 4 | |
|---|---|---|---|---|
| Constant | −0.328 | −1.429*** | −0.932 | −1.186** |
| (0.498) | (0.528) | (0.644) | (0.541) | |
| COVID-19 deaths p.m. (last 3 months) | 0.092* | 0.162*** | 0.337*** | 0.174*** |
| (0.052) | (0.048) | (0.048) | (0.050) | |
| Physician density | 0.008*** | 0.010*** | 0.008*** | 0.009*** |
| (0.001) | (0.001) | (0.001) | (0.002) | |
| Share of population >65 years old | 0.025 | 0.072*** | 0.057*** | 0.074*** |
| (0.018) | (0.021) | (0.019) | (0.021) | |
| Share of foreigners | 0.015 | −0.007 | 0.014 | −0.024 |
| (0.014) | (0.014) | (0.013) | (0.016) | |
| Population density | 0.0002* | |||
| (0.0001) | ||||
| Time Dummies | ||||
| February | 0.438*** (0.075) | 0.453*** (0.075) | 0.567*** (0.076) | 0.466*** (0.075) |
| March | 4.511*** (0.158) | 4.541*** (0.154) | 4.716*** (0.149) | 4.558*** (0.153) |
| April | 13.061*** (0.214) | 13.087*** (0.209) | 13.250*** (0.203) | 13.103*** (0.208) |
| May | 11.727*** (0.195) | 11.750*** (0.195) | 11.915*** (0.190) | 11.766*** (0.194) |
| June | 7.099*** (0.168) | 7.140*** (0.171) | 7.328*** (0.175) | 7.157*** (0.171) |
| July | 3.093*** (0.154) | 3.182*** (0.151) | 3.486*** (0.146) | 3.205*** (0.150) |
| August | 0.654*** (0.112) | 0.752*** (0.106) | 1.095*** (0.106) | 0.780*** (0.109) |
| September | 0.033 (0.098) | 0.121 (0.092) | 0.436*** (0.092) | 0.147 (0.094) |
| October | −0.810*** (0.085) | −0.749*** (0.080) | −0.499*** (0.079) | −0.727*** (0.080) |
| November | −0.247*** (0.069) | −0.278*** (0.069) | −0.258*** (0.074) | −0.272*** (0.068) |
| East | −0.750*** | −0.833*** | ||
| (0.164) | (0.174) | |||
| State-level effects | ||||
| Brandenburg | −1.366*** (0.518) | |||
| Baden-Württemberg | −1.212*** (0.352) | |||
| Bayern | −0.579* (0.330) | |||
| Mecklenburg-Vorpommern | −0.353 (0.364) | |||
| Niedersachsen | −0.285 (0.323) | |||
| Nordrhein-Westfalen | −0.159 (0.309) | |||
| Schleswig-Holstein | 0.228 (0.362) | |||
| Saarland | 0.658 (0.471) | |||
| Sachsen | −1.535*** (0.386) | |||
| Sachsen-Anhalt | −1.076*** (0.354) | |||
| Thüringen | −1.366*** (0.518) | |||
| Number of observ. R 2 |
2466 0.88 |
2466 0.89 |
2455 0.89 |
2466 0.89 |
-
The table shows the regression results for Models 1–4, in which the endogenous variable is the first dose vaccination rate; cluster-robust standard errors in parentheses. All models include time dummies. In Model 2, the reference category refers to the state of Bremen. The city-states Berlin and Hamburg have been excluded from Model 2 as they contain only one county. *, **, and ***Indicate significance at the 10%, 5%, and 1% level, respectively.
4 Summary and Conclusions
This paper examines the factors that influenced vaccination rates in Germany in 2021. We use county-specific data from more than 300 German counties and apply different model specifications to examine the evolution of vaccination rates in different counties and their cumulative vaccination rates at the end of November 2021. Our results are robust to different model specifications. Instead of survey data, which are subject to measurement errors, we use vaccination data collected by the RKI. These data still contain measurement errors: Johnson&Johnson vaccinations are counted only as second-dose vaccinations, and not all coorporate physicians are connected to the reporting system. We believe that RKI data are still more reliable than survey data, but a nationwide registry of vaccinations would make our research much easier and more reliable.
Our study leads to five main findings. First, an increase in the death rate in a county is associated with a rise in the vaccination rate in that county. This implies that the local severity of COVID-19 matters for vaccination decisions. This finding is in line with Baumgaertner et al. (2020), who find that the degree of risk matters for vaccination decisions. Second, a county’s physician density has a positive effect on vaccination rates in all model specifications. Third, population density also matters for vaccination decisions. Although this is in contrast to the finding of Baumgaertner et al. (2020), others have also demonstrated such an “urban effect” (e.g., “Hesitancy in numbers” 2021). Fourth, we find that the proportion of seniors increases vaccination rates. This could be the case because there has been a focus of the vaccination campaign on the elderly and because the perceived risk of this group is larger than for younger people. At the same time, we find that the share of foreigners in a county does not affect the vaccination rates. Fifth, we find a significant effect of location on vaccination outcomes. We find differential effects for the federal states of Germany, especially when distinguishing between the old and the new states.
Our research suggests that interventions should be targeted towards areas with lower physician density and towards specific states. Such a targeted program could increase vaccination rates to achieve the overall goal of herd immunity. However, such policies aim at increasing the supply of vaccines in certain areas. If there are other issues involved – such as general vaccine hesitancy – these measures need to be complemented by demand-side policies.
References
Ambros, M., Frenkel, M., Huynh, T.L.D., and Kilinc, M. (2020). COVID-19 pandemic news and stock market reaction during the onset of the crisis: evidence from high-frequency data. Appl. Econ. Lett. 28: 1686–1689. https://doi.org/10.1080/13504851.2020.1851643.Suche in Google Scholar
Bauer, A. and Weber, E. (2020). COVID-19: how much unemployment was caused by the shutdown in Germany? Appl. Econ. Lett. 28: 1053–1058. https://doi.org/10.1080/13504851.2020.1789544.Suche in Google Scholar
Baumgaertner, B., Ridenhour, B.J., Justwan, F., Carlisle, J.E., and Miller, C.R. (2020). Risk of disease and willingness to vaccinate in the United States: a population-based survey. PLoS Med. 17: e1003354. https://doi.org/10.1371/journal.pmed.1003354.Suche in Google Scholar
Dodd, R.H., Cvejic, E., Bonner, C., Pickles, K., McCaffery, K.J., Ayre, J., and Nickel, B. (2021). Willingness to vaccinate against COVID-19 in Australia. Lancet Infect. Dis. 21: 318–319. https://doi.org/10.1016/s1473-3099(20)30559-4.Suche in Google Scholar
Forsythe, E., Kahn, L.B., Lange, F., and Wiczer, D. (2020). Labor demand in the time of COVID-19: evidence from vacancy postings and UI claims. J. Publ. Econ. 189. https://doi.org/10.1016/j.jpubeco.2020.104238.Suche in Google Scholar
Graeber, D., Schmidt-Petri, C., and Schröder, C. (2021). Attitudes on voluntary and mandatory vaccination against COVID-19: evidence from Germany. PLoS One 16: e0248372. https://doi.org/10.1371/journal.pone.0248372.Suche in Google Scholar
Hayakawa, K. and Mukunoki, H. (2021). The impact of COVID-19 on international trade: evidence from the first shock. J. Jpn. Int. Econ. 60. https://doi.org/10.1016/j.jjie.2021.101135.Suche in Google Scholar
Hesitancy in numbers (2021). Economist 440: 27.Suche in Google Scholar
OpenStreetMap contributors (2021). Planet dump.Suche in Google Scholar
Radtke, R. (2021). Epidemien und pandemien. Statista, Available at: https://de.statista.com/themen/131/pandemien.Suche in Google Scholar
Robert Koch-Institut (2021a). Aktueller Lagebericht des RKI, Available at: https://experience.arcgis.com/experience/478220a4c454480e823b17327b2bf1d4/page/page_1.Suche in Google Scholar
Robert Koch-Institut (2021b). COVID-19-Impfungen in Deutschland. https://doi.org/10.5281/zenodo.5126652.Suche in Google Scholar
Salisu, A.A. and Vo, X.V. (2020). Predicting stock returns in the presence of COVID-19 pandemic: the role of health news. Int. Rev. Financ. Anal. 71: 101546. https://doi.org/10.1016/j.irfa.2020.101546.Suche in Google Scholar
Vidya, C.T. and Prabheesh, K.P. (2020). Implications of COVID-19 pandemic on the global trade Networks. Emerg. Mark. Finance Trade 56: 2408–2421. https://doi.org/10.1080/1540496x.2020.1785426.Suche in Google Scholar
Volkswirtschaftliche Gesamtrechnungen der Länder (2021). Arbeitnehmerentgelt, Bruttolöhne und -gehälter in den kreisfreien Städten und Landkreisen der Bundesrepublik Deutschland 2000 bis 2019, Available at: https://www.statistikportal.de/de/vgrdl.Suche in Google Scholar
WHO (2021). COVID-19 vaccine tracker and landscape, Available at: https://www.who.int/publications/m/item/draft-landscape-of-covid-19-candidate-vaccines.Suche in Google Scholar
© 2022 Walter de Gruyter GmbH, Berlin/Boston
Artikel in diesem Heft
- Frontmatter
- Original Articles
- Human Capital and Economic Growth in OECD Countries Revisited: Initial Stock versus Changes in the Stock of Human Capital Effects
- The Macroeconomic Determinants of House Prices and Rents
- The Exposure Geography of Italian Local Economies to Major Foreign Ones. Evidences from a Multiscale Spatial Experiment Based on Granularity
- Which Factors Determine the Adoption of the Internet of Things? Impacts and Benefits
- Under Debate
- What Determines COVID-19 Vaccination Rates in Germany?
- Data Observer
- IOER Monitor: A Spatio-Temporal Research Data Infrastructure on Settlement and Open Space Development in Germany