Tracking the Rise of Robots: The IFR Database
-
Anne Jurkat

 and
Florian Schneider
and
Florian Schneider

Abstract
We present and analyze the dataset on the international distribution of industrial robots by country, industry, and application provided by the International Federation of Robotics (IFR) since 1993. After describing the IFR we point out specificities and limitations of its dataset. We explain the process of data collection, develop a correspondence table between the IFR industry classification and the ISIC rev. 4 industry classification, and clarify the applied compliance rules. We further compute average implicit depreciation rates inherent to the robot stocks in the IFR dataset in the range of 4–7% per year between 1993 and 2019. We also find that the share of industrial robots that are not classified to any industry or application has sharply declined since 2005.
1 Introduction
The academic research on the economic and social transformation induced by robot adoption in industrial production is booming. The two seminal papers by Acemoglu/Restrepo (2017, 2020 and Graetz/Michaels (2018) as well as many that followed use a special dataset on industrial robots that is compiled and published by the International Federation of Robotics (IFR). Given the crucial role of the IFR dataset in research related to productivity and labor market effects of industrial robots, we see the necessity to present the IFR as well as specificities and limitations of its dataset. Jurkat et al. (2021) discuss further details and review the various applications of the dataset.
2 The IFR and the WRIR Report
The IFR is the international association of the robotics industry and of selected research institutes in the field of robotics as well as an umbrella organization of all national robotics associations. The IFR was established as a nonprofit organization in 1987. Its General Secretariat, first located in Stockholm and later in Paris, is based at the German Mechanical Engineering Industry Association (VDMA) in Frankfurt am Main since 2008. The activities of the IFR cover the following four areas: 1) statistics, 2) market analysis and market expansion, 3) positioning and communication, and 4) networking. These are all typical tasks for an association that represents members of an innovative industry cluster, reaches out to the various stakeholders, and links them in joint activities such as trade fairs or conferences.
The IFR Statistical Department, located at VDMA in Frankfurt, publishes annual data on the worldwide robotics market since 1993. The main data source on industrial robots is the World Robotics Industrial Robots (WRIR) report that always contains five thematic blocks: first, the worldwide distribution of industrial robots is analyzed in terms of installations, stocks, and robot density. The IFR defines robot density as the number of industrial robots in operation (i.e. operational stock) per 10,000 persons employed. Second, country/regional reports explore the geographical distribution of industrial robots by analyzing their usage in single countries or regions. Third, installations of industrial robots for the current and the following two years are forecasted. Fourth, case studies illustrate the profitability and practical benefit of industrial robots. Fifth, the report is rounded off by special features summarizing topical issues in the field of robotics.
3 The IFR Database on Industrial Robots
3.1 Terminology and Data Collection
Unlike an official statistics database, the IFR data is generated by voluntary contributions from individual producers or national sector associations and should mainly inform the members of the association about general sector and market trends. This explains not only the very rigid compliance rules (see Section 3.4) but is also the reason why the automotive and electronics industries as the major users of industrial robots are observed in much more detail than many other industries. Although the data is today also commercially provided to researchers, one should keep in mind that its use in academic research has always been of secondary importance to the provider. Even if the database is currently the most important source of quantitative information on robot adoption worldwide the provider is not and does not feel responsible for improving data compatibility with other research data.
The IFR uses the term “industrial robot” based on the definition of the International Organization for Standardization (ISO). According to ISO standard 8373:2012 (§ 2.9), an industrial robot is an automatically controlled, reprogrammable multipurpose manipulator programmable in three or more axes, which can be either fixed in place or mobile for use in industrial automation applications. Thus, industrial robots are fully autonomous machines that do not require a human operator and can be re-programmed to perform several tasks such as welding and soldering, dispensing (e.g. painting/enameling), (dis-) assembling, handling operations, or processing (e.g. cutting or grinding). Single-purpose automation technology such as elevators, conveyors, or weaving- and knitting machines are not covered by the above definition because they cannot be re-programmed to conduct other tasks, need a human operator, or both. Moreover, the IFR dataset excludes dedicated industrial robots specifically designed for and controlled by a special machine (e.g. automated storage and retrieval systems, integrated circuit handlers, or dedicated assembly equipment). Robotic devices as defined in ISO 8373:2012 (§2.8) are also excluded (IFR 2020: 23f.).
The IFR follows the ISO criterion (8373:2012, §2.10) and views the application in industrial versus non-industrial automation as sufficient to separate industrial robots from service robots. Mechanical features (kinematics) are generally not a sufficient criterion. However, the IFR has also defined kinematic robot types mainly employed in industrial automation applications and includes those robots in its dataset on industrial robots. Consequently, robots with industrial robot kinematics employed in service applications are counted also in the industrial robot statistics. Although autonomous mobile robots (AMR) are often used in industrial environments, they do not satisfy the definition of an industrial robot because they have less than three axes and lack manipulation capabilities. AMRs are thus classified as service robots. If the AMR is combined with a manipulator (e.g. an articulated robot), the IFR only counts the manipulator as industrial robot, while the platform is classified as service robot and therefore excluded. In sum, the IFR dataset only refers to a specific kind of industrial automation and its counts of industrial robots should be understood as a proxy for automation in general. Nevertheless, it covers more than 90% of the global market for industrial robots (Acemoglu/Restrepo 2020).
The IFR collects data on industrial robot installations for its annual WRIR reports by means of two separate questionnaires from nearly all industrial robot suppliers worldwide: 1) annual installations by country and application; 2) annual installations by country and customer industry. Both questionnaires are composed of six separate sheets, one for each type of robots: articulated robots, cartesian robots, cylindrical spherical robots, parallel/delta robots, SCARA robots, and others.[1] Primary data reported by industrial robot suppliers are supplemented by secondary data that have been collected by national robot associations on their national robot markets. On the one hand, these secondary data are used to validate the primary data. On the other hand, the secondary data are used to fill in missing information of companies not reporting to the IFR directly. Data are generally only published in aggregated form, by geographical entity, industry, or application. Company level data are not publicly available. The IFR dataset distinguishes five geographical entities (from lowest to highest hierarchy level): i) survey items, usually a single country, ii) country groups, iii) regions, iv) continents, and v) the whole world. Currently, 75 countries are covered by the dataset.
Data processing includes two consistency checks. First, the IFR checks if the total values by country in both questionnaires – for applications and for industries – match for each robot type. Secondly, whether the IFR data are consistent with national associations’ data is scrutinized. Moreover, data processing involves the removal of double counting when secondary data are incorporated. Lastly, an automated compliance verification ensures adherence to the compliance rules (see Section 3.4). Sometimes, minor revisions occur in the dataset by updating the data on robot installations in previous years if new information becomes available.
Within the WRIR report the expressions “shipments” and “installations” of industrial robots are used interchangeably. Theoretically, the IFR statistics aim at counting the actual installation of robots at the customer’s site. Practically, the available data often refers to the shipment of robots. According to the IFR (2020: 22) shipment and installation data might differ for two reasons: geographical deviations can occur, if – without the knowledge of the supplier – a reseller installs robots in a different country than the supplier shipped them to (i.e. re-exports). Temporal deviations are possible as the time of installation might be significantly later than the shipment, e.g. because the robot is en route, is stored in an inventory or is work-in-progress at the robot integrator, such that a robot shipped might not yet be installed at year-end. This is relevant since data on robot installations are used to construct estimates of the operational stock of industrial robots at the end of the year. While installations are flow values, the stock values are supposed to measure the number of robots currently deployed. For all countries except Japan,[2] the IFR computes the operational stock of robots as the sum of annual robot installations over 12 years with immediate withdrawal from service or replacement afterwards. Figure 1 illustrates the annual global installations of industrial robots as well as the global stock of robots according to the IFR database.

Annual global robot installations and stock development.
In addition to IFR stock data, the robot stock is alternatively calculated based on the perpetual inventory method (PIM) with continuous depreciation (5%, 10%, or 15%) from one period to the next.
Source: Own calculations based on IFR (1993–2021).
3.2 Robot Prices
The IFR provides both average unit prices and price indices for robots (producer price indices and a price index for average unit prices). Unfortunately, both average unit prices and price indices are neither available for the entire period of the IFR database nor for all countries. In addition, information on robot prices cannot be downloaded directly as a time series but must be gathered from the annual WRIR reports. Average unit prices are only provided until 2009 by the annual reports but can be easily calculated by dividing the total market turnover by the number of total robots delivered. Total turnover in current prices is expressed in historical local currency and then converted into US Dollars. Data coverage for total market values begins in 1985 with prices for Japan, North America,[3] Germany, Italy, France, UK, and Rep. of Korea. Some of the reports with historical data running to 1990 can only be found in print copies in the archives of the IFR at the VDMA headquarters in Frankfurt.[4] Currently, total market values for robots and thus average unit prices are only available for five countries: China, North America, Germany, Rep. of Korea, and Japan.[5] The Chinese market values appear first in the WRIR of 2013 and date back to 2007. They are solely based on IFR estimates, while for all other countries these values are reported by the respective national robotics associations. Jurkat et al. (2021) present all available unit prices since 1990.
Calculating unit prices through total market values has the disadvantage that it does not account for different qualities and sizes of robots. This, however, is a drawback of the entire IFR database as each robot delivered is counted as one unit irrespective of its size or quality. Apparently, many robots sold in recent years are smaller-sized robots and are therefore priced lower, causing the average robot price to decline (IFR 2020). Also, a robot is not installed by itself but rather forms a system with computer technology, software, and peripherals. These costs are not included in the market value and thus are not part of the average unit price. The IFR assumes that these additional components could increase the value of the installed robots significantly as the robot unit alone only constitutes roughly 1/3 of the cost of the whole system. A way to resolve the issue of different sizes and complexities of robots delivered and to consider quality changes over time is to express robot prices as an index. Along these lines, the IFR has constructed two producer price indices, both with base year 1990, one without and one with quality changes. The price indices are reported from 1990 to 2005 and are expressed using both current exchange rates and fixed conversion rates against the US Dollar. They were calculated for six countries – US, Italy, France, Germany, UK, and Sweden – and are published in IFR (2006), chapter 3.[6] The price indices with a fixed conversion rate against the 1990 USD can be regarded as a general price index as it lacks an exchange rate dimension, whereas the price indices with current exchange rates are only applicable to the respective countries.[7]
3.3 Classification by Industry and by Application
Data on industrial robots are collected for 11 broad manufacturing categories, for six broad non-manufacturing categories, and for one category “Unspecified”. The IFR industry classification is based on the International Standard Industrial Classification of All Economic Activities (ISIC) revision 4 (UN 2008). However, the IFR classification originally followed ISIC rev. 3 and did not adopt the structural changes that occurred with transition to ISIC rev. 4. Therefore, the IFR industry classification contains artefacts from ISIC rev. 3: for instance, the manufacturing sector is labeled as D as in ISIC rev. 3 instead of C, as in ISIC rev. 4. Within manufacturing, industry disaggregation is available at the two- or three-digit level. Three-digit-level data are only reported for ISIC divisions 26, 27, and 29, i.e. electronics and automotive industries, which are also the most important users of industrial robots. The six non-manufacturing industries are covered at the section-level. Within the data collection process, the number of robots delivered to a specific IFR class always results from a summation over its sub-classes. The IFR industry classes partly deviate from ISIC rev. 4, making a perfect match between both classifications impossible. The most important complication for the matching process is created by the IFR’s more detailed focus on the automotive industry: automotive parts are separated from all relevant ISIC categories and used for a finer granularity of the IFR industry class “Automotive parts”. Table 1 serves as correspondence table between IFR classification and ISIC rev. 4 using basic set theory.
Correspondence table between IFR and ISIC Rev. 4 classifications.
| IFR | ISIC Rev. 4 | ||||
|---|---|---|---|---|---|
| Parent class | IFR code | Title | Section | Divisions or Groups | Description |
| – | 0 | All industries | xxx | xxx | xxx |
| 0 | A-B | Agriculture, forestry, and fishing | A | 01-03 | Agriculture, forestry, and fishing |
| 0 | C | Mining and quarrying | B | 05-09 | Mining and quarrying |
| 0 | D | Manufacturing | C | 10-33 | Manufacturing |
| D | 10-12 | Food and beverages | C | 10-12 | Manufacture of food products
|
| D | 13-15 | Textiles | C | 13-15 | Manufacture of textiles
|
| D | 16 | Wood and furniture | C | 16
|
Manufacture of wood and of products of wood and cork, except furniture; manufacture of articles of straw and plaiting materials |
| D | 17-18 | Paper | C | 17-18 | Manufacture of paper and paper products |
| D | 19-22
|
Plastic and chemical products |
C | 19-22 | Manufacture of coke and refined petroleum products |
| 19-22 | 19 | Pharmaceuticals, cosmetics | C | 21
|
Manufacture of pharmaceuticals, medicinal chemical and botanical products |
| 19-22 | 20-21 | Other chemical products n.e.c | C | 19-20 \ 2023 | Manufacture of coke and refined petroleum products |
| 19-22 | 22
|
Rubber and plastic products (non-automotive) |
C | 22 | Manufacture of rubber and plastics products |
| 19-22 | 229 | Chemical products, unspecified | C | xxx | xxx |
| D | 23
|
Glass, ceramics, stone, and mineral products (non-automotive) |
C | 23 | Manufacture of other nonmetallic mineral products |
| D | 24-28 | Metal | C | 24 |
Manufacture of basic metals |
| 24-28 | 24 | Basic metals | C | 24 | Manufacture of basic metals |
| 24-28 | 25 | Metal products (non-automotive) | C | 25 | Manufacture of fabricated metal products, except machinery and equipment |
| 24-28 | 28 | Industrial machinery | C | 28 | Manufacture of machinery and equipment n.e.c |
| 24-28 | 289 | Metal, unspecified | C | xxx | xxx |
| D | 26-27 | Electrical/electronics | C | 26
|
Manufacture of computer, electronic, and optical products |
| 26-27 | 275 | Household/domestic appliances | C | 275 | Manufacture of domestic appliances |
| 26-27 | 271 | Electrical machinery n.e.c. (non-automotive) | C | 271 |
Manufacture of electric motors, generators, transformers and electricity distribution, and control apparatus |
| 26-27 | 260
|
Electronic components/devices |
C | 261 | Manufacture of electronic components and boards |
| 26-27 | 262 | Computers and peripheral equipment | C | 262 |
Manufacture of computers and peripheral equipment |
| 26-27 | 263 | Info communication equipment domestic and professional (non-automotive) | C | 263 |
Manufacture of communication equipment |
| 26-27 | 265 | Medical, precision, and optical instruments | C | 265 |
Manufacture of measuring, testing, navigating, and control equipment; watches, and clocks |
| 26-27 | 279 | Electrical/electronics, unspecified | C | 279 | Manufacture of other electrical equipment |
| D | 29 | Automotive | C | xxx | xxx |
| D | 291
|
Motor vehicles, engines, and bodies |
C | 29 | Manufacture of motor vehicles, trailers, and semi-trailers |
| 29 | 291 | Motor vehicles, engines, and bodies | C | 291 |
Manufacture of motor vehicles |
| 29 | 293 | Automotive parts | C | xxx | xxx |
| 293 | 2931
|
Metal (AutoParts) |
C | 293 | Manufacture of parts and accessories for motor vehicles |
| 293 | 2931 | Metal (AutoParts) | C | xxx | xxx |
| 293 | 2932 | Rubber and plastic (AutoParts) | C | xxx | xxx |
| 293 | 2933 | Electrical/electronic (AutoParts) | C | xxx | xxx |
| 293 | 2934 | Glass (AutoParts) | C | xxx | xxx |
| 293 | 2939 | Other (AutoParts) | C | xxx | xxx |
| 293 | 2999 | Unspecified AutoParts | C | xxx | xxx |
| 29 | 299 | Automotive unspecified | C | xxx | xxx |
| D | 30 | Other vehicles | C | 30 | Manufacture of other transport equipment |
| D | 91 | All other manufacturing branches | C | 32-33 | Other manufacturing
|
| 0 | E | Electricity, gas, and water supply | D
|
35-39 | Electricity, gas, steam, and air conditioning supply |
| 0 | F | Construction | F | 41-43 | Construction of buildings
|
| 0 | P | Education/research/development | P
|
85
|
Education
|
| 0 | 90 | All other nonmanufacturing branches | G-O |
45-71 |
Wholesale and retail trade; repair of motor vehicles and motorcycles |
| 0 | 99 | Unspecified | xxx | xxx | xxx |
-
Symbol
Unlike ISIC, the IFR classification further divides parts and accessories of motor vehicles into “Metal (AutoParts)”, “Rubber and plastic (AutoParts)”, “Electrical/electronics (AutoParts)”, “Glass (AutoParts)”, and “Other (AutoParts)”. These categories contain goods that have been separated out of the respective broader “non-automotive” IFR classes. So, for instance the manufacture of rubber and plastics products (division 22 in ISIC rev. 4) that end up as automotive parts are taken out of that ISIC category and grouped as a subclass of “Automotive parts”. Thus, the IFR industry classification contains the category “Rubber and plastic products (non-automotive)”, and a separate category, “Rubber and plastic (AutoParts)”. Consequently, automotive parts in the IFR classification comprise significantly more elements than the corresponding ISIC group 293 (“Manufacture of parts and accessories for motor vehicles”). To match IFR class “Automotive parts” as well as possible with ISIC group 293, “Metal products (AutoParts)”, “Electrical/electronic (AutoParts)”, and “Other (AutoParts)” are to be combined, while “Rubber and plastic (AutoParts)” and “Glass (AutoParts)” should be excluded and instead be added to the respective “non-automtive” IFR classes. Further details are provided by Jurkat et al. (2021).
The IFR manufacturing class “All other manufacturing branches” (91) unites ISIC divisions 32 and 33 (“Other manufacturing”; “Repair and installation of machinery and equipment”), but also contains reclassified data from the more specific manufacturing industries, either due to compliance restrictions (see Section 3.4) or because the specific branch is unknown. Thus, a good match between IFR class 91 and ISIC is impossible. “All other nonmanufacturing branches” (IFR class 90) comprises a large part of the service sector by including all the remaining ISIC divisions from 45 to 71, from 73 to 84, and from 86 to 99. However, the IFR class 90 also contains reclassified data from the nonmanufacturing IFR classes (A-B, C, E, F, P). The IFR parent class “Unspecified” (99) and subclasses with the additional label “unspecified” (e.g. subclass “Metal, unspecified”) do not correspond to any ISIC class. They simply contain all data reports where the exact industrial category in which the robots are used is either unknown (i.e. not specified by the reporting robot producer) or cannot be disclosed due to compliance rules.
Annual installations of industrial robots are also collected by application class. The IFR distinguishes six broad application classes and one category “Unspecified” (class 999). “Unspecified” again contains robots for which the application is either unknown or cannot be shown in any of the application classes due to compliance reasons.
3.4 Compliance Rules
The IFR as a private association that includes among its members the major robot producers has to comply with all antitrust and privacy protection rules. The fundamental principle behind these rules is to prevent users of the IFR data from retrieving information on an individual company. The compliance rules therefore require that each data point revealed must consist of data from at least four companies. This rule has been applied by the IFR from 2015 onwards and, therefore, affects installation data since year 2014. Earlier data points, however, were not adjusted retrospectively. Since 2015 the number of reports underlying each data point is automatically checked. This iterative process is repeated until every single data point is compliant or until the most generic level is reached. Thereby, the IFR aspires to remove as little information as possible but as much as is necessary to be compliant.
Two methods are applied upon compliance violation at the survey item or country group level. Higher levels of geographical aggregation (i.e. regions, continents, or world) are not subject to any compliance rules. Compliance mechanism M1 works as follows. Data are reclassified to an “unspecified” class on the same level in the hierarchy of the IFR industry/application classification. Assume for example that data reports for IFR class 19 (“Pharmaceuticals, cosmetics”) are noncompliant. Then, the data in class 19 are shifted to industry class 229 (“Chemical products, unspecified”). This results in 0 installations shown for industry class 19, as these data now appear in 229. If this is still noncompliant, the data are moved to a superior hierarchy level. In our example, this means that the data would be found under industry class 91 (“All other manufacturing branches”). This would result in 0 installations in industry classes 19 and 229 because data appears in class 91. If this is still noncompliant, the data will show up under the most generic IFR industry class, i.e. class 99 (“Unspecified”). M1 is applied to industry classes and application classes by country or country group. Figures 2a and 2b show the reclassification procedure for all IFR industry and application classes according to compliance mechanism M1.

Compliance mechanism M1 – reclassification procedure for IFR industry classes.
Source: IFR (internal document).

Compliance mechanism M1 – reclassification procedure for IFR application classes.
Source: IFR (internal document).
Compliance mechanism M2 may also be called geographical aggregation as this procedure stipulates that all data are hidden (i.e. no installations are shown) for a country and, instead, are added to the superior geographic level, i.e. a country group or geographical region. For instance, data reports for Bosnia-Herzegowina, Croatia, Serbia, and Slovenia are hidden and displayed only for Balkan Countries as a whole. Accordingly, M2 is applied, at the discretion of the IFR Statistical Department to countries with low installation figures. Figure 3 illustrates which compliance mechanism is applied to which geographical entity.
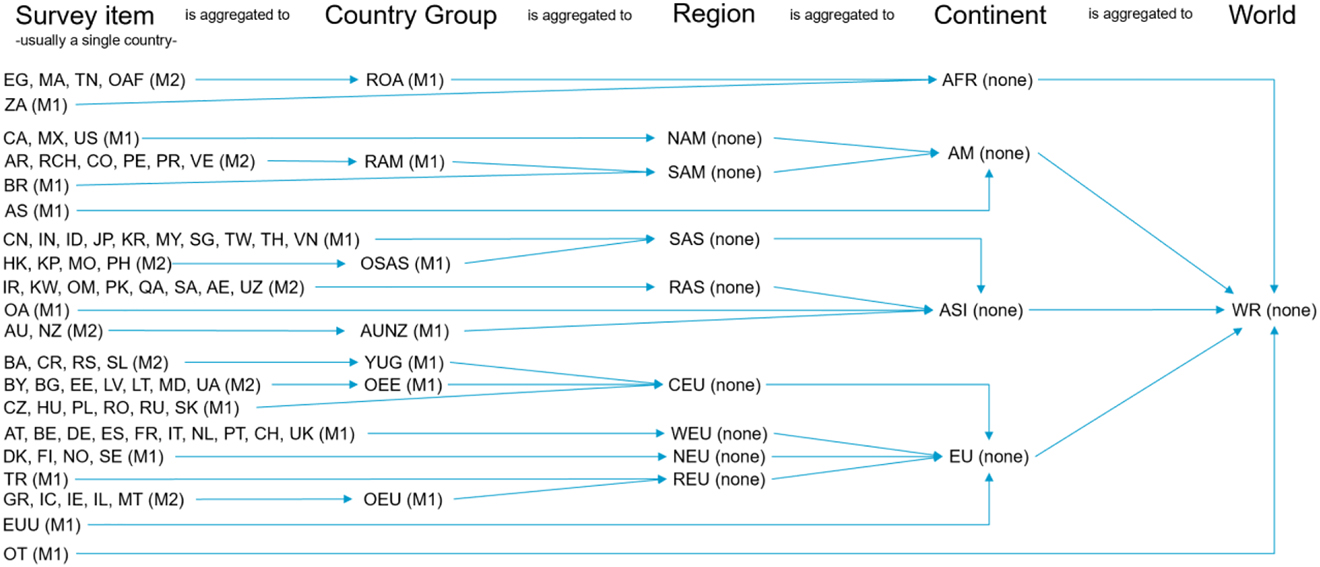
Compliance mechanisms byIFR geographical classes.
The compliance mechanism applied to the respective geographical entity is shown in parentheses.
Source: IFR (internal document).
The compliance mechanisms described above have several consequences for working with the IFR dataset. Data are seemingly inconsistent as a bottom-up summation of country-level data does not yield totals at higher hierarchy levels for data points since year 2014. This is obvious for M2: if data are hidden for some country, leading to “false” zeros, a summation over countries cannot add up to the country group-level values. Thus, the number of robot installations obtained from summing country values within a country group or region will be lower than the number shown for the respective country group or region. This implies that data for country groups, regions and continents usually cannot be obtained from adding up values of the corresponding countries but must be retrieved from the data explicitly shown for the respective level of geographical aggregation. This also holds true for the highest level of geographical aggregation: data on robot installations for the whole world must be taken from the IFR geographical class “World” (WR) and are not equal to the sum over all countries in the dataset for data points since year 2014.
The complications created by M1 are less obvious. M1 shifts data to another industry class at the country or the country group level. In consequence, except for country (group) totals (i.e. values reported for the respective mother class “All industries” or “All applications”) not affected by M2, the sum of country (group)-level values will not match the reported region or continent value for the respective industrial categories. The bottom-up sum will be lower than the reported region or continent value for industry/application classes that are the origin of reclassified data, and it will be larger for “unspecified” classes which are the target of reclassification.
In general, time series data for individual countries may seem incomplete, especially in small countries, because data can be published only in years without compliance violations. Moreover, inconsistencies between installations and robot stocks within a geographical entity can occur because robot stocks are not affected by the compliance mechanisms. The robot stock may increase from one year to the next, although the number of installations in the respective year is set to zero for compliance reasons. This can create consistency problems, in particular for calculations of the robot stock based on the perpetual inventory method.
3.5 Data Issues and Limitations
The IFR dataset on industrial robots exhibits several data issues and limitations. First, a significant share of the robot data is not classified into any of the industrial categories or application areas and, therefore, appears under “Unspecified” (IFR industry class 99, or application class 999). On average, between 1993 and 2019 45.2% of the robot stocks at survey item level are not classified to a specific IFR industry class, while 27.7% are not classified to a specific IFR application class.[8] However, these high shares of robots with unspecified industry or application are mainly driven by smaller countries or countries that account for low shares of the global market for industrial robots. Among Western and Northern European countries, including Germany and Italy as important markets for industrial robots, on average only 27.9% of the robot stocks are not classified to any IFR industry and 21.2% do not have a specified field of application. We also find that the total share of robots with unspecified industry or application sharply decreases since 2005 (Figure 4), indicating a clear improvement in availability of disaggregated data. Simultaneously, the number of observations (i.e. total robot stocks larger than zero) per year sharply increases over time, especially from 1998 to 2010.

Average share of robots with an unspecified industry/application at survey item level over time.8
Source: Own calculations based on IFR (1993–2021).
Second, the assumption of a one-hoss shay depreciation after 12 years in the IFR dataset is not in line with the mainstream literature on economic growth and productivity where capital equipment is usually subject to continuous depreciation from one period to the next. Moreover, the IFR itself points out that the assumption of a service life of 12 years is uncertain and needs further investigation.[9] The IFR depreciation procedure involves an implicit depreciation rate that fluctuates over time and can be calculated by rearranging a standard capital accumulation equation:
R t is the stock of robots at year-end, I t is the number of robots installed within a year, and δ t is the depreciation rate in period t. Since the stock of robots is valued at the end of a year, it is not appropriate to use the number of installations in t−1 as it is the case for investment in the capital accumulation equation of a standard neoclassical growth model. Table 2 shows summary statistics for the implicit depreciation rate of total robot stocks by geographical class.
Implicit depreciation rate by geographical class.8
| Geographical class | Obs | Mean | Std. Dev. | Min | Max |
|---|---|---|---|---|---|
| Survey item | 1454 | 0.040 | 0.079 | 0 | 1 |
| Country group | 139 | 0.024 | 0.032 | 0 | 0.239 |
| Region | 188 | 0.056 | 0.075 | 0 | 0.630 |
| Continent | 98 | 0.054 | 0.029 | 0 | 0.133 |
| World | 26 | 0.069 | 0.013 | 0.046 | 0.098 |
-
Implicit depreciation rate of total robot stocks between 1993 and 2019 – Summary statistics by geographical class. Source: Own calculations based on IFR (1993–2021).
At survey item level, the mean depreciation rate between 1993 and 2019 is equal to 4% per year. The global robot stock exhibits a mean implicit depreciation rate of about 7% per year. In Jurkat et al. (2021) implicit depreciation rates are also reported for the main industrial and application classes. Alternatively, Graetz/Michaels (2018) among others, have applied the perpetual inventory method (PIM) with a constant depreciation rate from one period to the next. Thereby, the initial robot stock indicated in the IFR dataset is taken as a given and installations in the subsequent years are used to construct robot stocks with a constant depreciation rate of either 5%, 10%, or 15%. As can be seen in Figure 1 robot stocks constructed using PIM with a depreciation rate of 5% most closely match the evolution of the respective IFR robot stocks.
Third, the IFR’s construction of the operational stock of robots does not involve any quality adjustment due to embodied technological change. Thus, a robot installed for example in 2019 is assumed to have the same quality as a robot installed in 1993, as both robots are simply counted as one unit installed in the respective year, thereby ignoring the technological progress between these two points in time. Assuming that technological progress improves the quality of robots over time, a quality-adjusted measure of the number of robots would ceteris paribus grow faster than the number of units presented by the IFR. Moreover, although the IFR collects data for different robot types, the varying quality attributes and complexity of these robot types are not further quantified – all robots installed are simply counted as one additional unit.
Fourth, data availability at industry level is limited for most countries, especially in the initial years of the dataset. Disaggregated industry data are available for only eight countries over the full period of the dataset: Germany, Spain, France, Italy, UK, Sweden, Finland, and Norway. Similarly, availability of application-level data is limited. Data disaggregated by the six broad application classes over the full period is available for 10 countries – the same eight countries as for industry-level data plus Austria and Denmark.
Fifth, there is a break in the time series for Japanese data between 2000 and 2001 due to international harmonization of definitions and coverage of statistics. Prior to year 2001, Japanese data included dedicated industrial robots on top of multipurpose industrial robots and thus are overstated. In consequence, robot figures reported for Japan are not consistent over time and difficult to include in econometric analyses. Since 2001 Japanese robot installations should only comprise multipurpose industrial robots, while Japanese robot stocks continue to include previously counted dedicated robots until they are fully depreciated. At least since 2010, the international comparability of Japanese data should have improved. Jurkat et al. (2021: 21ff.) report further country-specific inconsistencies in the data for Austria, Taiwan, Russia, the Republic of Korea, and Australia.
Sixth, data for the US and Australia are partly impaired through geographical aggregation. US data includes Mexico and Canada before 2011 and therefore equals data for the region North America up to this year. Similarly, Australian data include New Zealand before 2005.[10]
Seventh, the IFR only counts robots which are sold on the open market. Thus, robots produced and employed in-house are not accounted for.
3.6 Data Access
The IFR dataset on industrial robots is not accessible free of charge. Users must obtain a license agreement with the VDMA. Information on differenct packages and prices can be found on www.ifr.org/worldrobotics. This includes online access to all WRIR reports since 2005 as well as to all data on installations and stocks of industrial robots since 1993. An overview of data availability of robot installations by geographic entity can be found on the free download section of the IFR Statistical Department (www.ifr.org/free-downloads/).
4 Conclusions
As the survey by Jurkat et al. (2021: 26ff.) documents the IFR database on industrial robots has become an essential reference for a growing body of academic research on the patterns and effects of rising robot adoption. It is the only reliable data source that covers the exposure to robots in an internationally comparable format and over a long period of time for a broad range of countries. As a dataset that is provided by a private association representing the interest of the global robotic industry, it needs to meet high standards of compliance while maintaining all professional standards for presenting a realistic picture of the world market for industrial robots. Availability of disaggregated data has significantly improved since 2005, visible in a sharply-declining share of robots with an unspecified industry or application in total robot stocks. However, we see an increasing need to better take into account quality adjustment in the data.
Acknowledgments
The authors thank Susanne Bieller and Christopher Müller for valuable information on the organization of the IFR and on details of the IFR database. Research support by Daniel Kaiser is gratefully acknowledged. It goes without saying that the usual disclaimer applies.
References
Acemoglu, D. and Restrepo, P. (2017). Robots and jobs: evidence from US labor markets, NBER Working Paper 23285. National Bureau of Economic Research, Cambridge MA.10.3386/w23285Search in Google Scholar
Acemoglu, D. and Restrepo, P. (2020). Robots and jobs: evidence from US labor markets. J. Polit. Econ. 128: 2188–2244. https://doi.org/10.1086/705716.Search in Google Scholar
Graetz, G. and Michaels, G. (2018). Robots at work. Rev. Econ. Stat. 100: 753–768. https://doi.org/10.1162/rest_a_00754.Search in Google Scholar
IFR (1993-2021). World robotics: industrial robots. Frankfurt am Main: VDMA Services GmbH.Search in Google Scholar
IFR and UN ECE (2001). World robotics 2001 – Annex B: measuring service lives of industrial robots – pilot study. United Nations, New York-Geneva.Search in Google Scholar
Jurkat, A., Klump, R., and Schneider, F. (2021). Tracking the rise of robots: a survey of the IFR database and its applications, MPRA Working Paper 110390. Munich Personal REPEc Archive, München.Search in Google Scholar
UN (2008). International standard industrial classification of all economic activities (ISIC), revision 4. Statistical Papers, Series M (4), Rev 4. United Nations, New York.Search in Google Scholar
© 2021 Walter de Gruyter GmbH, Berlin/Boston
Articles in the same Issue
- Frontmatter
- Special Issue Articles
- Redistribution In A Globalized World
- The Long and Winding Road to Local Fiscal Equity in the United States: A Fifty-Year Retrospective
- Evolution of the New Market Tax Credit
- A Harmonized Net Wealth Tax in the European Union
- Data Observer
- Tracking the Rise of Robots: The IFR Database
- Data on Digital Transformation in the German Socio-Economic Panel
- The First 50 Contributions to the Data Observer Series – An Overview
- Miscellaneous
- Annual Reviewer Acknowledgement