Guidance on individualized treatment rule estimation in high dimensions
-
Philippe Boileau
 ,
Ning Leng
,
Ning Leng

Abstract
Individualized treatment rules, cornerstones of precision medicine, inform patient treatment decisions with the goal of optimizing patient outcomes. These rules are generally unknown functions of patients’ pre-treatment covariates, meaning they must be estimated from clinical or observational study data. Myriad methods have been developed to learn these rules, and these procedures are demonstrably successful in traditional asymptotic settings with moderate number of covariates. The finite-sample performance of these methods in high-dimensional covariate settings, which are increasingly the norm in modern clinical trials, has not been well characterized, however. We perform a comprehensive comparison of state-of-the-art individualized treatment rule estimators, assessing performance on the basis of the estimators’ rule quality, interpretability, and computational efficiency. Sixteen data-generating processes with continuous outcomes and binary treatment assignments are considered, reflecting a diversity of randomized and observational studies. We summarize our findings and provide succinct advice to practitioners needing to estimate individualized treatment rules in high dimensions. Owing to individualized treatment rule estimators’ poor interpretability, we propose a novel pre-treatment covariate filtering procedure based on recent work for uncovering treatment effect modifiers. We show that it improves estimators’ rule quality and interpretability. All code is made publicly available, facilitating modifications and extensions to our simulation study.
Acknowledgments
Philippe Boileau gratefully acknowledges the support of the Fonds de recherche du Québec – Nature et technologies and the Natural Sciences and Engineering Research Council of Canada.
-
Research ethics: Not applicable.
-
Informed consent: Not applicable.
-
Author contributions: The authors have accepted responsibility for the entire content of this manuscript and approved its submission.
-
Use of Large Language Models, AI and Machine Learning Tools: Not used to write this manuscript.
-
Conflict of interest: The authors state no conflict of interest.
-
Research funding: None declared.
-
Data availability: Not applicable.
-
Software availability: All code and software used to generate the results of this manuscript are made publicly available.
Simulation results: RCT with sparse linear outcome model and identity covariance matrix.
| CATE estimator | Metric | Unfiltered | TEM-VIP-based filtering | ||||
|---|---|---|---|---|---|---|---|
| n = 250 | n = 500 | n = 1,000 | n = 250 | n = 500 | n = 1,000 | ||
| Plug-in LASSO | Rule quality | 0.99 | 1.00 | 0.95 | 0.95 | 1.00 | 0.95 |
| Empirical FDR (%) | 54.88 | 51.82 | 53.33 | 5.41 | 4.60 | 4.84 | |
| Empirical TPR (%) | 100.00 | 100.00 | 100.00 | 91.60 | 99.90 | 100.00 | |
| Empirical TNR (%) | 97.28 | 97.56 | 97.42 | 99.88 | 99.89 | 99.89 | |
| Mean fit time (s) | 0.51 | 0.66 | 1.08 | 67.43 | 75.54 | 87.46 | |
| Plug-in XGBoost | Rule quality | 0.34 | 0.54 | 0.63 | 0.67 | 0.79 | 0.80 |
| Empirical FDR (%) | NA | NA | NA | 5.34 | 4.69 | 4.77 | |
| Empirical TPR (%) | NA | NA | NA | 91.50 | 99.90 | 100.00 | |
| Empirical TNR (%) | NA | NA | NA | 99.88 | 99.89 | 99.89 | |
| Mean fit time (s) | 2.18 | 5.21 | 14.19 | 66.17 | 74.09 | 86.73 | |
| Modified covariates LASSO | Rule quality | 0.47 | 0.69 | 0.84 | 0.84 | 0.95 | 0.92 |
| Empirical FDR (%) | 57.72 | 64.50 | 71.96 | 5.42 | 4.69 | 4.77 | |
| Empirical TPR (%) | 40.50 | 74.40 | 98.40 | 91.60 | 99.90 | 100.00 | |
| Empirical TNR (%) | 97.20 | 95.72 | 93.91 | 99.88 | 99.89 | 99.89 | |
| Mean fit time (s) | 0.44 | 0.86 | 0.93 | 65.80 | 73.78 | 85.99 | |
| Modified covariates XGBoost | Rule quality | 0.31 | 0.44 | 0.58 | 0.66 | 0.79 | 0.82 |
| Empirical FDR (%) | NA | NA | NA | 5.35 | 4.76 | 4.77 | |
| Empirical TPR (%) | NA | NA | NA | 91.50 | 99.90 | 100.00 | |
| Empirical TNR (%) | NA | NA | NA | 99.88 | 99.89 | 99.89 | |
| Mean fit time (s) | 10.26 | 16.26 | 32.96 | 74.98 | 85.32 | 101.38 | |
| Augmented modified covariates LASSO | Rule quality | 0.98 | 0.99 | 0.95 | 0.94 | 1.00 | 0.95 |
| Empirical FDR (%) | 77.63 | 75.85 | 73.33 | 5.18 | 4.69 | 4.84 | |
| Empirical TPR (%) | 100.00 | 100.00 | 100.00 | 91.40 | 99.90 | 100.00 | |
| Empirical TNR (%) | 91.72 | 92.65 | 93.67 | 99.89 | 99.89 | 99.89 | |
| Mean fit time (s) | 1.17 | 1.67 | 2.81 | 67.30 | 75.87 | 88.60 | |
| Augmented modified covariates XGBoost | Rule quality | 0.83 | 0.93 | 0.91 | 0.88 | 0.97 | 0.93 |
| Empirical FDR (%) | NA | NA | NA | 5.42 | 4.60 | 4.77 | |
| Empirical TPR (%) | NA | NA | NA | 91.60 | 99.90 | 100.00 | |
| Empirical TNR (%) | NA | NA | NA | 99.88 | 99.89 | 99.89 | |
| Mean fit time (s) | 86.46 | 114.07 | 154.01 | 102.34 | 122.81 | 138.76 | |
| AIPW-based LASSO | Rule quality | 0.98 | 0.99 | 0.95 | 0.94 | 1.00 | 0.95 |
| Empirical FDR (%) | 68.27 | 66.45 | 63.50 | 5.41 | 4.69 | 4.69 | |
| Empirical TPR (%) | 100.00 | 100.00 | 100.00 | 91.50 | 99.90 | 100.00 | |
| Empirical TNR (%) | 94.91 | 95.28 | 95.93 | 99.88 | 99.89 | 99.89 | |
| Mean fit time (s) | 718.99 | 803.38 | 977.49 | 77.62 | 88.79 | 106.51 | |
| AIPW-based Super Learner | Rule quality | 0.98 | 0.99 | 0.95 | 0.94 | 1.00 | 0.95 |
| Empirical FDR (%) | NA | NA | NA | 5.28 | 4.69 | 4.75 | |
| Empirical TPR (%) | NA | NA | NA | 91.50 | 99.90 | 100.00 | |
| Empirical TNR (%) | NA | NA | NA | 99.88 | 99.89 | 99.89 | |
| Mean fit time (s) | 749.06 | 857.28 | 1,092.48 | 88.86 | 99.19 | 123.61 | |
| Causal Random Forests | Rule quality | 0.28 | 0.35 | 0.35 | 0.73 | 0.85 | 0.83 |
| Empirical FDR (%) | NA | NA | NA | 5.53 | 4.69 | 4.77 | |
| Empirical TPR (%) | NA | NA | NA | 91.50 | 99.90 | 100.00 | |
| Empirical TNR (%) | NA | NA | NA | 99.88 | 99.89 | 99.89 | |
| Mean fit time (s) | 11.64 | 31.43 | 79.28 | 72.61 | 87.78 | 111.26 | |
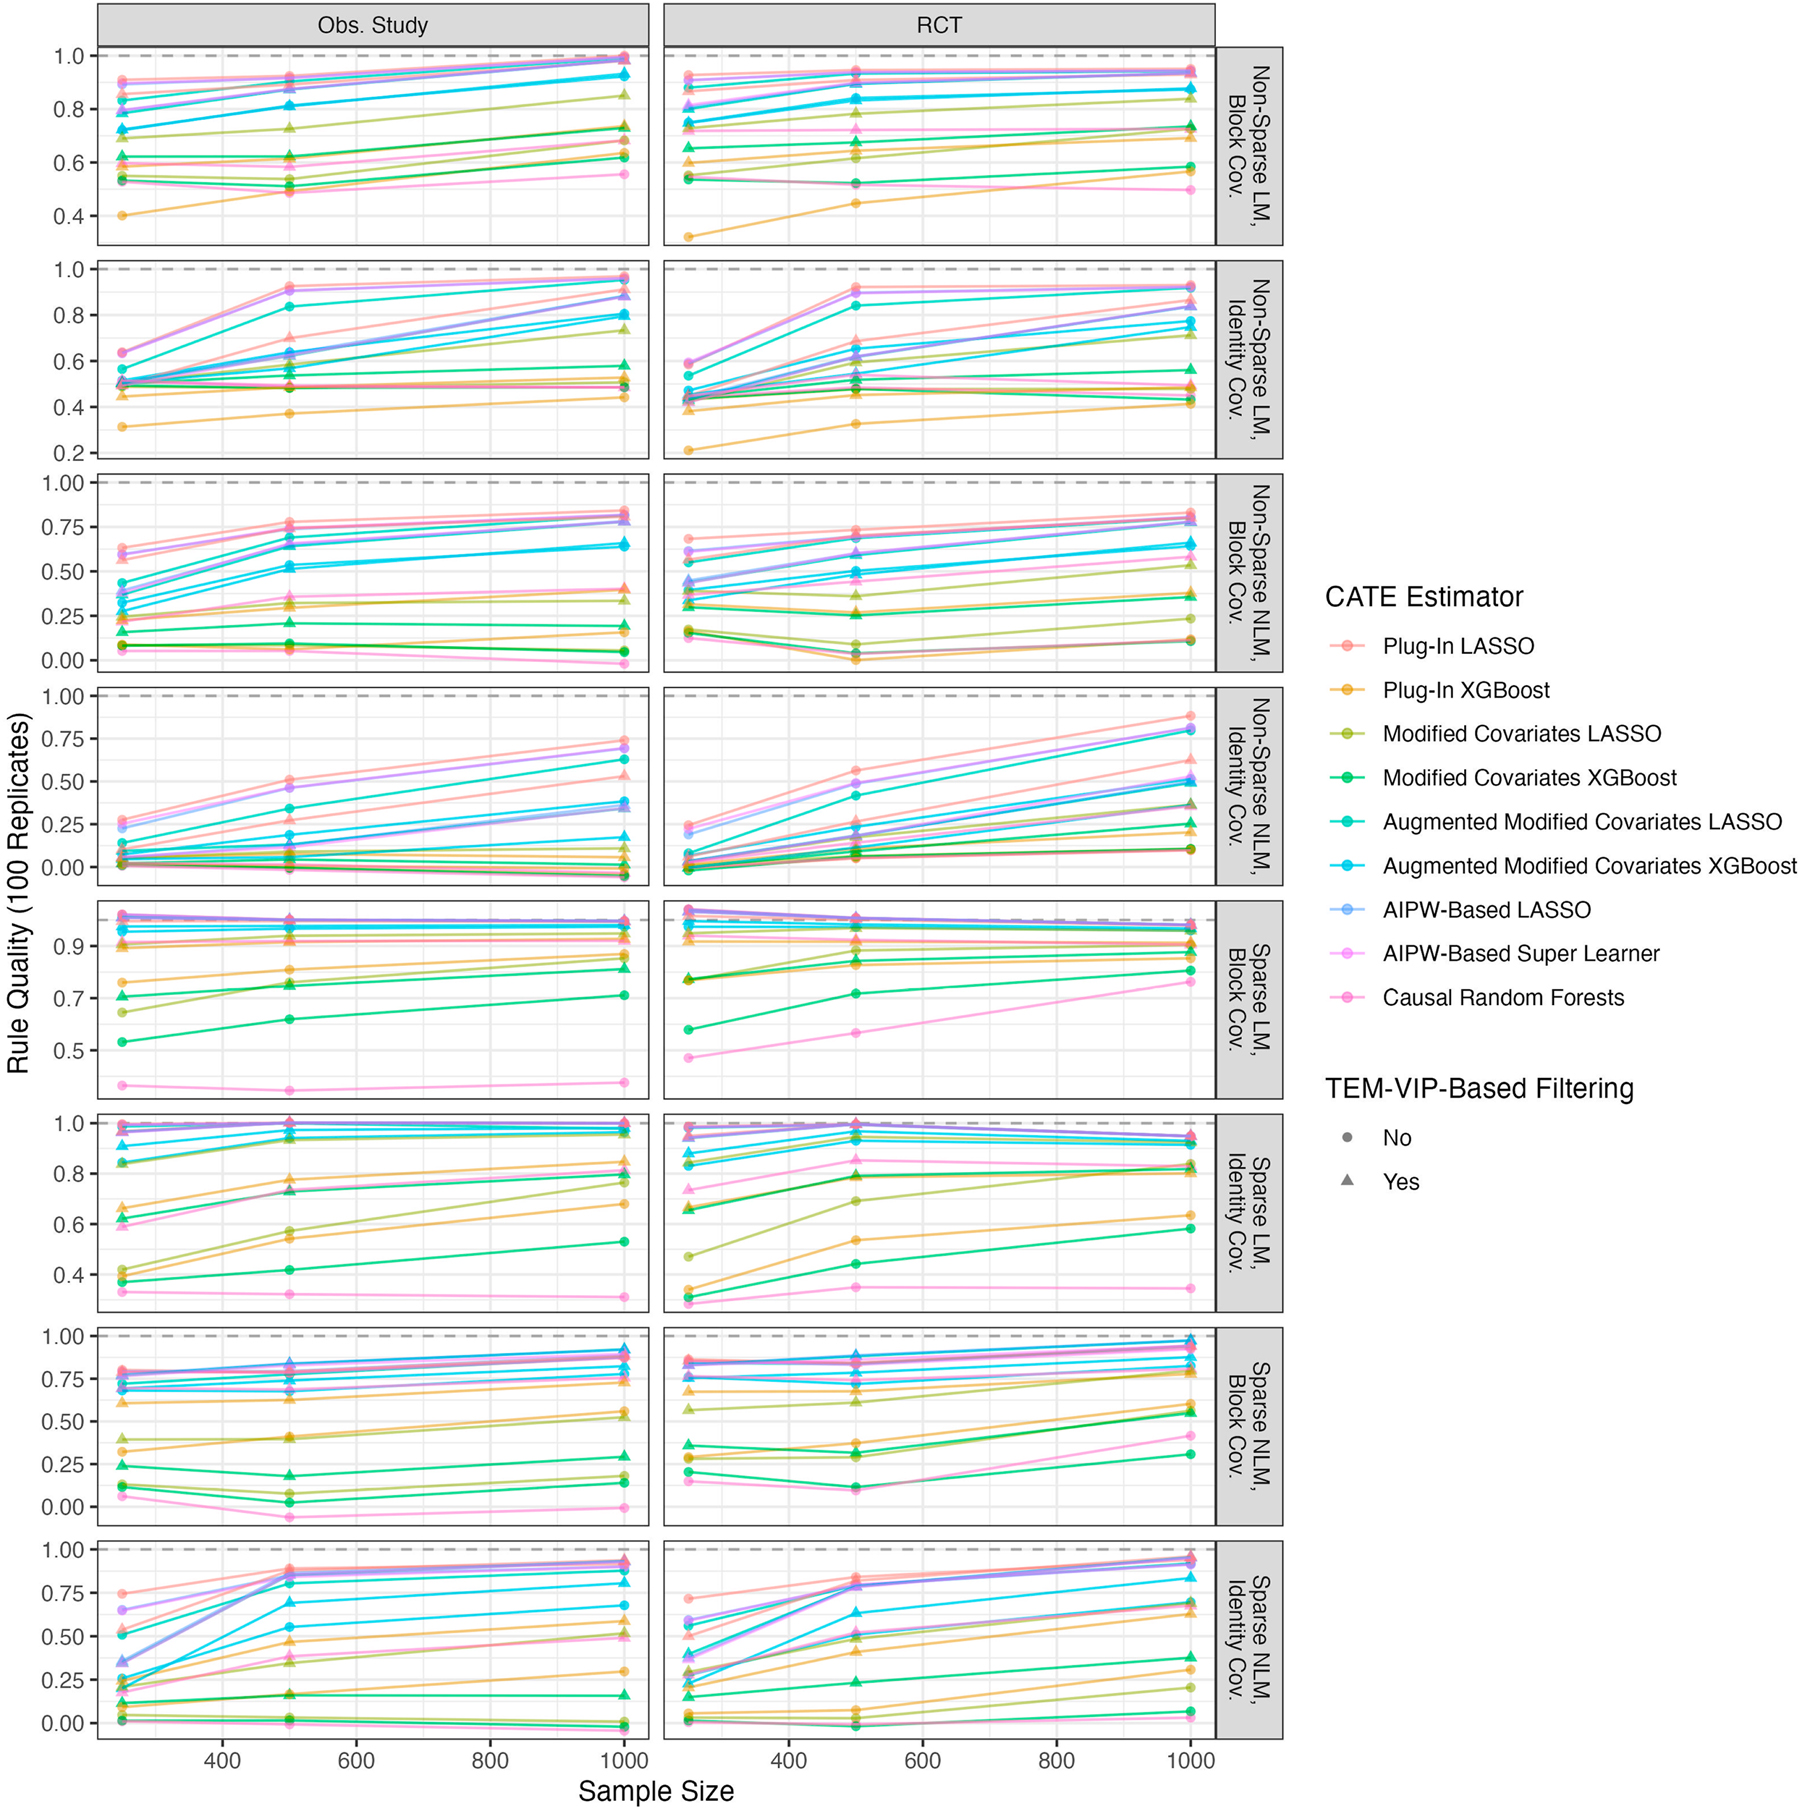
Rule quality: the relative rule quality computed over the 100 test set replicates versus sample size, for each combination of DGP. Relative rule quality is defined as the mean ITR outcome divided by the optimal ITR defined in Proposition 1, which is approximated using a Monte Carlo procedure for each DGP. The dotted line corresponds to the idealized relative rule quality.
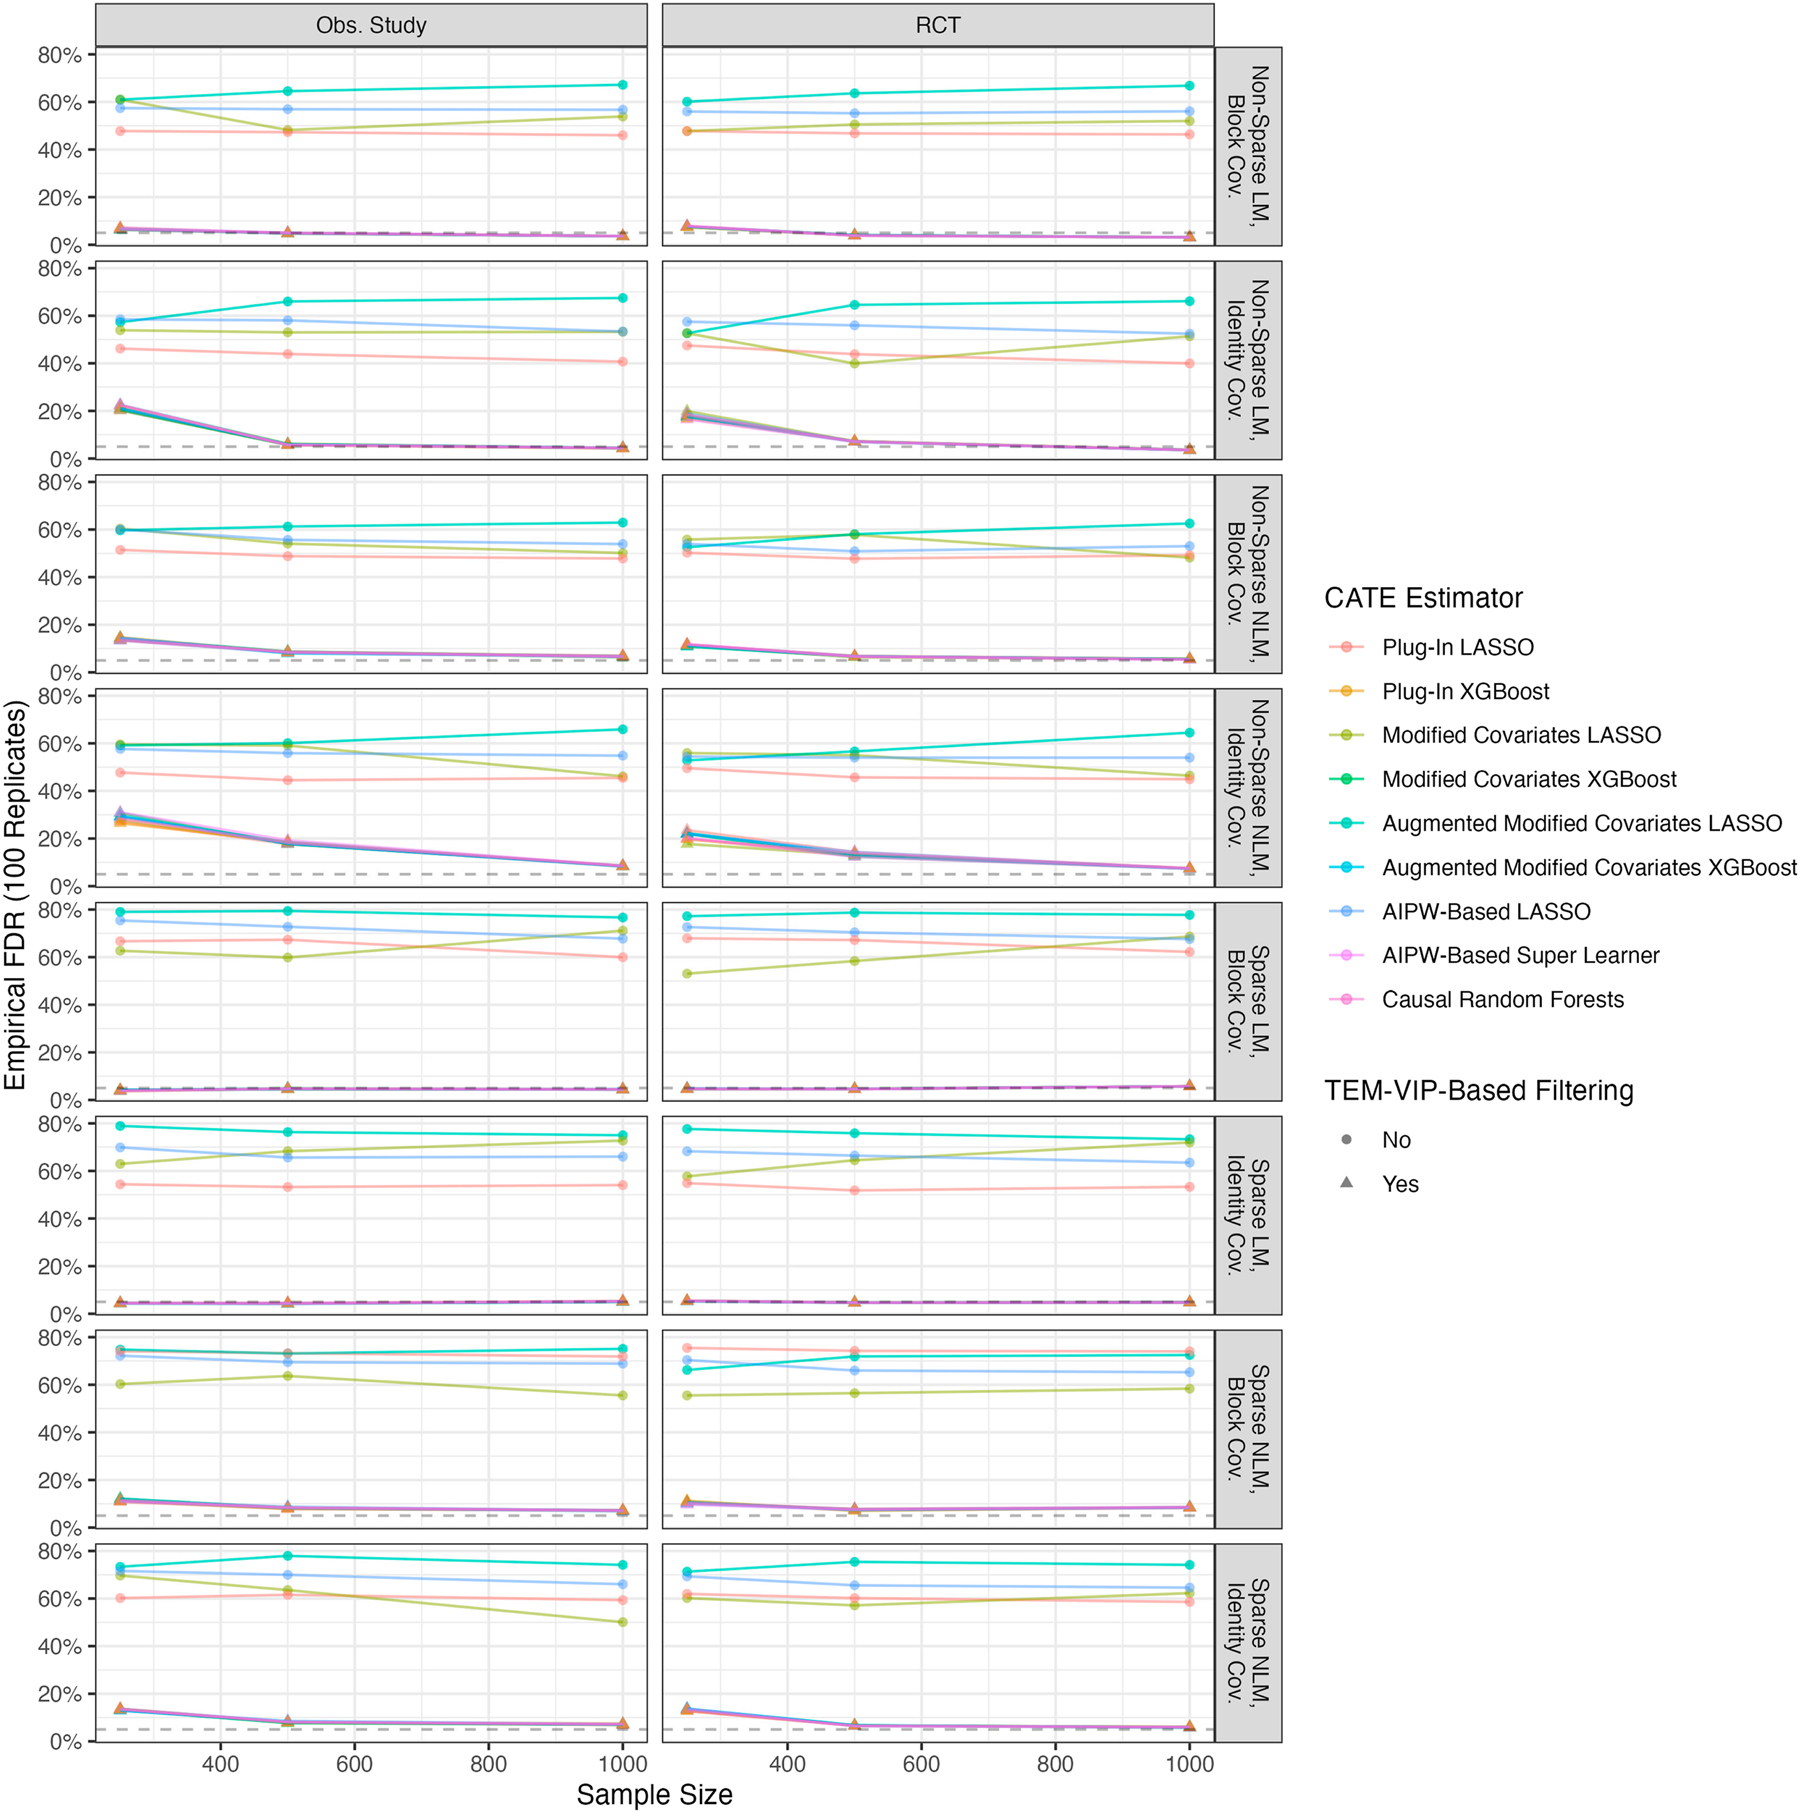
Accurate interpretability, FDR: empirical FDR computed over the 100 learning set replicates versus sample size for each combination of DGP. The dotted line corresponds to desired nominal Type I error rate of 5 %.
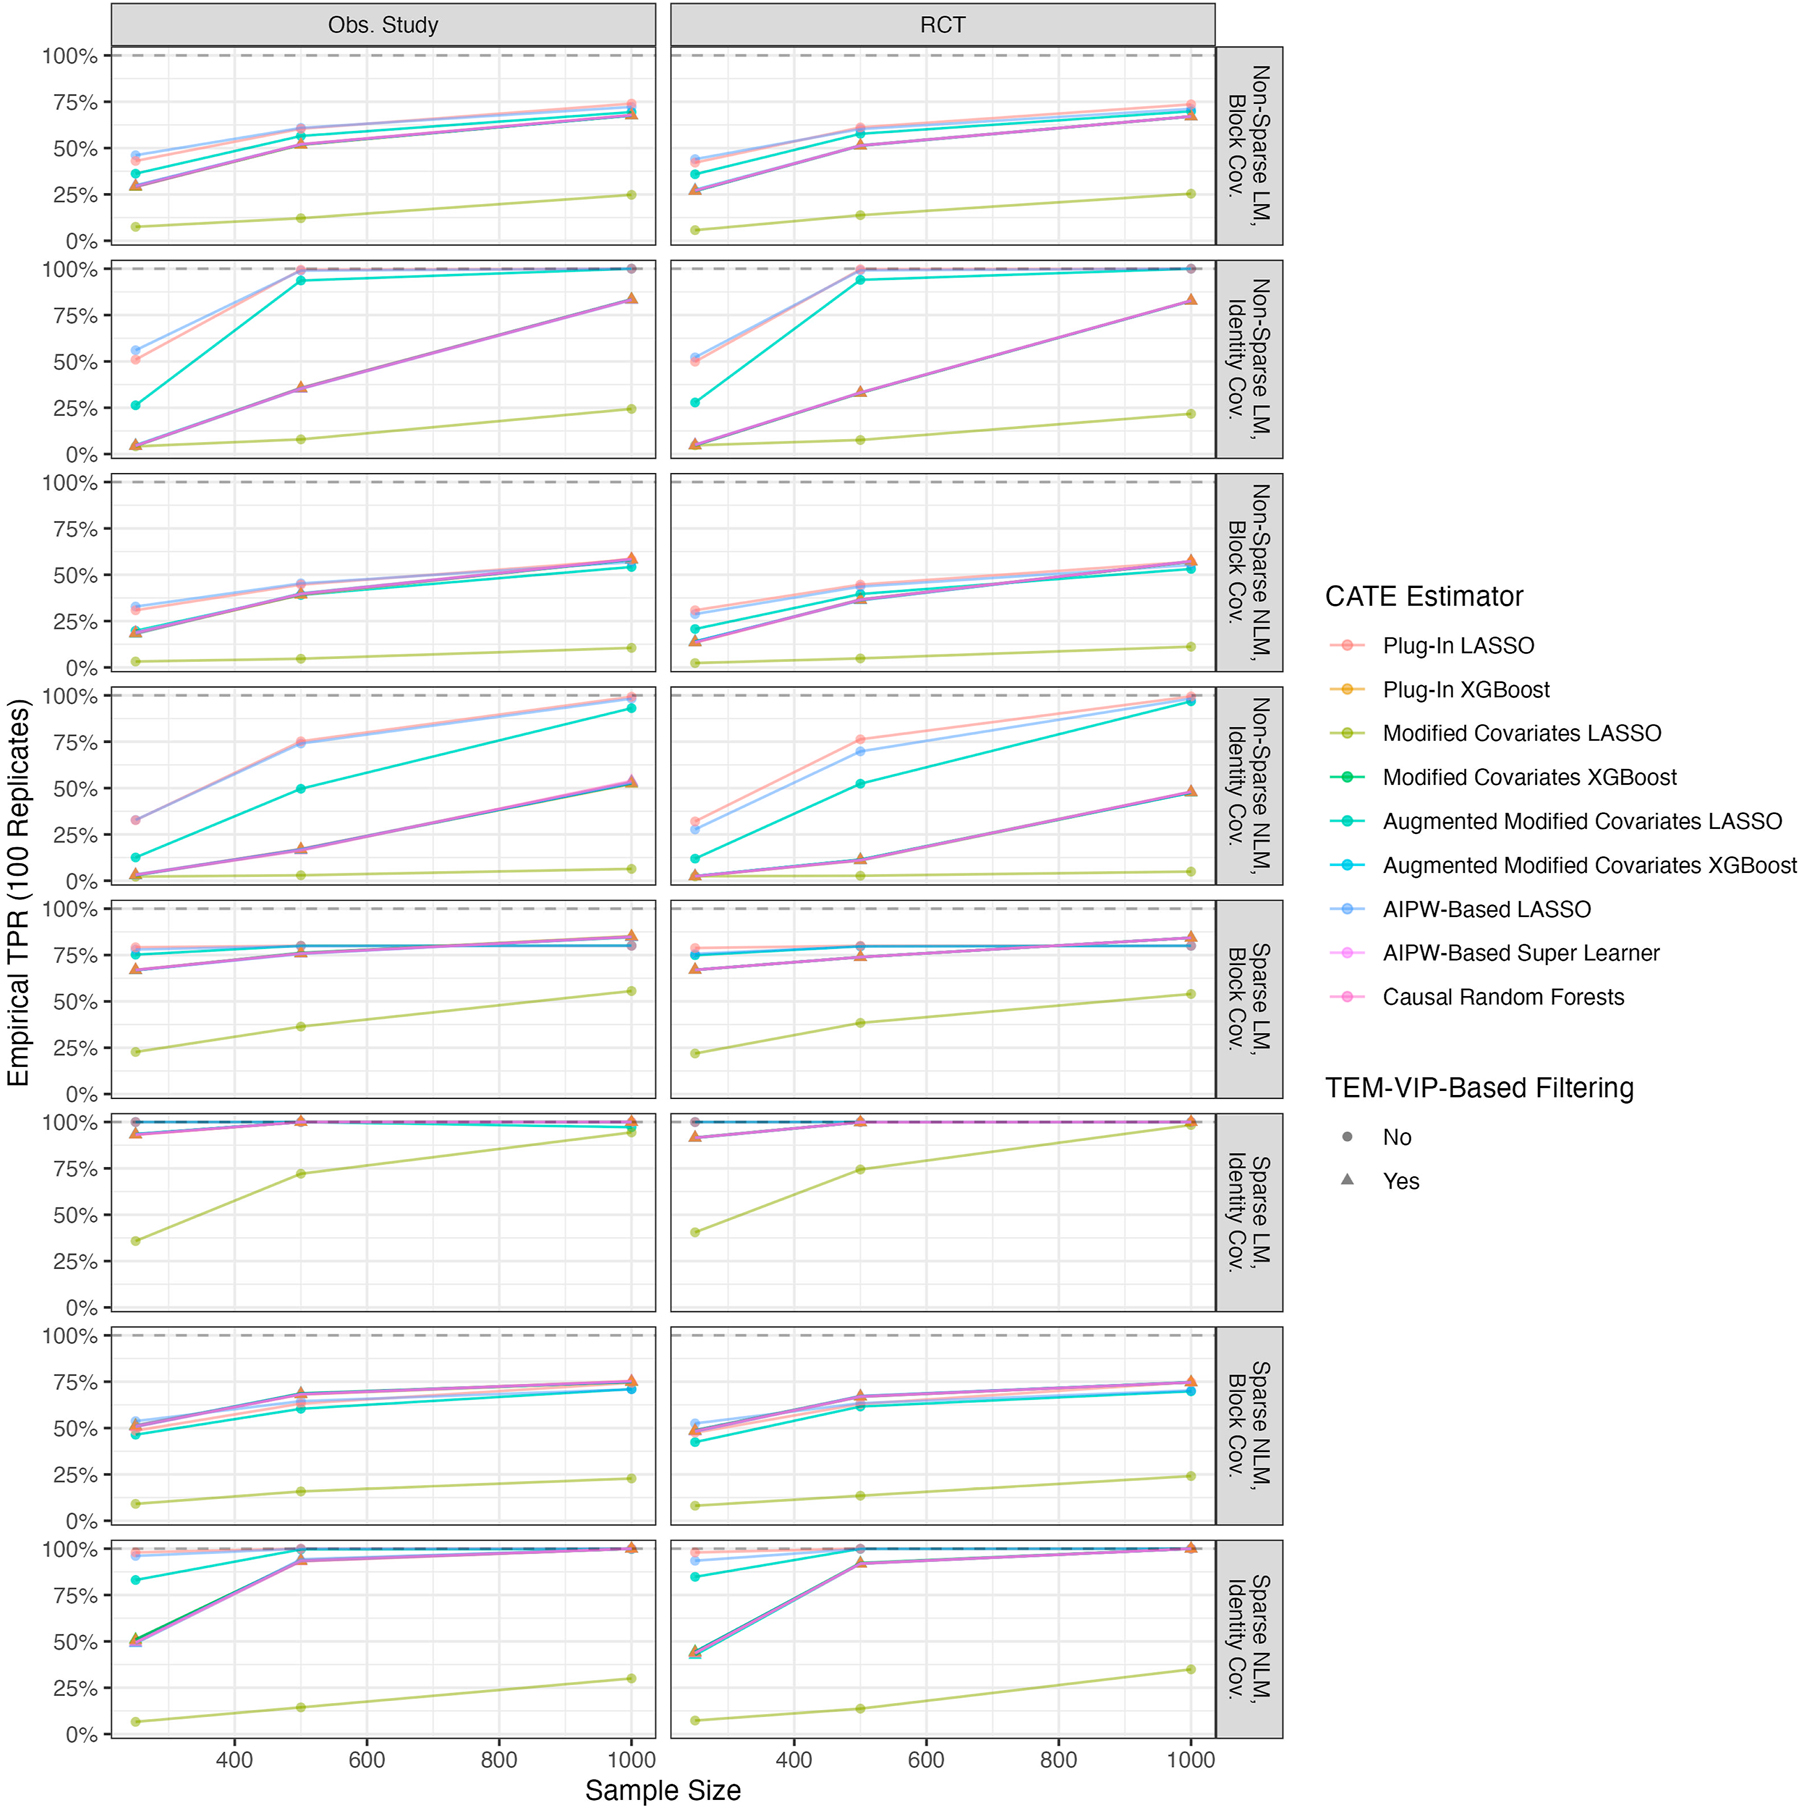
Accurate interpretability, TPR: empirical TPR computed over the 100 learning set replicates versus sample size for each combination of DGP. The dotted line corresponds to desired TPR of 100 %.

Accurate interpretability, TNR: empirical TNR computed over the 100 learning set replicates versus sample size for each combination of DGP. The dotted line corresponds to desired TNR of 100 %.
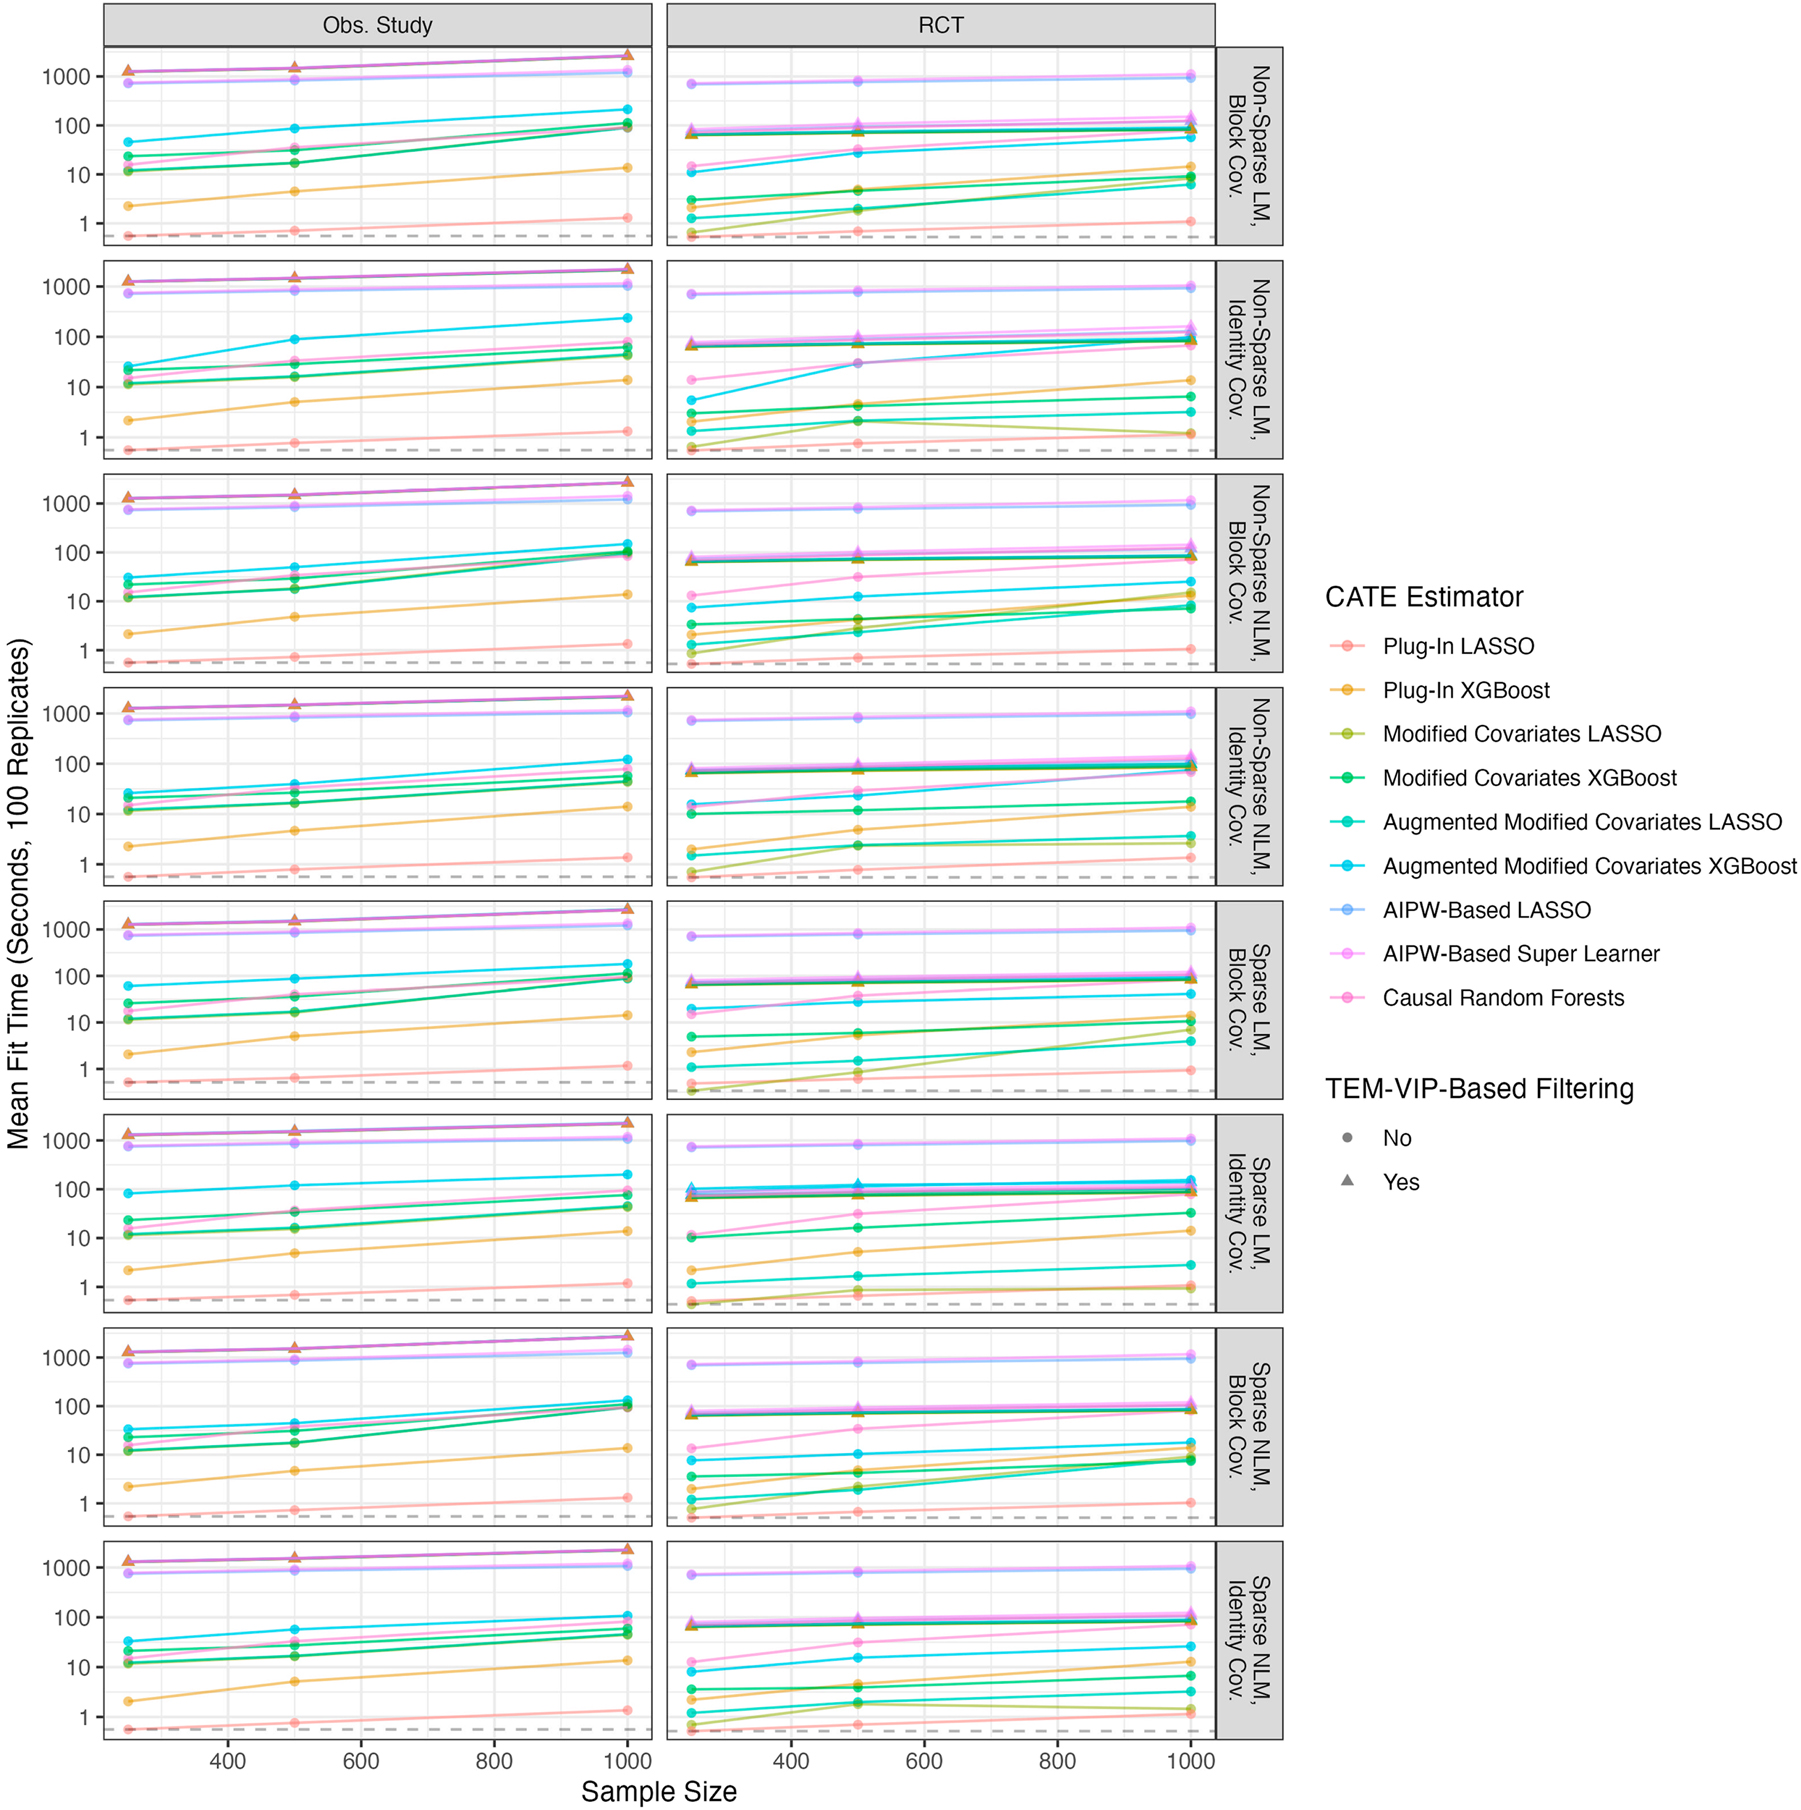
Computational efficiency: fit time computed over the 100 learning set replicates versus sample size for each combination of DGP. The dotted line corresponds to the minimum mean fit time observed in each DGP.
Simulation results: observational study with sparse linear outcome model and identity covariance matrix.
| CATE estimator | Metric | Unfiltered | TEM-VIP-based filtering | ||||
|---|---|---|---|---|---|---|---|
| n = 250 | n = 500 | n = 1,000 | n = 250 | n = 500 | n = 1,000 | ||
| Plug-in LASSO | Rule quality | 1.00 | 1.00 | 1.00 | 0.97 | 1.00 | 1.00 |
| Empirical FDR (%) | 54.39 | 53.24 | 54.06 | 4.58 | 4.57 | 5.25 | |
| Empirical TPR (%) | 100.00 | 100.00 | 100.00 | 93.30 | 100.00 | 100.00 | |
| Empirical TNR (%) | 97.30 | 97.44 | 97.38 | 99.90 | 99.89 | 99.88 | |
| Mean fit time (s) | 0.54 | 0.69 | 1.19 | 1,285.98 | 1,498.31 | 2,196.98 | |
| Plug-in XGBoost | Rule quality | 0.39 | 0.54 | 0.68 | 0.66 | 0.78 | 0.85 |
| Empirical FDR (%) | NA | NA | NA | 4.32 | 4.33 | 5.10 | |
| Empirical TPR (%) | NA | NA | NA | 93.20 | 100.00 | 100.00 | |
| Empirical TNR (%) | NA | NA | NA | 99.90 | 99.90 | 99.88 | |
| Mean fit time (s) | 2.18 | 4.89 | 13.88 | 1,278.96 | 1,495.74 | 2,200.38 | |
| Modified covariates LASSO | Rule quality | 0.42 | 0.57 | 0.76 | 0.84 | 0.93 | 0.96 |
| Empirical FDR (%) | 62.96 | 68.30 | 72.76 | 4.46 | 4.33 | 5.10 | |
| Empirical TPR (%) | 35.80 | 72.10 | 94.40 | 93.50 | 100.00 | 100.00 | |
| Empirical TNR (%) | 96.17 | 95.13 | 93.01 | 99.90 | 99.90 | 99.88 | |
| Mean fit time (s) | 11.43 | 15.38 | 43.12 | 1,284.50 | 1,501.51 | 2,213.89 | |
| Modified covariates XGBoost | Rule quality | 0.37 | 0.42 | 0.53 | 0.62 | 0.73 | 0.80 |
| Empirical FDR (%) | NA | NA | NA | 4.48 | 4.33 | 5.02 | |
| Empirical TPR (%) | NA | NA | NA | 93.30 | 100.00 | 100.00 | |
| Empirical TNR (%) | NA | NA | NA | 99.90 | 99.90 | 99.88 | |
| Mean fit time (s) | 23.32 | 34.35 | 76.25 | 1,299.77 | 1,517.25 | 2,235.83 | |
| Augmented modified covariates LASSO | Rule quality | 0.99 | 1.00 | 0.98 | 0.97 | 1.00 | 1.00 |
| Empirical FDR (%) | 78.89 | 76.33 | 75.00 | 4.56 | 4.31 | 5.25 | |
| Empirical TPR (%) | 100.00 | 100.00 | 97.20 | 93.40 | 100.00 | 100.00 | |
| Empirical TNR (%) | 90.81 | 92.56 | 92.18 | 99.90 | 99.90 | 99.88 | |
| Mean fit time (s) | 12.05 | 16.35 | 45.18 | 1,286.57 | 1,503.82 | 2,212.27 | |
| Augmented modified covariates XGBoost | Rule quality | 0.84 | 0.94 | 0.96 | 0.91 | 0.97 | 0.98 |
| Empirical FDR (%) | NA | NA | NA | 4.33 | 4.16 | 5.02 | |
| Empirical TPR (%) | NA | NA | NA | 93.50 | 100.00 | 100.00 | |
| Empirical TNR (%) | NA | NA | NA | 99.90 | 99.90 | 99.88 | |
| Mean fit time (s) | 82.00 | 120.08 | 200.47 | 1,316.34 | 1,552.06 | 2,283.46 | |
| AIPW-based LASSO | Rule quality | 0.99 | 1.00 | 1.00 | 0.97 | 1.00 | 1.00 |
| Empirical FDR (%) | 69.89 | 65.64 | 66.02 | 4.30 | 4.25 | 5.15 | |
| Empirical TPR (%) | 100.00 | 100.00 | 100.00 | 93.40 | 100.00 | 100.00 | |
| Empirical TNR (%) | 94.54 | 95.44 | 95.51 | 99.90 | 99.90 | 99.88 | |
| Mean fit time (s) | 747.79 | 856.14 | 1,072.22 | 1,301.05 | 1,522.12 | 2,233.43 | |
| AIPW-based Super Learner | Rule quality | 0.99 | 1.00 | 1.00 | 0.96 | 1.00 | 1.00 |
| Empirical FDR (%) | NA | NA | NA | 4.47 | 4.50 | 5.09 | |
| Empirical TPR (%) | NA | NA | NA | 93.30 | 100.00 | 100.00 | |
| Empirical TNR (%) | NA | NA | NA | 99.90 | 99.89 | 99.88 | |
| Mean fit time (s) | 774.92 | 909.20 | 1,187.28 | 1,310.44 | 1,534.90 | 2,244.74 | |
| Causal Random Forests | Rule quality | 0.33 | 0.32 | 0.31 | 0.59 | 0.74 | 0.81 |
| Empirical FDR (%) | NA | NA | NA | 4.50 | 4.22 | 5.32 | |
| Empirical TPR (%) | NA | NA | NA | 93.10 | 100.00 | 100.00 | |
| Empirical TNR (%) | NA | NA | NA | 99.90 | 99.90 | 99.87 | |
| Mean fit time (s) | 15.72 | 36.77 | 94.67 | 1,290.28 | 1,514.75 | 2,236.92 | |
Simulation results: RCT with sparse linear outcome model and block covariance matrix.
| CATE estimator | Metric | Unfiltered | TEM-VIP-based filtering | ||||
|---|---|---|---|---|---|---|---|
| n = 250 | n = 500 | n = 1,000 | n = 250 | n = 500 | n = 1,000 | ||
| Plug-in LASSO | Rule quality | 1.04 | 1.01 | 0.98 | 1.02 | 1.00 | 0.98 |
| Empirical FDR (%) | 67.91 | 67.18 | 62.19 | 4.60 | 4.59 | 5.73 | |
| Empirical TPR (%) | 78.80 | 80.00 | 80.00 | 67.00 | 73.90 | 84.30 | |
| Empirical TNR (%) | 96.34 | 96.43 | 97.20 | 99.92 | 99.91 | 99.88 | |
| Mean fit time (s) | 0.49 | 0.61 | 0.93 | 65.01 | 72.45 | 84.75 | |
| Plug-in XGBoost | Rule quality | 0.77 | 0.83 | 0.85 | 0.92 | 0.92 | 0.91 |
| Empirical FDR (%) | NA | NA | NA | 4.60 | 4.59 | 5.73 | |
| Empirical TPR (%) | NA | NA | NA | 67.00 | 73.90 | 84.30 | |
| Empirical TNR (%) | NA | NA | NA | 99.92 | 99.91 | 99.88 | |
| Mean fit time (s) | 2.29 | 5.30 | 13.97 | 64.05 | 70.93 | 82.80 | |
| Modified covariates LASSO | Rule quality | 0.77 | 0.88 | 0.90 | 0.95 | 0.97 | 0.96 |
| Empirical FDR (%) | 53.05 | 58.37 | 68.66 | 4.73 | 4.64 | 5.73 | |
| Empirical TPR (%) | 21.90 | 38.40 | 54.00 | 67.00 | 73.90 | 84.30 | |
| Empirical TNR (%) | 98.50 | 97.85 | 96.38 | 99.92 | 99.91 | 99.88 | |
| Mean fit time (s) | 0.34 | 0.85 | 6.98 | 63.89 | 70.72 | 82.19 | |
| Modified covariates XGBoost | Rule quality | 0.58 | 0.72 | 0.81 | 0.77 | 0.84 | 0.88 |
| Empirical FDR (%) | NA | NA | NA | 4.74 | 4.68 | 5.73 | |
| Empirical TPR (%) | NA | NA | NA | 67.00 | 73.90 | 84.30 | |
| Empirical TNR (%) | NA | NA | NA | 99.92 | 99.91 | 99.88 | |
| Mean fit time (s) | 4.94 | 5.93 | 10.65 | 67.24 | 73.92 | 85.77 | |
| Augmented modified covariates LASSO | Rule quality | 1.04 | 1.01 | 0.98 | 1.03 | 1.01 | 0.98 |
| Empirical FDR (%) | 77.21 | 78.71 | 77.73 | 4.51 | 4.59 | 5.73 | |
| Empirical TPR (%) | 74.90 | 79.70 | 80.00 | 67.00 | 73.90 | 84.30 | |
| Empirical TNR (%) | 93.83 | 93.20 | 93.41 | 99.92 | 99.91 | 99.88 | |
| Mean fit time (s) | 1.09 | 1.50 | 3.95 | 64.85 | 72.83 | 84.60 | |
| Augmented modified covariates XGBoost | Rule quality | 0.97 | 0.97 | 0.96 | 1.00 | 0.98 | 0.97 |
| Empirical FDR (%) | NA | NA | NA | 4.76 | 4.59 | 5.73 | |
| Empirical TPR (%) | NA | NA | NA | 67.00 | 73.90 | 84.30 | |
| Empirical TNR (%) | NA | NA | NA | 99.92 | 99.91 | 99.88 | |
| Mean fit time (s) | 19.69 | 27.49 | 40.98 | 72.08 | 79.84 | 92.87 | |
| AIPW-based LASSO | Rule quality | 1.04 | 1.01 | 0.98 | 1.03 | 1.01 | 0.98 |
| Empirical FDR (%) | 72.64 | 70.42 | 67.60 | 4.87 | 4.59 | 5.73 | |
| Empirical TPR (%) | 75.70 | 79.70 | 80.00 | 67.00 | 73.90 | 84.30 | |
| Empirical TNR (%) | 95.07 | 95.62 | 96.07 | 99.92 | 99.91 | 99.88 | |
| Mean fit time (s) | 698.37 | 781.89 | 946.50 | 73.84 | 84.93 | 105.01 | |
| AIPW-based Super Learner | Rule quality | 1.04 | 1.01 | 0.98 | 1.03 | 1.01 | 0.98 |
| Empirical FDR (%) | NA | NA | NA | 4.62 | 4.59 | 5.73 | |
| Empirical TPR (%) | NA | NA | NA | 67.00 | 73.90 | 84.30 | |
| Empirical TNR (%) | NA | NA | NA | 99.92 | 99.91 | 99.88 | |
| Mean fit time (s) | 727.38 | 838.27 | 1,097.19 | 80.72 | 94.42 | 121.68 | |
| Causal Random Forests | Rule quality | 0.47 | 0.57 | 0.76 | 0.94 | 0.92 | 0.91 |
| Empirical FDR (%) | NA | NA | NA | 4.64 | 4.59 | 5.73 | |
| Empirical TPR (%) | NA | NA | NA | 67.00 | 73.90 | 84.30 | |
| Empirical TNR (%) | NA | NA | NA | 99.92 | 99.91 | 99.88 | |
| Mean fit time (s) | 15.01 | 37.68 | 83.47 | 69.82 | 82.87 | 106.72 | |
Simulation results: observational study with sparse linear outcome model and block covariance matrix.
| CATE estimator | Metric | Unfiltered | TEM-VIP-based filtering | ||||
|---|---|---|---|---|---|---|---|
| n = 250 | n = 500 | n = 1,000 | n = 250 | n = 500 | n = 1,000 | ||
| Plug-in LASSO | Rule quality | 1.02 | 1.00 | 1.00 | 1.00 | 1.00 | 0.99 |
| Empirical FDR (%) | 66.68 | 67.32 | 59.96 | 4.09 | 4.59 | 4.42 | |
| Empirical TPR (%) | 79.20 | 80.00 | 80.00 | 67.00 | 75.90 | 84.90 | |
| Empirical TNR (%) | 96.62 | 96.44 | 97.38 | 99.93 | 99.92 | 99.91 | |
| Mean fit time (s) | 0.52 | 0.64 | 1.17 | 1,268.36 | 1,480.99 | 2,614.30 | |
| Plug-in XGBoost | Rule quality | 0.76 | 0.81 | 0.87 | 0.89 | 0.92 | 0.93 |
| Empirical FDR (%) | NA | NA | NA | 4.22 | 4.53 | 4.48 | |
| Empirical TPR (%) | NA | NA | NA | 66.90 | 76.00 | 85.20 | |
| Empirical TNR (%) | NA | NA | NA | 99.93 | 99.92 | 99.91 | |
| Mean fit time (s) | 2.06 | 5.05 | 14.30 | 1,266.69 | 1,478.83 | 2,625.31 | |
| Modified covariates LASSO | Rule quality | 0.64 | 0.76 | 0.85 | 0.91 | 0.94 | 0.95 |
| Empirical FDR (%) | 62.69 | 59.85 | 71.13 | 3.72 | 4.65 | 4.35 | |
| Empirical TPR (%) | 22.70 | 36.40 | 55.60 | 66.90 | 75.90 | 84.80 | |
| Empirical TNR (%) | 97.59 | 97.54 | 96.00 | 99.94 | 99.91 | 99.91 | |
| Mean fit time (s) | 11.43 | 16.29 | 91.10 | 1,271.48 | 1,485.92 | 2,640.70 | |
| Modified covariates XGBoost | Rule quality | 0.53 | 0.62 | 0.71 | 0.71 | 0.75 | 0.81 |
| Empirical FDR (%) | NA | NA | NA | 3.97 | 4.88 | 4.41 | |
| Empirical TPR (%) | NA | NA | NA | 66.80 | 76.20 | 84.60 | |
| Empirical TNR (%) | NA | NA | NA | 99.94 | 99.91 | 99.91 | |
| Mean fit time (s) | 25.78 | 35.77 | 114.26 | 1,279.80 | 1,505.50 | 2,652.49 | |
| Augmented modified covariates LASSO | Rule quality | 1.01 | 1.00 | 1.00 | 1.01 | 1.00 | 1.00 |
| Empirical FDR (%) | 79.01 | 79.40 | 76.66 | 4.09 | 4.46 | 4.53 | |
| Empirical TPR (%) | 75.20 | 80.00 | 80.10 | 66.80 | 76.00 | 84.90 | |
| Empirical TNR (%) | 92.26 | 92.54 | 93.71 | 99.93 | 99.92 | 99.91 | |
| Mean fit time (s) | 12.01 | 17.02 | 87.90 | 1,268.95 | 1,490.85 | 2,639.48 | |
| Augmented modified covariates XGBoost | Rule quality | 0.95 | 0.97 | 0.97 | 0.98 | 0.98 | 0.98 |
| Empirical FDR (%) | NA | NA | NA | 4.22 | 4.72 | 4.33 | |
| Empirical TPR (%) | NA | NA | NA | 66.80 | 75.70 | 84.90 | |
| Empirical TNR (%) | NA | NA | NA | 99.93 | 99.91 | 99.91 | |
| Mean fit time (s) | 60.73 | 87.24 | 181.10 | 1,294.77 | 1,527.59 | 2,690.81 | |
| AIPW-based LASSO | Rule quality | 1.02 | 1.00 | 1.00 | 1.01 | 1.00 | 1.00 |
| Empirical FDR (%) | 75.42 | 72.76 | 67.76 | 3.97 | 4.58 | 4.59 | |
| Empirical TPR (%) | 78.00 | 79.80 | 80.00 | 67.00 | 75.90 | 84.70 | |
| Empirical TNR (%) | 94.48 | 95.02 | 95.88 | 99.94 | 99.91 | 99.90 | |
| Mean fit time (s) | 735.33 | 848.68 | 1,220.28 | 1,280.04 | 1,505.40 | 2,635.82 | |
| AIPW-based Super Learner | Rule quality | 1.02 | 1.00 | 1.00 | 1.01 | 1.00 | 1.00 |
| Empirical FDR (%) | NA | NA | NA | 3.99 | 4.74 | 4.34 | |
| Empirical TPR (%) | NA | NA | NA | 66.80 | 75.70 | 84.80 | |
| Empirical TNR (%) | NA | NA | NA | 99.94 | 99.91 | 99.91 | |
| Mean fit time (s) | 762.44 | 898.22 | 1,355.78 | 1,287.77 | 1,513.87 | 2,628.08 | |
| Causal Random Forests | Rule quality | 0.36 | 0.35 | 0.38 | 0.92 | 0.92 | 0.92 |
| Empirical FDR (%) | NA | NA | NA | 3.72 | 4.77 | 4.48 | |
| Empirical TPR (%) | NA | NA | NA | 67.00 | 76.00 | 84.90 | |
| Empirical TNR (%) | NA | NA | NA | 99.94 | 99.91 | 99.91 | |
| Mean fit time (s) | 17.57 | 40.15 | 94.69 | 1,271.76 | 1,497.79 | 2,647.69 | |
Simulation results: RCT with sparse non-linear outcome model and identity covariance matrix.
| CATE estimator | Metric | Unfiltered | TEM-VIP-based filtering | ||||
|---|---|---|---|---|---|---|---|
| n = 250 | n = 500 | n = 1,000 | n = 250 | n = 500 | n = 1,000 | ||
| Plug-in LASSO | Rule quality | 0.72 | 0.84 | 0.94 | 0.50 | 0.82 | 0.96 |
| Empirical FDR (%) | 61.95 | 60.18 | 58.60 | 12.97 | 6.63 | 5.82 | |
| Empirical TPR (%) | 98.00 | 100.00 | 100.00 | 43.50 | 92.00 | 100.00 | |
| Empirical TNR (%) | 96.43 | 96.50 | 96.70 | 99.82 | 99.85 | 99.86 | |
| Mean fit time (s) | 0.52 | 0.70 | 1.15 | 65.26 | 72.65 | 84.65 | |
| Plug-in XGBoost | Rule quality | 0.06 | 0.07 | 0.31 | 0.21 | 0.41 | 0.63 |
| Empirical FDR (%) | NA | NA | NA | 13.12 | 6.58 | 6.04 | |
| Empirical TPR (%) | NA | NA | NA | 44.10 | 91.90 | 100.00 | |
| Empirical TNR (%) | NA | NA | NA | 99.82 | 99.85 | 99.85 | |
| Mean fit time (s) | 2.21 | 4.59 | 12.83 | 64.29 | 71.34 | 83.58 | |
| Modified covariates LASSO | Rule quality | 0.03 | 0.03 | 0.20 | 0.29 | 0.48 | 0.69 |
| Empirical FDR (%) | 60.20 | 57.12 | 62.25 | 12.75 | 6.60 | 6.12 | |
| Empirical TPR (%) | 7.30 | 13.70 | 34.90 | 44.40 | 92.10 | 100.00 | |
| Empirical TNR (%) | 98.77 | 98.77 | 97.54 | 99.82 | 99.85 | 99.85 | |
| Mean fit time (s) | 0.69 | 1.81 | 1.45 | 64.16 | 71.11 | 82.74 | |
| Modified covariates XGBoost | Rule quality | 0.01 | −0.02 | 0.07 | 0.15 | 0.23 | 0.38 |
| Empirical FDR (%) | NA | NA | NA | 13.44 | 6.61 | 5.97 | |
| Empirical TPR (%) | NA | NA | NA | 44.00 | 92.30 | 100.00 | |
| Empirical TNR (%) | NA | NA | NA | 99.81 | 99.85 | 99.86 | |
| Mean fit time (s) | 3.59 | 3.90 | 6.71 | 66.92 | 73.79 | 85.85 | |
| Augmented modified covariates LASSO | Rule quality | 0.56 | 0.79 | 0.92 | 0.40 | 0.79 | 0.95 |
| Empirical FDR (%) | 71.30 | 75.42 | 74.15 | 13.58 | 6.72 | 5.71 | |
| Empirical TPR (%) | 84.80 | 99.90 | 100.00 | 42.60 | 92.00 | 100.00 | |
| Empirical TNR (%) | 94.52 | 92.69 | 93.35 | 99.82 | 99.85 | 99.86 | |
| Mean fit time (s) | 1.21 | 1.99 | 3.24 | 65.05 | 73.01 | 84.89 | |
| Augmented modified covariates XGBoost | Rule quality | 0.28 | 0.51 | 0.70 | 0.23 | 0.63 | 0.84 |
| Empirical FDR (%) | NA | NA | NA | 13.77 | 6.73 | 5.92 | |
| Empirical TPR (%) | NA | NA | NA | 44.50 | 92.00 | 100.00 | |
| Empirical TNR (%) | NA | NA | NA | 99.81 | 99.85 | 99.86 | |
| Mean fit time (s) | 8.06 | 15.47 | 26.13 | 67.35 | 75.95 | 89.19 | |
| AIPW-based LASSO | Rule quality | 0.59 | 0.79 | 0.91 | 0.38 | 0.79 | 0.95 |
| Empirical FDR (%) | 69.33 | 65.56 | 64.59 | 13.57 | 6.39 | 5.96 | |
| Empirical TPR (%) | 93.50 | 99.90 | 100.00 | 43.50 | 91.90 | 100.00 | |
| Empirical TNR (%) | 94.91 | 95.46 | 95.61 | 99.82 | 99.86 | 99.86 | |
| Mean fit time (s) | 700.71 | 784.39 | 945.12 | 73.57 | 86.15 | 105.23 | |
| AIPW-based Super Learner | Rule quality | 0.59 | 0.80 | 0.91 | 0.37 | 0.78 | 0.95 |
| Empirical FDR (%) | NA | NA | NA | 13.58 | 6.52 | 5.89 | |
| Empirical TPR (%) | NA | NA | NA | 43.90 | 92.00 | 100.00 | |
| Empirical TNR (%) | NA | NA | NA | 99.82 | 99.85 | 99.86 | |
| Mean fit time (s) | 732.22 | 846.29 | 1,072.01 | 80.19 | 95.97 | 123.03 | |
| Causal Random Forests | Rule quality | 0.01 | −0.01 | 0.03 | 0.28 | 0.52 | 0.68 |
| Empirical FDR (%) | NA | NA | NA | 12.77 | 6.53 | 6.00 | |
| Empirical TPR (%) | NA | NA | NA | 43.60 | 92.00 | 100.00 | |
| Empirical TNR (%) | NA | NA | NA | 99.82 | 99.85 | 99.86 | |
| Mean fit time (s) | 12.68 | 31.26 | 71.44 | 69.46 | 84.65 | 109.05 | |
Simulation results: observational study with sparse non-linear outcome model and identity covariance matrix.
| CATE estimator | Metric | Unfiltered | TEM-VIP-based filtering | ||||
|---|---|---|---|---|---|---|---|
| n = 250 | n = 500 | n = 1,000 | n = 250 | n = 500 | n = 1,000 | ||
| Plug-in LASSO | Rule quality | 0.74 | 0.89 | 0.92 | 0.54 | 0.88 | 0.94 |
| Empirical FDR (%) | 60.20 | 61.57 | 59.33 | 13.61 | 8.02 | 6.84 | |
| Empirical TPR (%) | 98.00 | 100.00 | 100.00 | 50.40 | 93.20 | 100.00 | |
| Empirical TNR (%) | 96.62 | 96.32 | 96.42 | 99.79 | 99.81 | 99.84 | |
| Mean fit time (s) | 0.56 | 0.76 | 1.36 | 1,288.48 | 1,498.63 | 2,214.52 | |
| Plug-in XGBoost | Rule quality | 0.09 | 0.17 | 0.30 | 0.24 | 0.47 | 0.59 |
| Empirical FDR (%) | NA | NA | NA | 13.34 | 7.87 | 7.07 | |
| Empirical TPR (%) | NA | NA | NA | 50.80 | 93.50 | 100.00 | |
| Empirical TNR (%) | NA | NA | NA | 99.80 | 99.81 | 99.83 | |
| Mean fit time (s) | 2.05 | 5.14 | 13.65 | 1,287.49 | 1,498.99 | 2,222.88 | |
| Modified covariates LASSO | Rule quality | 0.05 | 0.03 | 0.01 | 0.21 | 0.35 | 0.52 |
| Empirical FDR (%) | 69.66 | 63.56 | 50.09 | 13.71 | 7.96 | 7.51 | |
| Empirical TPR (%) | 6.60 | 14.40 | 30.00 | 49.80 | 93.80 | 100.00 | |
| Empirical TNR (%) | 97.88 | 97.51 | 97.31 | 99.79 | 99.81 | 99.82 | |
| Mean fit time (s) | 11.71 | 16.45 | 44.60 | 1,291.44 | 1,504.89 | 2,222.43 | |
| Modified covariates XGBoost | Rule quality | 0.01 | 0.02 | −0.02 | 0.11 | 0.16 | 0.16 |
| Empirical FDR (%) | NA | NA | NA | 13.32 | 7.67 | 7.04 | |
| Empirical TPR (%) | NA | NA | NA | 51.10 | 93.60 | 100.00 | |
| Empirical TNR (%) | NA | NA | NA | 99.79 | 99.82 | 99.83 | |
| Mean fit time (s) | 21.17 | 27.25 | 59.50 | 1,301.96 | 1,515.93 | 2,244.15 | |
| Augmented modified covariates LASSO | Rule quality | 0.51 | 0.80 | 0.88 | 0.35 | 0.85 | 0.93 |
| Empirical FDR (%) | 73.34 | 77.93 | 74.15 | 13.59 | 8.24 | 7.12 | |
| Empirical TPR (%) | 83.10 | 99.60 | 99.80 | 50.60 | 93.50 | 100.00 | |
| Empirical TNR (%) | 92.94 | 91.27 | 92.84 | 99.80 | 99.80 | 99.82 | |
| Mean fit time (s) | 12.29 | 16.82 | 45.95 | 1,293.00 | 1,508.69 | 2,229.23 | |
| Augmented modified covariates XGBoost | Rule quality | 0.26 | 0.55 | 0.68 | 0.20 | 0.69 | 0.81 |
| Empirical FDR (%) | NA | NA | NA | 12.97 | 8.04 | 7.04 | |
| Empirical TPR (%) | NA | NA | NA | 49.00 | 93.40 | 100.00 | |
| Empirical TNR (%) | NA | NA | NA | 99.80 | 99.81 | 99.83 | |
| Mean fit time (s) | 33.07 | 57.02 | 107.41 | 1,303.81 | 1,527.92 | 2,252.42 | |
| AIPW-based LASSO | Rule quality | 0.65 | 0.85 | 0.90 | 0.36 | 0.86 | 0.93 |
| Empirical FDR (%) | 71.60 | 69.97 | 66.02 | 12.92 | 8.60 | 7.17 | |
| Empirical TPR (%) | 96.10 | 100.00 | 100.00 | 49.20 | 94.30 | 100.00 | |
| Empirical TNR (%) | 94.14 | 94.55 | 95.26 | 99.80 | 99.80 | 99.82 | |
| Mean fit time (s) | 750.51 | 859.28 | 1,071.85 | 1,303.96 | 1,527.14 | 2,242.93 | |
| AIPW-based Super Learner | Rule quality | 0.65 | 0.84 | 0.90 | 0.34 | 0.86 | 0.93 |
| Empirical FDR (%) | NA | NA | NA | 13.69 | 8.07 | 7.22 | |
| Empirical TPR (%) | NA | NA | NA | 49.60 | 93.70 | 100.00 | |
| Empirical TNR (%) | NA | NA | NA | 99.79 | 99.81 | 99.82 | |
| Mean fit time (s) | 779.20 | 916.65 | 1,201.11 | 1,313.50 | 1,537.09 | 2,262.57 | |
| Causal Random Forests | Rule quality | 0.01 | −0.01 | −0.04 | 0.18 | 0.38 | 0.49 |
| Empirical FDR (%) | NA | NA | NA | 13.42 | 8.06 | 7.24 | |
| Empirical TPR (%) | NA | NA | NA | 49.20 | 93.20 | 100.00 | |
| Empirical TNR (%) | NA | NA | NA | 99.79 | 99.81 | 99.83 | |
| Mean fit time (s) | 14.93 | 33.12 | 82.13 | 1,293.04 | 1,518.81 | 2,252.98 | |
Simulation results: RCT with sparse non-linear outcome model and block covariance matrix.
| CATE estimator | Metric | Unfiltered | TEM-VIP-based filtering | ||||
|---|---|---|---|---|---|---|---|
| n = 250 | n = 500 | n = 1,000 | n = 250 | n = 500 | n = 1,000 | ||
| Plug-in LASSO | Rule quality | 0.86 | 0.84 | 0.93 | 0.86 | 0.84 | 0.94 |
| Empirical FDR (%) | 75.47 | 74.26 | 74.03 | 10.65 | 7.68 | 8.24 | |
| Empirical TPR (%) | 47.50 | 63.00 | 74.80 | 48.80 | 67.20 | 74.70 | |
| Empirical TNR (%) | 96.77 | 95.93 | 95.32 | 99.86 | 99.86 | 99.84 | |
| Mean fit time (s) | 0.51 | 0.67 | 1.03 | 64.74 | 72.23 | 85.61 | |
| Plug-in XGBoost | Rule quality | 0.29 | 0.37 | 0.60 | 0.67 | 0.68 | 0.78 |
| Empirical FDR (%) | NA | NA | NA | 11.23 | 7.02 | 8.41 | |
| Empirical TPR (%) | NA | NA | NA | 48.50 | 66.90 | 74.70 | |
| Empirical TNR (%) | NA | NA | NA | 99.86 | 99.87 | 99.84 | |
| Mean fit time (s) | 1.98 | 4.80 | 13.95 | 63.80 | 70.77 | 82.57 | |
| Modified covariates LASSO | Rule quality | 0.28 | 0.29 | 0.56 | 0.57 | 0.61 | 0.80 |
| Empirical FDR (%) | 55.51 | 56.47 | 58.35 | 10.83 | 7.25 | 8.46 | |
| Empirical TPR (%) | 8.10 | 13.50 | 24.10 | 48.20 | 67.00 | 74.60 | |
| Empirical TNR (%) | 98.83 | 98.82 | 98.31 | 99.85 | 99.87 | 99.84 | |
| Mean fit time (s) | 0.76 | 2.21 | 9.11 | 63.66 | 70.63 | 81.69 | |
| Modified covariates XGBoost | Rule quality | 0.20 | 0.11 | 0.31 | 0.36 | 0.32 | 0.55 |
| Empirical FDR (%) | NA | NA | NA | 10.11 | 7.74 | 8.35 | |
| Empirical TPR (%) | NA | NA | NA | 48.70 | 67.10 | 74.60 | |
| Empirical TNR (%) | NA | NA | NA | 99.86 | 99.86 | 99.84 | |
| Mean fit time (s) | 3.56 | 4.22 | 7.44 | 66.41 | 73.30 | 85.21 | |
| Augmented modified covariates LASSO | Rule quality | 0.84 | 0.84 | 0.94 | 0.83 | 0.88 | 0.97 |
| Empirical FDR (%) | 66.22 | 71.88 | 72.49 | 10.69 | 7.35 | 8.44 | |
| Empirical TPR (%) | 42.40 | 61.60 | 69.80 | 48.30 | 66.90 | 74.80 | |
| Empirical TNR (%) | 96.75 | 95.48 | 95.37 | 99.86 | 99.87 | 99.84 | |
| Mean fit time (s) | 1.20 | 1.89 | 7.98 | 64.70 | 72.54 | 84.36 | |
| Augmented modified covariates XGBoost | Rule quality | 0.76 | 0.72 | 0.83 | 0.75 | 0.79 | 0.88 |
| Empirical FDR (%) | NA | NA | NA | 10.55 | 7.60 | 8.53 | |
| Empirical TPR (%) | NA | NA | NA | 48.80 | 67.10 | 74.70 | |
| Empirical TNR (%) | NA | NA | NA | 99.85 | 99.86 | 99.84 | |
| Mean fit time (s) | 7.64 | 10.37 | 17.87 | 67.10 | 74.71 | 87.00 | |
| AIPW-based LASSO | Rule quality | 0.85 | 0.84 | 0.94 | 0.83 | 0.89 | 0.97 |
| Empirical FDR (%) | 70.39 | 65.97 | 65.27 | 10.09 | 7.55 | 8.43 | |
| Empirical TPR (%) | 52.50 | 63.40 | 70.30 | 48.10 | 67.30 | 74.60 | |
| Empirical TNR (%) | 96.57 | 96.75 | 96.63 | 99.86 | 99.86 | 99.84 | |
| Mean fit time (s) | 695.05 | 778.12 | 945.00 | 72.96 | 84.03 | 102.92 | |
| AIPW-based Super Learner | Rule quality | 0.85 | 0.83 | 0.92 | 0.83 | 0.86 | 0.94 |
| Empirical FDR (%) | NA | NA | NA | 9.66 | 7.39 | 8.31 | |
| Empirical TPR (%) | NA | NA | NA | 48.10 | 66.90 | 74.70 | |
| Empirical TNR (%) | NA | NA | NA | 99.87 | 99.87 | 99.84 | |
| Mean fit time (s) | 725.98 | 839.18 | 1,168.98 | 79.53 | 93.16 | 119.29 | |
| Causal Random Forests | Rule quality | 0.15 | 0.10 | 0.42 | 0.77 | 0.74 | 0.81 |
| Empirical FDR (%) | NA | NA | NA | 10.51 | 7.82 | 8.65 | |
| Empirical TPR (%) | NA | NA | NA | 48.60 | 67.00 | 74.60 | |
| Empirical TNR (%) | NA | NA | NA | 99.86 | 99.86 | 99.84 | |
| Mean fit time (s) | 13.52 | 34.10 | 80.81 | 69.20 | 82.56 | 105.42 | |
Simulation results: observational study with sparse non-linear outcome model and block covariance matrix.
| CATE estimator | Metric | Unfiltered | TEM-VIP-based filtering | ||||
|---|---|---|---|---|---|---|---|
| n = 250 | n = 500 | n = 1,000 | n = 250 | n = 500 | n = 1,000 | ||
| Plug-in LASSO | Rule quality | 0.80 | 0.78 | 0.87 | 0.79 | 0.79 | 0.88 |
| Empirical FDR (%) | 74.10 | 73.25 | 71.86 | 11.16 | 7.73 | 7.34 | |
| Empirical TPR (%) | 48.60 | 63.20 | 74.40 | 50.70 | 68.60 | 75.10 | |
| Empirical TNR (%) | 96.88 | 96.11 | 95.79 | 99.83 | 99.86 | 99.86 | |
| Mean fit time (s) | 0.54 | 0.72 | 1.31 | 1,285.60 | 1,501.50 | 2,708.36 | |
| Plug-in XGBoost | Rule quality | 0.32 | 0.41 | 0.56 | 0.61 | 0.63 | 0.73 |
| Empirical FDR (%) | NA | NA | NA | 10.83 | 8.01 | 7.11 | |
| Empirical TPR (%) | NA | NA | NA | 51.50 | 68.10 | 74.80 | |
| Empirical TNR (%) | NA | NA | NA | 99.84 | 99.85 | 99.87 | |
| Mean fit time (s) | 2.19 | 4.66 | 13.72 | 1,284.61 | 1,502.65 | 2,716.66 | |
| Modified covariates LASSO | Rule quality | 0.13 | 0.08 | 0.18 | 0.39 | 0.40 | 0.52 |
| Empirical FDR (%) | 60.29 | 63.69 | 55.52 | 12.06 | 8.37 | 7.10 | |
| Empirical TPR (%) | 9.10 | 15.80 | 22.80 | 51.00 | 68.30 | 75.30 | |
| Empirical TNR (%) | 98.14 | 97.44 | 98.27 | 99.82 | 99.85 | 99.87 | |
| Mean fit time (s) | 11.92 | 17.43 | 95.63 | 1,286.64 | 1,507.44 | 2,709.83 | |
| Modified covariates XGBoost | Rule quality | 0.12 | 0.02 | 0.14 | 0.24 | 0.18 | 0.29 |
| Empirical FDR (%) | NA | NA | NA | 11.25 | 8.11 | 7.21 | |
| Empirical TPR (%) | NA | NA | NA | 51.00 | 68.70 | 74.90 | |
| Empirical TNR (%) | NA | NA | NA | 99.84 | 99.85 | 99.86 | |
| Mean fit time (s) | 22.86 | 30.89 | 109.89 | 1,295.73 | 1,518.52 | 2,725.34 | |
| Augmented modified covariates LASSO | Rule quality | 0.72 | 0.78 | 0.88 | 0.77 | 0.84 | 0.92 |
| Empirical FDR (%) | 74.77 | 73.13 | 75.10 | 11.36 | 8.36 | 6.87 | |
| Empirical TPR (%) | 46.40 | 60.40 | 71.00 | 51.20 | 68.40 | 75.00 | |
| Empirical TNR (%) | 94.23 | 95.01 | 94.74 | 99.83 | 99.84 | 99.87 | |
| Mean fit time (s) | 12.30 | 17.69 | 94.37 | 1,288.82 | 1,512.12 | 2,706.51 | |
| Augmented modified covariates XGBoost | Rule quality | 0.68 | 0.68 | 0.78 | 0.69 | 0.74 | 0.82 |
| Empirical FDR (%) | NA | NA | NA | 12.15 | 8.26 | 7.25 | |
| Empirical TPR (%) | NA | NA | NA | 50.80 | 68.30 | 75.00 | |
| Empirical TNR (%) | NA | NA | NA | 99.82 | 99.85 | 99.86 | |
| Mean fit time (s) | 33.46 | 44.63 | 131.79 | 1,304.42 | 1,524.95 | 2,726.26 | |
| AIPW-based LASSO | Rule quality | 0.79 | 0.79 | 0.89 | 0.77 | 0.84 | 0.92 |
| Empirical FDR (%) | 72.21 | 69.47 | 68.88 | 11.18 | 8.77 | 7.08 | |
| Empirical TPR (%) | 53.70 | 64.50 | 70.90 | 51.50 | 68.50 | 75.10 | |
| Empirical TNR (%) | 95.99 | 96.25 | 96.14 | 99.83 | 99.84 | 99.87 | |
| Mean fit time (s) | 749.21 | 865.50 | 1,247.68 | 1,303.10 | 1,525.92 | 2,690.73 | |
| AIPW-based Super Learner | Rule quality | 0.79 | 0.79 | 0.87 | 0.76 | 0.83 | 0.89 |
| Empirical FDR (%) | NA | NA | NA | 10.83 | 8.28 | 6.97 | |
| Empirical TPR (%) | NA | NA | NA | 50.60 | 68.20 | 75.20 | |
| Empirical TNR (%) | NA | NA | NA | 99.84 | 99.85 | 99.87 | |
| Mean fit time (s) | 779.23 | 924.56 | 1,452.27 | 1,312.20 | 1,537.01 | 2,679.75 | |
| Causal Random Forests | Rule quality | 0.06 | −0.06 | −0.01 | 0.69 | 0.69 | 0.76 |
| Empirical FDR (%) | NA | NA | NA | 11.42 | 8.37 | 7.21 | |
| Empirical TPR (%) | NA | NA | NA | 51.20 | 68.20 | 75.30 | |
| Empirical TNR (%) | NA | NA | NA | 99.83 | 99.85 | 99.86 | |
| Mean fit time (s) | 15.66 | 37.75 | 93.58 | 1,290.05 | 1,519.02 | 2,705.30 | |
Simulation results: RCT with non-sparse linear outcome model and identity covariance matrix.
| CATE estimator | Metric | Unfiltered | TEM-VIP-based filtering | ||||
|---|---|---|---|---|---|---|---|
| n = 250 | n = 500 | n = 1,000 | n = 250 | n = 500 | n = 1,000 | ||
| Plug-in LASSO | Rule quality | 0.58 | 0.92 | 0.93 | 0.45 | 0.69 | 0.87 |
| Empirical FDR (%) | 47.50 | 43.85 | 39.97 | 18.48 | 7.14 | 3.58 | |
| Empirical TPR (%) | 49.82 | 99.68 | 100.00 | 4.68 | 33.04 | 82.70 | |
| Empirical TNR (%) | 94.72 | 91.23 | 92.45 | 99.80 | 99.72 | 99.65 | |
| Mean fit time (s) | 0.55 | 0.76 | 1.15 | 64.45 | 71.90 | 83.55 | |
| Plug-in XGBoost | Rule quality | 0.21 | 0.33 | 0.41 | 0.38 | 0.45 | 0.49 |
| Empirical FDR (%) | NA | NA | NA | 16.82 | 7.28 | 3.61 | |
| Empirical TPR (%) | NA | NA | NA | 4.66 | 33.08 | 82.74 | |
| Empirical TNR (%) | NA | NA | NA | 99.81 | 99.72 | 99.64 | |
| Mean fit time (s) | 2.05 | 4.60 | 13.69 | 63.43 | 70.61 | 83.51 | |
| Modified covariates LASSO | Rule quality | 0.43 | 0.48 | 0.48 | 0.42 | 0.59 | 0.71 |
| Empirical FDR (%) | 52.64 | 39.92 | 51.37 | 19.90 | 7.25 | 3.64 | |
| Empirical TPR (%) | 4.72 | 7.60 | 21.74 | 4.88 | 32.96 | 82.80 | |
| Empirical TNR (%) | 98.20 | 98.25 | 95.94 | 99.78 | 99.72 | 99.64 | |
| Mean fit time (s) | 0.65 | 2.10 | 1.21 | 63.30 | 70.41 | 81.51 | |
| Modified covariates XGBoost | Rule quality | 0.44 | 0.48 | 0.43 | 0.44 | 0.52 | 0.56 |
| Empirical FDR (%) | NA | NA | NA | 17.79 | 7.12 | 3.60 | |
| Empirical TPR (%) | NA | NA | NA | 4.84 | 33.04 | 82.68 | |
| Empirical TNR (%) | NA | NA | NA | 99.79 | 99.72 | 99.64 | |
| Mean fit time (s) | 3.00 | 4.19 | 6.49 | 65.58 | 72.94 | 85.37 | |
| Augmented modified covariates LASSO | Rule quality | 0.54 | 0.84 | 0.92 | 0.43 | 0.62 | 0.84 |
| Empirical FDR (%) | 52.67 | 64.58 | 66.10 | 17.92 | 7.11 | 3.60 | |
| Empirical TPR (%) | 27.84 | 93.98 | 100.00 | 4.74 | 33.16 | 82.68 | |
| Empirical TNR (%) | 94.28 | 80.28 | 77.87 | 99.79 | 99.72 | 99.64 | |
| Mean fit time (s) | 1.34 | 2.14 | 3.20 | 64.45 | 72.22 | 83.43 | |
| Augmented modified covariates XGBoost | Rule quality | 0.47 | 0.65 | 0.77 | 0.45 | 0.54 | 0.75 |
| Empirical FDR (%) | NA | NA | NA | 17.43 | 7.05 | 3.55 | |
| Empirical TPR (%) | NA | NA | NA | 4.74 | 33.02 | 82.74 | |
| Empirical TNR (%) | NA | NA | NA | 99.78 | 99.73 | 99.65 | |
| Mean fit time (s) | 5.47 | 29.67 | 98.29 | 65.78 | 73.61 | 93.18 | |
| AIPW-based LASSO | Rule quality | 0.59 | 0.90 | 0.92 | 0.44 | 0.62 | 0.84 |
| Empirical FDR (%) | 57.47 | 55.96 | 52.43 | 18.89 | 7.21 | 3.55 | |
| Empirical TPR (%) | 52.16 | 99.12 | 100.00 | 5.04 | 33.18 | 82.72 | |
| Empirical TNR (%) | 91.27 | 85.78 | 87.49 | 99.76 | 99.72 | 99.65 | |
| Mean fit time (s) | 690.79 | 771.17 | 926.92 | 71.76 | 89.88 | 129.04 | |
| AIPW-based Super Learner | Rule quality | 0.59 | 0.90 | 0.92 | 0.42 | 0.62 | 0.84 |
| Empirical FDR (%) | NA | NA | NA | 16.44 | 7.03 | 3.64 | |
| Empirical TPR (%) | NA | NA | NA | 5.08 | 33.12 | 82.80 | |
| Empirical TNR (%) | NA | NA | NA | 99.79 | 99.72 | 99.64 | |
| Mean fit time (s) | 723.86 | 835.28 | 1,050.34 | 77.39 | 102.05 | 161.40 | |
| Causal Random Forests | Rule quality | 0.44 | 0.49 | 0.45 | 0.45 | 0.54 | 0.49 |
| Empirical FDR (%) | NA | NA | NA | 18.12 | 7.18 | 3.56 | |
| Empirical TPR (%) | NA | NA | NA | 4.84 | 33.16 | 82.76 | |
| Empirical TNR (%) | NA | NA | NA | 99.80 | 99.72 | 99.65 | |
| Mean fit time (s) | 13.88 | 30.26 | 67.22 | 68.61 | 86.01 | 123.85 | |
Simulation results: observational study with non-sparse linear outcome model and identity covariance matrix.
| CATE estimator | Metric | Unfiltered | TEM-VIP-based filtering | ||||
|---|---|---|---|---|---|---|---|
| n = 250 | n = 500 | n = 1,000 | n = 250 | n = 500 | n = 1,000 | ||
| Plug-in LASSO | Rule quality | 0.64 | 0.93 | 0.97 | 0.49 | 0.70 | 0.91 |
| Empirical FDR (%) | 46.18 | 43.92 | 40.70 | 20.28 | 5.84 | 4.31 | |
| Empirical TPR (%) | 50.94 | 99.42 | 100.00 | 4.26 | 35.76 | 83.50 | |
| Empirical TNR (%) | 95.02 | 91.23 | 92.24 | 99.81 | 99.73 | 99.57 | |
| Mean fit time (s) | 0.56 | 0.78 | 1.32 | 1,244.32 | 1,450.47 | 2,129.83 | |
| Plug-in XGBoost | Rule quality | 0.31 | 0.37 | 0.44 | 0.45 | 0.49 | 0.53 |
| Empirical FDR (%) | NA | NA | NA | 21.00 | 5.69 | 4.22 | |
| Empirical TPR (%) | NA | NA | NA | 4.54 | 35.60 | 83.44 | |
| Empirical TNR (%) | NA | NA | NA | 99.78 | 99.73 | 99.58 | |
| Mean fit time (s) | 2.16 | 5.05 | 13.83 | 1,244.99 | 1,446.94 | 2,138.34 | |
| Modified covariates LASSO | Rule quality | 0.49 | 0.48 | 0.51 | 0.50 | 0.58 | 0.73 |
| Empirical FDR (%) | 53.91 | 53.01 | 53.24 | 22.05 | 6.22 | 4.35 | |
| Empirical TPR (%) | 4.16 | 7.94 | 24.36 | 4.46 | 35.36 | 83.44 | |
| Empirical TNR (%) | 97.54 | 97.56 | 95.19 | 99.79 | 99.71 | 99.57 | |
| Mean fit time (s) | 11.32 | 15.79 | 42.52 | 1,247.94 | 1,447.56 | 2,139.97 | |
| Modified covariates XGBoost | Rule quality | 0.49 | 0.48 | 0.49 | 0.50 | 0.54 | 0.58 |
| Empirical FDR (%) | NA | NA | NA | 20.34 | 5.69 | 4.45 | |
| Empirical TPR (%) | NA | NA | NA | 4.36 | 35.30 | 83.48 | |
| Empirical TNR (%) | NA | NA | NA | 99.81 | 99.74 | 99.56 | |
| Mean fit time (s) | 21.67 | 28.57 | 62.41 | 1,256.05 | 1,462.82 | 2,162.50 | |
| Augmented modified covariates LASSO | Rule quality | 0.56 | 0.84 | 0.95 | 0.51 | 0.62 | 0.88 |
| Empirical FDR (%) | 57.28 | 65.98 | 67.46 | 22.56 | 6.00 | 4.41 | |
| Empirical TPR (%) | 26.32 | 93.62 | 100.00 | 4.48 | 35.52 | 83.14 | |
| Empirical TNR (%) | 94.55 | 78.76 | 75.88 | 99.79 | 99.72 | 99.56 | |
| Mean fit time (s) | 11.95 | 16.38 | 44.77 | 1,250.36 | 1,449.69 | 2,140.68 | |
| Augmented modified covariates XGBoost | Rule quality | 0.52 | 0.64 | 0.81 | 0.50 | 0.57 | 0.80 |
| Empirical FDR (%) | NA | NA | NA | 21.05 | 5.91 | 4.36 | |
| Empirical TPR (%) | NA | NA | NA | 4.78 | 35.60 | 83.48 | |
| Empirical TNR (%) | NA | NA | NA | 99.78 | 99.73 | 99.57 | |
| Mean fit time (s) | 25.82 | 89.09 | 236.97 | 1,258.51 | 1,466.26 | 2,194.13 | |
| AIPW-based LASSO | Rule quality | 0.64 | 0.91 | 0.96 | 0.51 | 0.63 | 0.88 |
| Empirical FDR (%) | 58.46 | 58.06 | 53.37 | 21.07 | 5.82 | 4.46 | |
| Empirical TPR (%) | 56.00 | 98.96 | 100.00 | 4.46 | 35.28 | 83.48 | |
| Empirical TNR (%) | 90.68 | 84.54 | 86.95 | 99.79 | 99.73 | 99.56 | |
| Mean fit time (s) | 719.46 | 817.62 | 1,027.26 | 1,257.46 | 1,470.86 | 2,199.02 | |
| AIPW-based Super Learner | Rule quality | 0.63 | 0.91 | 0.96 | 0.49 | 0.62 | 0.88 |
| Empirical FDR (%) | NA | NA | NA | 22.45 | 5.81 | 4.35 | |
| Empirical TPR (%) | NA | NA | NA | 4.56 | 35.10 | 83.10 | |
| Empirical TNR (%) | NA | NA | NA | 99.78 | 99.74 | 99.57 | |
| Mean fit time (s) | 748.58 | 875.43 | 1,154.68 | 1,259.41 | 1,483.30 | 2,220.65 | |
| Causal Random Forests | Rule quality | 0.51 | 0.49 | 0.49 | 0.51 | 0.49 | 0.49 |
| Empirical FDR (%) | NA | NA | NA | 22.46 | 5.65 | 4.44 | |
| Empirical TPR (%) | NA | NA | NA | 4.50 | 35.56 | 83.40 | |
| Empirical TNR (%) | NA | NA | NA | 99.78 | 99.74 | 99.56 | |
| Mean fit time (s) | 15.10 | 33.61 | 79.68 | 1,244.90 | 1,467.12 | 2,185.54 | |
Simulation results: RCT with non-sparse linear outcome model and block covariance matrix.
| CATE estimator | Metric | Unfiltered | TEM-VIP-based filtering | ||||
|---|---|---|---|---|---|---|---|
| n = 250 | n = 500 | n = 1,000 | n = 250 | n = 500 | n = 1,000 | ||
| Plug-in LASSO | Rule quality | 0.93 | 0.95 | 0.95 | 0.87 | 0.91 | 0.93 |
| Empirical FDR (%) | 47.78 | 46.78 | 46.36 | 7.62 | 3.96 | 3.12 | |
| Empirical TPR (%) | 42.16 | 61.14 | 73.58 | 26.80 | 51.36 | 67.10 | |
| Empirical TNR (%) | 95.57 | 93.80 | 92.82 | 99.75 | 99.75 | 99.75 | |
| Mean fit time (s) | 0.53 | 0.69 | 1.09 | 64.13 | 71.02 | 84.58 | |
| Plug-in XGBoost | Rule quality | 0.32 | 0.45 | 0.57 | 0.60 | 0.64 | 0.69 |
| Empirical FDR (%) | NA | NA | NA | 7.31 | 3.92 | 3.12 | |
| Empirical TPR (%) | NA | NA | NA | 26.92 | 51.32 | 67.10 | |
| Empirical TNR (%) | NA | NA | NA | 99.75 | 99.75 | 99.75 | |
| Mean fit time (s) | 2.10 | 4.91 | 14.47 | 63.25 | 70.53 | 83.11 | |
| Modified covariates LASSO | Rule quality | 0.55 | 0.62 | 0.73 | 0.73 | 0.78 | 0.84 |
| Empirical FDR (%) | 47.74 | 50.53 | 51.99 | 7.55 | 3.89 | 3.13 | |
| Empirical TPR (%) | 5.72 | 13.80 | 25.38 | 26.94 | 51.26 | 67.02 | |
| Empirical TNR (%) | 98.39 | 97.29 | 95.92 | 99.74 | 99.76 | 99.75 | |
| Mean fit time (s) | 0.65 | 1.81 | 8.31 | 63.07 | 70.43 | 81.39 | |
| Modified covariates XGBoost | Rule quality | 0.54 | 0.52 | 0.58 | 0.65 | 0.68 | 0.73 |
| Empirical FDR (%) | NA | NA | NA | 7.60 | 4.07 | 3.07 | |
| Empirical TPR (%) | NA | NA | NA | 26.84 | 51.44 | 67.08 | |
| Empirical TNR (%) | NA | NA | NA | 99.74 | 99.74 | 99.76 | |
| Mean fit time (s) | 3.00 | 4.61 | 9.14 | 65.59 | 72.82 | 84.71 | |
| Augmented modified covariates LASSO | Rule quality | 0.88 | 0.93 | 0.94 | 0.80 | 0.89 | 0.94 |
| Empirical FDR (%) | 60.10 | 63.63 | 66.83 | 7.73 | 4.03 | 3.12 | |
| Empirical TPR (%) | 35.88 | 57.70 | 69.82 | 26.88 | 51.34 | 67.06 | |
| Empirical TNR (%) | 93.01 | 88.26 | 83.55 | 99.74 | 99.75 | 99.75 | |
| Mean fit time (s) | 1.27 | 2.00 | 6.20 | 64.33 | 71.79 | 82.71 | |
| Augmented modified covariates XGBoost | Rule quality | 0.75 | 0.84 | 0.87 | 0.75 | 0.83 | 0.88 |
| Empirical FDR (%) | NA | NA | NA | 7.60 | 3.91 | 3.12 | |
| Empirical TPR (%) | NA | NA | NA | 27.46 | 51.36 | 67.10 | |
| Empirical TNR (%) | NA | NA | NA | 99.74 | 99.75 | 99.75 | |
| Mean fit time (s) | 11.03 | 27.33 | 57.07 | 66.36 | 74.97 | 90.38 | |
| AIPW-based LASSO | Rule quality | 0.91 | 0.94 | 0.94 | 0.81 | 0.90 | 0.94 |
| Empirical FDR (%) | 55.98 | 55.23 | 56.07 | 7.78 | 3.94 | 3.09 | |
| Empirical TPR (%) | 44.00 | 60.26 | 71.14 | 26.84 | 51.22 | 67.08 | |
| Empirical TNR (%) | 93.16 | 91.40 | 89.51 | 99.74 | 99.75 | 99.76 | |
| Mean fit time (s) | 690.17 | 770.09 | 930.39 | 75.74 | 93.21 | 121.72 | |
| AIPW-based Super Learner | Rule quality | 0.91 | 0.94 | 0.94 | 0.81 | 0.90 | 0.93 |
| Empirical FDR (%) | NA | NA | NA | 7.73 | 3.84 | 3.09 | |
| Empirical TPR (%) | NA | NA | NA | 27.10 | 51.44 | 67.08 | |
| Empirical TNR (%) | NA | NA | NA | 99.74 | 99.76 | 99.76 | |
| Mean fit time (s) | 723.10 | 833.32 | 1,115.03 | 83.23 | 107.56 | 150.30 | |
| Causal Random Forests | Rule quality | 0.55 | 0.52 | 0.50 | 0.72 | 0.72 | 0.73 |
| Empirical FDR (%) | NA | NA | NA | 7.93 | 3.85 | 3.12 | |
| Empirical TPR (%) | NA | NA | NA | 27.12 | 51.36 | 67.08 | |
| Empirical TNR (%) | NA | NA | NA | 99.73 | 99.76 | 99.75 | |
| Mean fit time (s) | 14.71 | 32.72 | 79.30 | 71.31 | 89.65 | 124.53 | |
Simulation results: observational study with non-sparse linear outcome model and block covariance matrix.
| CATE estimator | Metric | Unfiltered | TEM-VIP-based filtering | ||||
|---|---|---|---|---|---|---|---|
| n = 250 | n = 500 | n = 1,000 | n = 250 | n = 500 | n = 1,000 | ||
| Plug-in LASSO | Rule quality | 0.91 | 0.92 | 1.00 | 0.86 | 0.89 | 0.98 |
| Empirical FDR (%) | 47.76 | 47.30 | 45.99 | 6.55 | 4.92 | 3.61 | |
| Empirical TPR (%) | 43.06 | 60.40 | 73.98 | 29.50 | 51.86 | 67.64 | |
| Empirical TNR (%) | 95.46 | 93.80 | 92.87 | 99.75 | 99.68 | 99.71 | |
| Mean fit time (s) | 0.55 | 0.71 | 1.30 | 1,245.84 | 1,454.06 | 2,593.35 | |
| Plug-in XGBoost | Rule quality | 0.40 | 0.49 | 0.64 | 0.58 | 0.61 | 0.74 |
| Empirical FDR (%) | NA | NA | NA | 7.07 | 4.72 | 3.61 | |
| Empirical TPR (%) | NA | NA | NA | 29.30 | 51.70 | 67.66 | |
| Empirical TNR (%) | NA | NA | NA | 99.72 | 99.70 | 99.71 | |
| Mean fit time (s) | 2.25 | 4.48 | 13.69 | 1,243.62 | 1,446.91 | 2,596.23 | |
| Modified covariates LASSO | Rule quality | 0.55 | 0.54 | 0.68 | 0.69 | 0.73 | 0.85 |
| Empirical FDR (%) | 60.98 | 48.19 | 53.87 | 6.43 | 4.89 | 3.62 | |
| Empirical TPR (%) | 7.52 | 12.16 | 24.78 | 29.06 | 52.02 | 67.70 | |
| Empirical TNR (%) | 97.39 | 97.19 | 95.81 | 99.76 | 99.68 | 99.71 | |
| Mean fit time (s) | 11.46 | 17.08 | 91.95 | 1,250.49 | 1,457.11 | 2,599.80 | |
| Modified covariates XGBoost | Rule quality | 0.53 | 0.51 | 0.62 | 0.62 | 0.62 | 0.73 |
| Empirical FDR (%) | NA | NA | NA | 6.26 | 4.90 | 3.60 | |
| Empirical TPR (%) | NA | NA | NA | 29.24 | 51.90 | 67.52 | |
| Empirical TNR (%) | NA | NA | NA | 99.76 | 99.68 | 99.71 | |
| Mean fit time (s) | 23.46 | 31.15 | 112.34 | 1,256.65 | 1,468.72 | 2,624.43 | |
| Augmented modified covariates LASSO | Rule quality | 0.83 | 0.90 | 0.99 | 0.78 | 0.87 | 0.98 |
| Empirical FDR (%) | 60.93 | 64.53 | 67.19 | 6.77 | 4.74 | 3.61 | |
| Empirical TPR (%) | 36.20 | 56.52 | 69.42 | 29.84 | 51.90 | 67.64 | |
| Empirical TNR (%) | 92.36 | 87.72 | 83.32 | 99.73 | 99.70 | 99.71 | |
| Mean fit time (s) | 12.07 | 17.10 | 89.35 | 1,247.60 | 1,457.27 | 2,605.49 | |
| Augmented modified covariates XGBoost | Rule quality | 0.72 | 0.81 | 0.92 | 0.72 | 0.81 | 0.93 |
| Empirical FDR (%) | NA | NA | NA | 6.49 | 4.92 | 3.56 | |
| Empirical TPR (%) | NA | NA | NA | 29.18 | 51.98 | 67.66 | |
| Empirical TNR (%) | NA | NA | NA | 99.75 | 99.68 | 99.71 | |
| Mean fit time (s) | 45.71 | 86.56 | 212.64 | 1,258.50 | 1,478.16 | 2,654.82 | |
| AIPW-based LASSO | Rule quality | 0.89 | 0.92 | 0.99 | 0.80 | 0.87 | 0.98 |
| Empirical FDR (%) | 57.39 | 56.95 | 56.70 | 6.54 | 4.81 | 3.63 | |
| Empirical TPR (%) | 46.14 | 60.86 | 72.20 | 29.68 | 52.04 | 67.64 | |
| Empirical TNR (%) | 92.66 | 90.78 | 89.08 | 99.74 | 99.69 | 99.70 | |
| Mean fit time (s) | 719.27 | 824.58 | 1,195.33 | 1,257.30 | 1,481.06 | 2,634.83 | |
| AIPW-based Super Learner | Rule quality | 0.90 | 0.92 | 0.99 | 0.80 | 0.88 | 0.98 |
| Empirical FDR (%) | NA | NA | NA | 7.17 | 5.03 | 3.60 | |
| Empirical TPR (%) | NA | NA | NA | 29.70 | 51.96 | 67.70 | |
| Empirical TNR (%) | NA | NA | NA | 99.73 | 99.68 | 99.71 | |
| Mean fit time (s) | 747.26 | 881.33 | 1,357.61 | 1,266.63 | 1,488.79 | 2,636.36 | |
| Causal Random Forests | Rule quality | 0.53 | 0.49 | 0.56 | 0.60 | 0.58 | 0.68 |
| Empirical FDR (%) | NA | NA | NA | 6.41 | 4.90 | 3.62 | |
| Empirical TPR (%) | NA | NA | NA | 28.96 | 52.12 | 67.86 | |
| Empirical TNR (%) | NA | NA | NA | 99.76 | 99.68 | 99.70 | |
| Mean fit time (s) | 15.71 | 35.59 | 90.24 | 1,250.24 | 1,470.02 | 2,642.60 | |
Simulation results: RCT with non-sparse non-linear outcome model and identity covariance matrix.
| CATE estimator | Metric | Unfiltered | TEM-VIP-based filtering | ||||
|---|---|---|---|---|---|---|---|
| n = 250 | n = 500 | n = 1,000 | n = 250 | n = 500 | n = 1,000 | ||
| Plug-in LASSO | Rule quality | 0.24 | 0.56 | 0.88 | 0.06 | 0.27 | 0.62 |
| Empirical FDR (%) | 49.56 | 45.71 | 44.93 | 23.52 | 14.31 | 7.42 | |
| Empirical TPR (%) | 32.00 | 76.30 | 99.42 | 2.48 | 11.18 | 47.74 | |
| Empirical TNR (%) | 96.16 | 92.64 | 90.86 | 99.79 | 99.76 | 99.56 | |
| Mean fit time (s) | 0.55 | 0.78 | 1.36 | 65.97 | 74.40 | 86.94 | |
| Plug-in XGBoost | Rule quality | −0.01 | 0.05 | 0.10 | 0.02 | 0.11 | 0.20 |
| Empirical FDR (%) | NA | NA | NA | 19.73 | 13.22 | 7.43 | |
| Empirical TPR (%) | NA | NA | NA | 2.28 | 11.20 | 47.88 | |
| Empirical TNR (%) | NA | NA | NA | 99.84 | 99.78 | 99.55 | |
| Mean fit time (s) | 1.98 | 4.86 | 13.89 | 64.78 | 72.69 | 85.90 | |
| Modified covariates LASSO | Rule quality | 0.01 | 0.06 | 0.11 | 0.03 | 0.17 | 0.36 |
| Empirical FDR (%) | 55.94 | 55.01 | 46.40 | 17.73 | 13.05 | 7.43 | |
| Empirical TPR (%) | 2.40 | 2.70 | 4.94 | 2.40 | 10.92 | 47.60 | |
| Empirical TNR (%) | 98.68 | 99.00 | 98.69 | 99.86 | 99.78 | 99.56 | |
| Mean fit time (s) | 0.70 | 2.34 | 2.62 | 64.78 | 72.51 | 85.18 | |
| Modified covariates XGBoost | Rule quality | −0.02 | 0.06 | 0.10 | 0.00 | 0.09 | 0.25 |
| Empirical FDR (%) | NA | NA | NA | 21.94 | 12.43 | 7.37 | |
| Empirical TPR (%) | NA | NA | NA | 2.46 | 11.38 | 47.90 | |
| Empirical TNR (%) | NA | NA | NA | 99.83 | 99.78 | 99.56 | |
| Mean fit time (s) | 10.02 | 11.86 | 17.79 | 72.03 | 81.80 | 96.96 | |
| Augmented modified covariates LASSO | Rule quality | 0.08 | 0.42 | 0.80 | 0.03 | 0.18 | 0.49 |
| Empirical FDR (%) | 52.84 | 56.62 | 64.47 | 22.28 | 13.53 | 7.35 | |
| Empirical TPR (%) | 11.92 | 52.34 | 96.80 | 2.50 | 11.26 | 47.52 | |
| Empirical TNR (%) | 97.35 | 90.48 | 79.80 | 99.82 | 99.78 | 99.56 | |
| Mean fit time (s) | 1.49 | 2.40 | 3.66 | 65.77 | 75.59 | 88.95 | |
| Augmented modified covariates XGBoost | Rule quality | 0.07 | 0.23 | 0.51 | 0.00 | 0.11 | 0.36 |
| Empirical FDR (%) | NA | NA | NA | 22.09 | 13.06 | 7.41 | |
| Empirical TPR (%) | NA | NA | NA | 2.50 | 11.32 | 47.62 | |
| Empirical TNR (%) | NA | NA | NA | 99.81 | 99.77 | 99.56 | |
| Mean fit time (s) | 15.59 | 23.18 | 75.12 | 72.71 | 81.47 | 100.49 | |
| AIPW-based LASSO | Rule quality | 0.19 | 0.49 | 0.81 | 0.04 | 0.18 | 0.50 |
| Empirical FDR (%) | 54.44 | 54.00 | 53.99 | 21.95 | 14.37 | 7.36 | |
| Empirical TPR (%) | 27.70 | 69.78 | 98.24 | 2.50 | 10.98 | 48.02 | |
| Empirical TNR (%) | 94.94 | 90.29 | 86.88 | 99.80 | 99.77 | 99.56 | |
| Mean fit time (s) | 709.70 | 796.43 | 970.79 | 75.40 | 88.13 | 117.51 | |
| AIPW-based Super Learner | Rule quality | 0.22 | 0.49 | 0.81 | 0.03 | 0.18 | 0.53 |
| Empirical FDR (%) | NA | NA | NA | 20.33 | 12.28 | 7.33 | |
| Empirical TPR (%) | NA | NA | NA | 2.44 | 11.20 | 47.84 | |
| Empirical TNR (%) | NA | NA | NA | 99.83 | 99.79 | 99.56 | |
| Mean fit time (s) | 742.66 | 856.73 | 1,098.70 | 81.30 | 98.50 | 143.29 | |
| Causal Random Forests | Rule quality | 0.00 | 0.05 | 0.10 | 0.03 | 0.14 | 0.35 |
| Empirical FDR (%) | NA | NA | NA | 19.93 | 13.72 | 7.59 | |
| Empirical TPR (%) | NA | NA | NA | 2.42 | 11.06 | 48.04 | |
| Empirical TNR (%) | NA | NA | NA | 99.83 | 99.78 | 99.54 | |
| Mean fit time (s) | 13.87 | 29.14 | 68.09 | 72.10 | 86.70 | 127.29 | |
Simulation results: observational study with non-sparse non-linear outcome model and identity covariance matrix.
| CATE estimator | Metric | Unfiltered | TEM-VIP-based filtering | ||||
|---|---|---|---|---|---|---|---|
| n = 250 | n = 500 | n = 1,000 | n = 250 | n = 500 | n = 1,000 | ||
| Plug-in LASSO | Rule quality | 0.28 | 0.51 | 0.74 | 0.10 | 0.27 | 0.53 |
| Empirical FDR (%) | 47.71 | 44.51 | 45.48 | 27.09 | 17.74 | 8.42 | |
| Empirical TPR (%) | 32.66 | 75.22 | 99.26 | 3.12 | 17.14 | 52.74 | |
| Empirical TNR (%) | 96.41 | 92.99 | 90.64 | 99.77 | 99.52 | 99.42 | |
| Mean fit time (s) | 0.56 | 0.79 | 1.37 | 1,264.10 | 1,464.83 | 2,152.27 | |
| Plug-in XGBoost | Rule quality | 0.02 | 0.01 | −0.01 | 0.05 | 0.08 | 0.06 |
| Empirical FDR (%) | NA | NA | NA | 26.45 | 18.62 | 8.26 | |
| Empirical TPR (%) | NA | NA | NA | 3.14 | 17.08 | 52.16 | |
| Empirical TNR (%) | NA | NA | NA | 99.76 | 99.52 | 99.44 | |
| Mean fit time (s) | 2.26 | 4.65 | 14.03 | 1,262.08 | 1,458.83 | 2,154.81 | |
| Modified covariates LASSO | Rule quality | 0.02 | 0.00 | −0.04 | 0.05 | 0.09 | 0.11 |
| Empirical FDR (%) | 59.57 | 59.08 | 46.13 | 27.80 | 18.13 | 8.39 | |
| Empirical TPR (%) | 2.22 | 2.96 | 6.40 | 2.96 | 16.68 | 52.76 | |
| Empirical TNR (%) | 98.30 | 98.36 | 97.51 | 99.77 | 99.51 | 99.42 | |
| Mean fit time (s) | 11.50 | 16.41 | 43.46 | 1,264.86 | 1,465.85 | 2,166.97 | |
| Modified covariates XGBoost | Rule quality | 0.01 | −0.01 | −0.05 | 0.02 | 0.04 | 0.01 |
| Empirical FDR (%) | NA | NA | NA | 30.73 | 17.68 | 8.60 | |
| Empirical TPR (%) | NA | NA | NA | 2.96 | 16.86 | 53.26 | |
| Empirical TNR (%) | NA | NA | NA | 99.76 | 99.54 | 99.41 | |
| Mean fit time (s) | 20.91 | 26.58 | 57.12 | 1,271.27 | 1,474.22 | 2,177.19 | |
| Augmented modified covariates LASSO | Rule quality | 0.14 | 0.34 | 0.63 | 0.09 | 0.13 | 0.34 |
| Empirical FDR (%) | 59.12 | 60.10 | 65.89 | 28.96 | 18.57 | 8.45 | |
| Empirical TPR (%) | 12.56 | 49.62 | 93.10 | 3.34 | 16.68 | 53.16 | |
| Empirical TNR (%) | 96.57 | 90.51 | 79.93 | 99.73 | 99.50 | 99.42 | |
| Mean fit time (s) | 12.24 | 16.68 | 45.01 | 1,260.81 | 1,465.51 | 2,168.90 | |
| Augmented modified covariates XGBoost | Rule quality | 0.07 | 0.19 | 0.38 | 0.05 | 0.06 | 0.17 |
| Empirical FDR (%) | NA | NA | NA | 29.46 | 17.87 | 8.31 | |
| Empirical TPR (%) | NA | NA | NA | 3.04 | 17.04 | 52.44 | |
| Empirical TNR (%) | NA | NA | NA | 99.75 | 99.54 | 99.43 | |
| Mean fit time (s) | 26.00 | 39.51 | 121.43 | 1,269.92 | 1,473.57 | 2,183.60 | |
| AIPW-based LASSO | Rule quality | 0.23 | 0.46 | 0.69 | 0.06 | 0.13 | 0.36 |
| Empirical FDR (%) | 57.64 | 55.89 | 54.84 | 29.34 | 17.82 | 8.33 | |
| Empirical TPR (%) | 32.78 | 74.06 | 98.22 | 2.90 | 16.62 | 52.88 | |
| Empirical TNR (%) | 93.88 | 89.08 | 86.49 | 99.78 | 99.53 | 99.42 | |
| Mean fit time (s) | 729.03 | 829.63 | 1,045.16 | 1,268.48 | 1,483.21 | 2,209.84 | |
| AIPW-based Super Learner | Rule quality | 0.25 | 0.46 | 0.69 | 0.06 | 0.12 | 0.34 |
| Empirical FDR (%) | NA | NA | NA | 31.00 | 19.25 | 8.55 | |
| Empirical TPR (%) | NA | NA | NA | 3.34 | 16.96 | 53.18 | |
| Empirical TNR (%) | NA | NA | NA | 99.72 | 99.48 | 99.41 | |
| Mean fit time (s) | 757.21 | 884.50 | 1,166.49 | 1,274.90 | 1,494.74 | 2,225.23 | |
| Causal Random Forests | Rule quality | 0.01 | −0.02 | −0.06 | 0.02 | 0.02 | −0.03 |
| Empirical FDR (%) | NA | NA | NA | 28.34 | 18.25 | 8.53 | |
| Empirical TPR (%) | NA | NA | NA | 3.10 | 16.24 | 53.90 | |
| Empirical TNR (%) | NA | NA | NA | 99.74 | 99.53 | 99.40 | |
| Mean fit time (s) | 14.96 | 33.27 | 78.61 | 1,259.24 | 1,473.02 | 2,204.43 | |
Simulation results: RCT with non-sparse non-linear outcome model and block covariance matrix.
| CATE estimator | Metric | Unfiltered | TEM-VIP-based filtering | ||||
|---|---|---|---|---|---|---|---|
| n = 250 | n = 500 | n = 1,000 | n = 250 | n = 500 | n = 1,000 | ||
| Plug-in LASSO | Rule quality | 0.68 | 0.73 | 0.83 | 0.57 | 0.70 | 0.80 |
| Empirical FDR (%) | 50.24 | 47.74 | 49.22 | 11.53 | 6.96 | 5.59 | |
| Empirical TPR (%) | 30.84 | 44.68 | 57.02 | 13.72 | 36.56 | 57.18 | |
| Empirical TNR (%) | 96.33 | 95.26 | 93.64 | 99.76 | 99.67 | 99.61 | |
| Mean fit time (s) | 0.52 | 0.70 | 1.06 | 64.46 | 72.09 | 84.93 | |
| Plug-in XGBoost | Rule quality | 0.16 | 0.00 | 0.12 | 0.32 | 0.27 | 0.38 |
| Empirical FDR (%) | NA | NA | NA | 11.61 | 6.67 | 5.63 | |
| Empirical TPR (%) | NA | NA | NA | 13.62 | 36.66 | 57.14 | |
| Empirical TNR (%) | NA | NA | NA | 99.74 | 99.69 | 99.60 | |
| Mean fit time (s) | 2.07 | 4.19 | 13.06 | 63.38 | 70.78 | 81.83 | |
| Modified covariates LASSO | Rule quality | 0.17 | 0.09 | 0.23 | 0.39 | 0.36 | 0.53 |
| Empirical FDR (%) | 55.78 | 57.79 | 48.19 | 11.11 | 6.35 | 5.63 | |
| Empirical TPR (%) | 2.36 | 4.86 | 11.20 | 13.56 | 36.50 | 57.04 | |
| Empirical TNR (%) | 98.86 | 98.47 | 97.72 | 99.77 | 99.70 | 99.60 | |
| Mean fit time (s) | 0.86 | 2.82 | 15.14 | 63.26 | 70.11 | 80.43 | |
| Modified covariates XGBoost | Rule quality | 0.15 | 0.04 | 0.11 | 0.30 | 0.25 | 0.36 |
| Empirical FDR (%) | NA | NA | NA | 11.26 | 6.67 | 5.58 | |
| Empirical TPR (%) | NA | NA | NA | 13.58 | 36.56 | 57.26 | |
| Empirical TNR (%) | NA | NA | NA | 99.76 | 99.70 | 99.60 | |
| Mean fit time (s) | 3.36 | 4.35 | 7.10 | 65.68 | 73.23 | 84.44 | |
| Augmented modified covariates LASSO | Rule quality | 0.55 | 0.69 | 0.80 | 0.44 | 0.59 | 0.78 |
| Empirical FDR (%) | 52.56 | 58.05 | 62.54 | 10.81 | 6.69 | 5.58 | |
| Empirical TPR (%) | 20.72 | 39.60 | 53.12 | 14.00 | 36.28 | 57.18 | |
| Empirical TNR (%) | 96.06 | 93.01 | 89.37 | 99.75 | 99.69 | 99.61 | |
| Mean fit time (s) | 1.30 | 2.33 | 8.29 | 64.37 | 72.30 | 83.50 | |
| Augmented modified covariates XGBoost | Rule quality | 0.40 | 0.50 | 0.64 | 0.34 | 0.48 | 0.66 |
| Empirical FDR (%) | NA | NA | NA | 11.62 | 6.79 | 5.41 | |
| Empirical TPR (%) | NA | NA | NA | 13.92 | 36.20 | 57.22 | |
| Empirical TNR (%) | NA | NA | NA | 99.75 | 99.69 | 99.62 | |
| Mean fit time (s) | 7.43 | 12.51 | 25.32 | 66.30 | 74.08 | 86.95 | |
| AIPW-based LASSO | Rule quality | 0.61 | 0.70 | 0.81 | 0.45 | 0.60 | 0.78 |
| Empirical FDR (%) | 53.98 | 50.87 | 53.03 | 11.24 | 6.65 | 5.48 | |
| Empirical TPR (%) | 28.78 | 43.62 | 55.22 | 13.74 | 36.54 | 57.20 | |
| Empirical TNR (%) | 95.42 | 94.46 | 92.57 | 99.76 | 99.69 | 99.62 | |
| Mean fit time (s) | 691.70 | 773.56 | 936.19 | 73.93 | 90.07 | 118.82 | |
| AIPW-based Super Learner | Rule quality | 0.61 | 0.69 | 0.80 | 0.43 | 0.60 | 0.78 |
| Empirical FDR (%) | NA | NA | NA | 11.83 | 6.69 | 5.45 | |
| Empirical TPR (%) | NA | NA | NA | 13.68 | 36.64 | 57.24 | |
| Empirical TNR (%) | NA | NA | NA | 99.75 | 99.69 | 99.62 | |
| Mean fit time (s) | 722.40 | 838.81 | 1,164.73 | 80.88 | 101.80 | 143.47 | |
| Causal Random Forests | Rule quality | 0.12 | 0.04 | 0.11 | 0.37 | 0.44 | 0.58 |
| Empirical FDR (%) | NA | NA | NA | 11.75 | 6.62 | 5.36 | |
| Empirical TPR (%) | NA | NA | NA | 13.32 | 36.32 | 57.30 | |
| Empirical TNR (%) | NA | NA | NA | 99.75 | 99.70 | 99.62 | |
| Mean fit time (s) | 13.13 | 31.45 | 71.31 | 69.51 | 88.07 | 123.80 | |
Simulation results: observational study with non-sparse non-linear outcome model and block covariance matrix.
| CATE estimator | Metric | Unfiltered | TEM-VIP-based filtering | ||||
|---|---|---|---|---|---|---|---|
| n = 250 | n = 500 | n = 1,000 | n = 250 | n = 500 | n = 1,000 | ||
| Plug-in LASSO | Rule quality | 0.63 | 0.78 | 0.84 | 0.56 | 0.74 | 0.81 |
| Empirical FDR (%) | 51.46 | 48.81 | 47.81 | 13.67 | 8.29 | 7.00 | |
| Empirical TPR (%) | 30.84 | 44.66 | 58.12 | 18.72 | 39.18 | 58.44 | |
| Empirical TNR (%) | 96.15 | 95.04 | 93.82 | 99.61 | 99.58 | 99.48 | |
| Mean fit time (s) | 0.56 | 0.73 | 1.34 | 1,266.36 | 1,470.17 | 2,634.34 | |
| Plug-in XGBoost | Rule quality | 0.09 | 0.06 | 0.16 | 0.23 | 0.29 | 0.40 |
| Empirical FDR (%) | NA | NA | NA | 14.72 | 8.31 | 6.49 | |
| Empirical TPR (%) | NA | NA | NA | 18.40 | 39.24 | 58.18 | |
| Empirical TNR (%) | NA | NA | NA | 99.59 | 99.58 | 99.52 | |
| Mean fit time (s) | 2.13 | 4.82 | 13.82 | 1,265.64 | 1,470.82 | 2,646.84 | |
| Modified covariates LASSO | Rule quality | 0.08 | 0.08 | 0.06 | 0.24 | 0.32 | 0.33 |
| Empirical FDR (%) | 60.38 | 54.08 | 50.15 | 14.05 | 8.72 | 6.75 | |
| Empirical TPR (%) | 3.18 | 4.68 | 10.54 | 18.60 | 39.40 | 58.56 | |
| Empirical TNR (%) | 98.37 | 98.07 | 97.54 | 99.60 | 99.55 | 99.50 | |
| Mean fit time (s) | 11.82 | 18.33 | 99.27 | 1,271.48 | 1,481.43 | 2,650.73 | |
| Modified covariates XGBoost | Rule quality | 0.08 | 0.09 | 0.05 | 0.16 | 0.21 | 0.19 |
| Empirical FDR (%) | NA | NA | NA | 13.70 | 8.50 | 6.37 | |
| Empirical TPR (%) | NA | NA | NA | 18.66 | 39.68 | 58.04 | |
| Empirical TNR (%) | NA | NA | NA | 99.62 | 99.56 | 99.53 | |
| Mean fit time (s) | 21.97 | 29.19 | 104.87 | 1,278.55 | 1,489.49 | 2,667.57 | |
| Augmented modified covariates LASSO | Rule quality | 0.43 | 0.69 | 0.81 | 0.37 | 0.64 | 0.78 |
| Empirical FDR (%) | 59.66 | 61.26 | 62.93 | 14.35 | 8.68 | 6.75 | |
| Empirical TPR (%) | 19.78 | 39.04 | 54.18 | 18.06 | 39.90 | 58.14 | |
| Empirical TNR (%) | 95.35 | 91.90 | 89.12 | 99.62 | 99.55 | 99.50 | |
| Mean fit time (s) | 12.23 | 17.80 | 92.71 | 1,268.55 | 1,481.57 | 2,658.96 | |
| Augmented modified covariates XGBoost | Rule quality | 0.32 | 0.54 | 0.64 | 0.28 | 0.51 | 0.66 |
| Empirical FDR (%) | NA | NA | NA | 14.47 | 7.97 | 6.77 | |
| Empirical TPR (%) | NA | NA | NA | 18.64 | 39.42 | 58.32 | |
| Empirical TNR (%) | NA | NA | NA | 99.59 | 99.59 | 99.50 | |
| Mean fit time (s) | 30.63 | 49.91 | 149.00 | 1,276.58 | 1,498.14 | 2,680.37 | |
| AIPW-based LASSO | Rule quality | 0.60 | 0.74 | 0.82 | 0.39 | 0.65 | 0.78 |
| Empirical FDR (%) | 60.04 | 55.65 | 53.91 | 13.37 | 8.29 | 6.59 | |
| Empirical TPR (%) | 32.82 | 45.30 | 56.80 | 18.72 | 39.82 | 58.24 | |
| Empirical TNR (%) | 94.02 | 93.23 | 92.27 | 99.62 | 99.57 | 99.51 | |
| Mean fit time (s) | 731.78 | 843.97 | 1,211.56 | 1,276.14 | 1,502.32 | 2,674.74 | |
| AIPW-based Super Learner | Rule quality | 0.59 | 0.74 | 0.82 | 0.38 | 0.66 | 0.78 |
| Empirical FDR (%) | NA | NA | NA | 14.32 | 8.37 | 6.56 | |
| Empirical TPR (%) | NA | NA | NA | 18.92 | 39.50 | 58.26 | |
| Empirical TNR (%) | NA | NA | NA | 99.60 | 99.57 | 99.52 | |
| Mean fit time (s) | 759.28 | 901.83 | 1,430.13 | 1,285.08 | 1,514.52 | 2,663.28 | |
| Causal Random Forests | Rule quality | 0.05 | 0.05 | −0.02 | 0.22 | 0.36 | 0.40 |
| Empirical FDR (%) | NA | NA | NA | 13.37 | 8.62 | 6.74 | |
| Empirical TPR (%) | NA | NA | NA | 18.24 | 39.76 | 58.58 | |
| Empirical TNR (%) | NA | NA | NA | 99.61 | 99.56 | 99.50 | |
| Mean fit time (s) | 15.22 | 34.23 | 84.13 | 1,268.99 | 1,494.08 | 2,682.33 | |
References
1. Robins, JM. Optimal structural nested models for optimal sequential decisions. New York, New York, NY: Springer; 2004:189–326 pp.10.1007/978-1-4419-9076-1_11Suche in Google Scholar
2. Qian, M, Murphy, SA. Performance guarantees for individualized treatment rules. Ann Stat 2011;39:1180–210. https://doi.org/10.1214/10-AOS864.Suche in Google Scholar PubMed PubMed Central
3. Zhang, B, Tsiatis, AA, Davidian, M, Zhang, M, Laber, E. Estimating optimal treatment regimes from a classification perspective. Stat 2012;1:103–14. https://doi.org/10.1002/sta.411.Suche in Google Scholar PubMed PubMed Central
4. Zhang, B, Tsiatis, AA, Laber, EB, Davidian, M. A robust method for estimating optimal treatment regimes. Biometrics 2012;68:1010–18. https://doi.org/10.1111/j.1541-0420.2012.01763.x.Suche in Google Scholar PubMed PubMed Central
5. Tian, L, Alizadeh, AA, Gentles, AJ, Tibshirani, R. A simple method for estimating interactions between a treatment and a large number of covariates. J Am Stat Assoc 2014;109:1517–32. https://doi.org/10.1080/01621459.2014.951443.Suche in Google Scholar PubMed PubMed Central
6. Luedtke, AR, van der Laan, MJ. Super-learning of an optimal dynamic treatment rule. Int J Biostat 2016;12:305–32. https://doi.org/10.1515/ijb-2015-0052.Suche in Google Scholar PubMed PubMed Central
7. Künzel, SR, Sekhon, JS, Bickel, PJ, Yu, B. Metalearners for estimating heterogeneous treatment effects using machine learning. Proc Natl Acad Sci 2019;116:4156–65. https://doi.org/10.1073/pnas.1804597116.Suche in Google Scholar PubMed PubMed Central
8. Murdoch, WJ, Singh, C, Kumbier, K, Abbasi-Asl, R, Yu, B. Definitions, methods, and applications in interpretable machine learning. Proc Natl Acad Sci 2019;116:22071–80. https://doi.org/10.1073/pnas.1900654116.Suche in Google Scholar PubMed PubMed Central
9. Chen, S, Tian, L, Cai, T, Yu, M. A general statistical framework for subgroup identification and comparative treatment scoring. Biometrics 2017;73:1199–209. https://doi.org/10.1111/biom.12676.Suche in Google Scholar PubMed PubMed Central
10. Zhao, Q, Small, DS, Ertefaie, A. Selective inference for effect modification via the lasso. J R Stat Soc Ser B Stat Method 2022;84:382–413. https://arxiv.org/abs/1705.08020.10.1111/rssb.12483Suche in Google Scholar PubMed PubMed Central
11. Bahamyirou, A, Schnitzer, ME, Kennedy, EH, Blais, L, Yang, Y. Doubly robust adaptive lasso for effect modifier discovery. Int J Biostat 2022;18:307–27. https://doi.org/10.1515/ijb-2020-0073.Suche in Google Scholar PubMed
12. Boileau, P, Qi, NT, van der Laan, MJ, Dudoit, S, Leng, N. A flexible approach for predictive biomarker discovery. Biostatistics 2023;24:1085–105. https://doi.org/10.1093/biostatistics/kxac029.Suche in Google Scholar PubMed
13. Boileau, P, Leng, N, Hejazi, NS, van der Laan, M, Dudoit, S. A nonparametric framework for treatment effect modifier discovery in high dimensions. J Roy Stat Soc B Stat Methodol 2024:qkae084. https://doi.org/10.1093/jrsssb/qkae084.Suche in Google Scholar
14. Rubin, D. Estimating causal effects of treatments in randomized and nonrandomized studies. J Educ Psychol 1974;66:688–701. https://doi.org/10.1037/h0037350.Suche in Google Scholar
15. Tibshirani, R. Regression shrinkage and selection via the lasso. J Roy Stat Soc B 1996;58:267–88. https://doi.org/10.1111/j.2517-6161.1996.tb02080.x.Suche in Google Scholar
16. Zou, H, Hastie, T. Regularization and variable selection via the elastic net. J Roy Stat Soc B 2005;67:301–20. https://doi.org/10.1111/j.1467-9868.2005.00503.x.Suche in Google Scholar
17. R Core Team. R: a language and environment for statistical computing. Vienna, Austria: R Foundation for Statistical Computing; 2021. Available from: https://www.R-project.org/.Suche in Google Scholar
18. Zhao, P, Yu, B. On model selection consistency of lasso. J Mach Learn Res 2006;7:2541–63.Suche in Google Scholar
19. Breiman, L. Random forests. Mach Learn 2001;45:5–32. https://doi.org/10.1023/a:1010933404324.10.1023/A:1010933404324Suche in Google Scholar
20. Chen, T, Guestrin, C. XGBoost: a scalable tree boosting system. In: Proceedings of the 22nd ACM SIGKDD international conference on knowledge discovery and data mining, KDD ‘16. New York, NY, USA: ACM; 2016:785–94 pp.10.1145/2939672.2939785Suche in Google Scholar
21. Huling, JD, Yu, M. Subgroup identification using the personalized package. J Stat Software 2021;98:1–60. https://doi.org/10.18637/jss.v098.i05.Suche in Google Scholar
22. Robins, J, Orellana, L, Rotnitzky, A. Estimation and extrapolation of optimal treatment and testing strategies. Stat Med 2008;27:4678–721. https://doi.org/10.1002/sim.3301.Suche in Google Scholar PubMed
23. van der Laan, MJ, Luedtke, AR. Targeted learning of the mean outcome under an optimal dynamic treatment rule. J Causal Inference 2015;3:61–95. https://doi.org/10.1515/jci-2013-0022.Suche in Google Scholar PubMed PubMed Central
24. Kennedy, EH. Towards optimal doubly robust estimation of heterogeneous causal effects. Electron J Statist 2023;17:3008–49.10.1214/23-EJS2157Suche in Google Scholar
25. van der Laan, MJ, Polley, EC, Hubbard, AE. Super learner. Stat Appl Genet Mol Biol 2007;6. https://doi.org/10.2202/1544-6115.1309.Suche in Google Scholar PubMed
26. Dudoit, S, van der Laan, MJ. Asymptotics of cross-validated risk estimation in estimator selection and performance assessment. Working Paper 126. Berkeley: University of California, Berkeley; 2003. Available from: https://biostats.bepress.com/ucbbiostat/paper126.Suche in Google Scholar
27. van der Laan, MJ, Dudoit, S. Unified cross-validation methodology for selection among estimators and a general cross-validated adaptive epsilon-net estimator: finite sample oracle inequalities and examples. Working Paper 130. Berkeley: University of California, Berkeley; 2003. Available from: https://biostats.bepress.com/ucbbiostat/paper130/.Suche in Google Scholar
28. Dudoit, S, van der Laan, MJ. Asymptotics of cross-validated risk estimation in estimator selection and performance assessment. Stat Methodol 2005;2:131–54. https://doi.org/10.1016/j.stamet.2005.02.003.Suche in Google Scholar
29. van der Vaart, AW, Dudoit, S, van der Laan, MJ. Oracle inequalities for multi-fold cross validation. Stat Decis 2006;24:351–71. https://doi.org/10.1524/stnd.2006.24.3.351.Suche in Google Scholar
30. Coyle, JR, Hejazi, NS, Malenica, I, Phillips, RV, Sofrygin, O. sl3: modern pipelines for machine learning and super learning; 2021. R package version 1.4.2.Suche in Google Scholar
31. Wager, S, Athey, S. Estimation and inference of heterogeneous treatment effects using random forests. J Am Stat Assoc 2018;113:1228–42. https://doi.org/10.1080/01621459.2017.1319839.Suche in Google Scholar
32. Athey, S, Tibshirani, J, Wager, S. Generalized random forests. Ann Stat 2019;47:1148–78. https://doi.org/10.1214/18-aos1709.Suche in Google Scholar
33. Robinson, PM. Root-n-consistent semiparametric regression. Econometrica 1988;56:931–54. https://doi.org/10.2307/1912705.Suche in Google Scholar
34. Tibshirani, J, Athey, S, Sverdrup, E, Wager, S. grf: generalized random forests; 2022. Available from: https://CRAN.R-project.org/package=grf. R package version 2.2.1.Suche in Google Scholar
35. Benjamini, Y, Hochberg, Y. Controlling the false discovery rate: a practical and powerful approach to multiple testing. J Roy Stat Soc B 1995;57:289–300. https://doi.org/10.1111/j.2517-6161.1995.tb02031.x.Suche in Google Scholar
36. Duncan, J, Tang, T, Elliott, CF, Boileau, P, simchef, BY. High-quality data science simulations in R. J Open Source Softw 2024;9:6156. https://doi.org/10.21105/joss.06156.Suche in Google Scholar
© 2025 Walter de Gruyter GmbH, Berlin/Boston
Artikel in diesem Heft
- Frontmatter
- Research Articles
- Prognostic adjustment with efficient estimators to unbiasedly leverage historical data in randomized trials
- Homogeneity test and sample size of response rates for AC 1 in a stratified evaluation design
- A review of survival stacking: a method to cast survival regression analysis as a classification problem
- DsubCox: a fast subsampling algorithm for Cox model with distributed and massive survival data
- A hybrid hazard-based model using two-piece distributions
- Regression analysis of clustered current status data with informative cluster size under a transformed survival model
- Bayesian covariance regression in functional data analysis with applications to functional brain imaging
- Risk estimation and boundary detection in Bayesian disease mapping
- An improved estimator of the logarithmic odds ratio for small sample sizes using a Bayesian approach
- Short Communication
- A multivariate Bayesian learning approach for improved detection of doping in athletes using urinary steroid profiles
- Research Articles
- Guidance on individualized treatment rule estimation in high dimensions
- Weighted Euclidean balancing for a matrix exposure in estimating causal effect
- Penalized regression splines in Mixture Density Networks