Solubility of Nitrogen Gas into Molten Copper at Temperature Range of 1,993 K to 2,443 K
-
Abdul Muizz Mohd Noor
 ,
Nik Hisyamudin Muhd Nor
,
Nik Hisyamudin Muhd Nor

Abstract
Solubility of nitrogen gas into pure copper at temperature range of 1,993–2,443 K was studied with using a levitation melting apparatus. The solubility which was dissolved content of nitrogen equilibrated with nitrogen gas with a pressure of 101.3 kPa increased with the temperature of molten copper. However, the solubility was approximately 1.5 mass ppm even at 2,443 K. Absorption of nitrogen gas into pure copper obeyed the Sieverts’ law and was expressed as:
Here, the underlined element was expressed as the element dissolved into a molten copper. The relation between this reaction Gibbs energy,
Introduction
The various reactions with a molten metal around smelting temperatures have been studied until now to understand and improve smelting processes. A high temperature process such as a thermal spraying comes to be used recently [1]. Thermodynamic data above a smelting temperature have been needed so as to understand phenomena in a higher temperature process. It is reported that nitrogen gas is insoluble in solid and liquid copper at the temperature of up to 1,673 K. In addition, no reaction between metallic copper and nitrogen gas occurs [2, 3]. Accordingly, nitrogen gas has been considered to be an inert gas like argon for example. However, copper nitride is synthesized by the reaction between copper and ammonia and with a RF magnetron sputtering on copper in the gas mixture of argon and nitrogen gas [4, 5, 6].
In our previous work, solubility of carbon (graphite) into molten copper was measured to prepare a graphite dispersed copper composite with casting [7]. It was found that the solubility of carbon steeply increased with the temperature, when the temperature exceeded approximately 2,100 K. There is a possibility that nitrogen gas dissolve in molten copper at a higher temperature. Then, as a fundamental study, the solubility of nitrogen gas into liquid copper was measured in this study.
Experimental
Figure 1 showed the schematic of the experimental apparatus. The levitation melting apparatus was used in this study for melting copper. Because this apparatus could melt a copper without a crucible, a copper could be melted without contamination from a crucible. The copper sample used in this study was cut from a copper rod with purity of 99.994 mass% to be 2.20 ± 0.05×10⁻³ kg in weight. The copper sample was levitation-melted in the induction furnace (130 kHz, 60 kW) in the gas mixture of nitrogen and argon gas flow with the flow rate of 8.33×10⁻⁵ m3∙s–1 (293 K, 101.3 kPa (NTP)). Composition of nitrogen gas in the gas mixture was 25 vol%, 50 vol% and 100 vol%. The gas flow rate of the mixed gas was controlled with a mass flow controller. Purities of the nitrogen gas and argon gas were 99.9995 vol%. Temperature of the molten copper was measured with a two color thermometer, and was controlled manually within the range of 10 K. Temperature outputted from the thermometer was lower than that given from the thermocouple due to the emissivity of copper. The temperature was calibrated by measuring the temperature of a molten copper in MgO crucible in a high frequency induction furnace up to approximately 2,120 K with the two color thermometer and thermocouple (Pt-20 mass% Rh-Pt-40 mass%). In the case that the temperature of a molten copper exceeded approximately 2,120 K, the temperature was corrected by extrapolation of the obtained calibration line.

Schematic of experimental apparatus.
The sample began to melt approximately 60 s later after it was levitated. The levitated liquid copper reached the predetermined temperature approximately 40 s later after the melting. The time when the melt arrived at the predetermined temperature was used for the start time for the experiment. After the copper sample was held for a predetermined time, the water-cooled copper mold shown in Figure 1 was inserted from the bottom end of the quarts reaction tube. Immediately after the mold touched the levitated copper, induction furnace was turned off and the copper sample was cooled rapidly on the mold.
The sample was divided into two parts with a wire cutter and measured both nitrogen and oxygen content in the copper sample with an inert gas fusion method (Horiba EMGA 1300). The principle of detection of nitrogen in this apparatus was the same as that in a gas chromatograph. The calibration line for analysis of oxygen and nitrogen was drawn by using the standard sample for iron. As described later, nitrogen content in the molten copper was very small. The copper sample for analysis was taken to be as large as possible. The lower detection limit of nitrogen content could not be reported simply because the product of the weight of a sample and its nitrogen content determined the limit. However the limit was approximately 0.4 mass ppm. In addition, the scattering of measured value was ± 0.2 mass ppm.
Results and discussion
Change in nitrogen concentration with time
Figure 2 showed the example of the change in nitrogen content in the molten copper with time. The nitrogen contents under nitrogen gas and the mixed gas flows increased with time and were almost constant at the time of 180 s or more. Taking account of the accuracy of analysis, it could be considered that the nitrogen content was equilibrated with the pressure of nitrogen of 101.3 kPa approximately 180 s later.
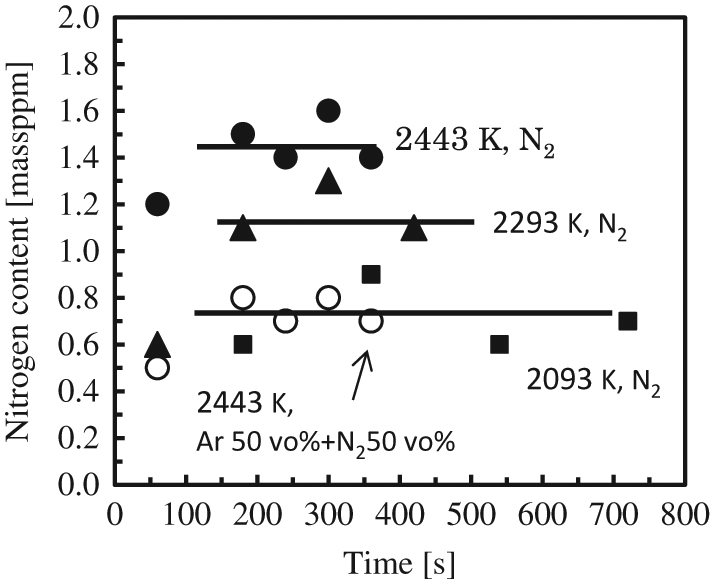
Example of change in nitrogen content with time.
Changes in oxygen content with time were shown in Figure 3. These experimental conditions shown in this figure were the same as those shown in Figure 2. Even after 180 s when nitrogen content became constant, the oxygen content increased with time. This increase in the oxygen content resulted from oxidizing by impurities which nitrogen and argon gasses included. The measured solubility of nitrogen gas was the one for the copper of which oxygen content was 60–120 mass ppm.

Example of change in oxygen content with time.
Figure 4 showed the relation between the solubility of nitrogen and the temperature. The calculated line in this figure was described later. Whereas the solubility of nitrogen increased with the temperature rise, the solubility even at 2,443 K was approximately 1.6 mass ppm and not so large. This solubility was approximately one quarter of that reported previously [8].

Relation between saturated nitrogen content and temperature.
Figure 5 showed the relation between the nitrogen content and square root of the partial pressure of nitrogen in the gas mixture. Here, the pressure was normalized by dividing the pressure expressed in Pa with 100 kPa. Accordingly, the unit of atm could be attached to the value of the normalized pressure. There was a good linear relation between the nitrogen content and square root of the partial pressure of nitrogen. This suggested that the dissolution of nitrogen gas into liquid copper obeyed Sieverts’ law. Namely, the dissolution reaction of nitrogen gas into molten copper could be expressed as:

Relation between nitrogen content in molten copper and square root of partial pressure of nitrogen gas.
Here, the underlined element was expressed the element dissolved into a molten copper. The equilibrium constant, K, was given as
Here, aN was the activity of nitrogen which was based on the reference state of the infinitely dilute solution of nitrogen in pure molten copper. The
The activity coefficient of nitrogen,
where
Accordingly, the equilibrium constant was expressed as:
The standard reaction Gibbs energy,
where R was the gas constant [J/(K∙mol)], T was the thermodynamic temperature [K]. This Gibbs energy could also be expressed as:
where
[J/mol] and
![Figure 6: Relation between natural logarithm of [mass%N] and reciprocal of temperature.](/document/doi/10.1515/htmp-2016-0174/asset/graphic/htmp-2016-0174_figure6.jpg)
Relation between natural logarithm of [mass%N] and reciprocal of temperature.
These equations were used for a molten copper of which oxygen content was 60–120 mass ppm. The solubility of nitrogen calculated from eq. (12) was shown in Figure 4. The line calculated from the eq. (12) fitted the experimental data well.
Because the value of the standard reaction enthalpy was positive, the nitrogen absorption reaction given by eq. (1) was an endothermic reaction. Analysis of the data given by Yatash et al. gave
Conclusion
Solubility of nitrogen gas into a molten copper was measured at the temperature range of 1,993–2,443 K using a levitation-melt apparatus. The dissolution of nitrogen gas into molten copper obeyed the Sieverts’ law, which meant that absorption of nitrogen gas into molten copper was expressed as:
Solubility of nitrogen gas into a molten copper of which oxygen content was 60–120 mass ppm was expressed as:
The standard reaction Gibbs energy was expressed as:
References
[1] R. Kromer, S. Costil, J. Cormier, L. Berthe, P. Peyre and D. Courapied, J. Thermal Spray Tech., 25 (2016) 401–410.10.1007/s11666-015-0352-xSearch in Google Scholar
[2] M. Hansen, Constitution of Binary Alloys, McGraw Hill, New York (1958), 600.10.1149/1.2428700Search in Google Scholar
[3] J.R. Davis, Copper and Copper Alloys, ASM International, Ohia (2001), 177.Search in Google Scholar
[4] T. Nakamura, H. Hayashi, T. Hanaoka and T. Ebina, Inorg. Chem., 53 (2014) 710–715.10.1021/ic4011604Search in Google Scholar
[5] J.F. Pierson, Vacuum, 66 (2002) 59–64.10.1016/S0042-207X(01)00425-0Search in Google Scholar
[6] C.M. Caskey, R.M. Richards, D.S. Ginleya and A. Zakutayeva, Mater. Horiz. 1 (2014) 424–430.10.1039/C4MH00049HSearch in Google Scholar
[7] S. Yokoyama, Y. Takashima, M. Nor, Y. Murata, H. Kanematsu, J. Sasano and M. Izaki, AMPT, Sept (2012) 1–8.Search in Google Scholar
[8] Y.V. Latash, G.F. Torkhov and Y.I. Kostenko, Izv. Akad. Nauk SSSR, Metally 1 (1986) 45–49.Search in Google Scholar
[9] E.T. Turkdogan, Physical Chemistry of High Temperature Technology, Academic Press, New York (1980), 76.Search in Google Scholar
© 2017 Walter de Gruyter GmbH, Berlin/Boston
This article is distributed under the terms of the Creative Commons Attribution Non-Commercial License, which permits unrestricted non-commercial use, distribution, and reproduction in any medium, provided the original work is properly cited.
Articles in the same Issue
- Frontmatter
- Research Articles
- Effects of Rolling and Cooling Conditions on Microstructure of Umbrella-Bone Steel
- Synthesis and Characterization of Poly (styrene-co-butyl acrylate)/Silica Aerogel Nanocomposites by in situ AGET ATRP: Investigating Thermal Properties
- Processing and Properties of Fire Resistant EPDM Rubber-Based Ceramifiable Composites
- Preparation of Direct Reduction Sponge Iron (DRI) Using Pyrite Cinder Containing Nonferrous Metals
- Self-healing and Oxidation Resistance of B-Si Doped Carbon Materials Derived from Modification Coal Tar Pitch
- Evolution of Voids in Mg/Al Diffusion Bonding Process
- Energy Dissipation Rate in an Agitated Crucible Containing Molten Metal
- Dynamic Recrystallization Behavior of Vanadium Microalloyed Cryogenic Fine Grain Structural Steel Pipe at High Strain Rate
- Effect of High Temperature Hot Corrosion on the Compression Creep Behavior of 12Cr1MoV Alloys
- Phenomenological Models to Predict the Flow Stress up to the Peak of as-Extruded 7050 Aluminum Alloy
- Solubility of Nitrogen Gas into Molten Copper at Temperature Range of 1,993 K to 2,443 K