The microtubule skeleton and the evolution of neuronal complexity in vertebrates
-
Nataliya I. Trushina


Abstract
The evolution of a highly developed nervous system is mirrored by the ability of individual neurons to develop increased morphological complexity. As microtubules (MTs) are crucially involved in neuronal development, we tested the hypothesis that the evolution of complexity is driven by an increasing capacity of the MT system for regulated molecular interactions as it may be implemented by a higher number of molecular players and a greater ability of the individual molecules to interact. We performed bioinformatics analysis on different classes of components of the vertebrate neuronal MT cytoskeleton. We show that the number of orthologs of tubulin structure proteins, MT-binding proteins and tubulin-sequestering proteins expanded during vertebrate evolution. We observed that protein diversity of MT-binding and tubulin-sequestering proteins increased by alternative splicing. In addition, we found that regions of the MT-binding protein tau and MAP6 displayed a clear increase in disorder extent during evolution. The data provide evidence that vertebrate evolution is paralleled by gene expansions, changes in alternative splicing and evolution of coding sequences of components of the MT system. The results suggest that in particular evolutionary changes in tubulin-structure proteins, MT-binding proteins and tubulin-sequestering proteins were prominent drivers for the development of increased neuronal complexity.
Introduction
The complexity of the nervous system permits the development of sophisticated behavioral repertoires, such as language, tool use, self-awareness, symbolic thought, cultural learning and consciousness. The basis for the development of such a complexity is a high neuronal heterogeneity caused by neuronal diversification on the one hand and a large interconnectivity between the individual neurons on the other hand (Muotri and Gage, 2006). In addition, the brain constantly needs to adapt to functional challenges of various kinds during development and adulthood by a process called neural plasticity (Zilles, 1992). At a single cell level, neural plasticity involves changes in the number or the strength of synaptic contacts between individual neurons thereby changing the extent of their interconnectivity.
Thus, it is conceivable that the evolution of a complex and adaptable nervous system is mirrored by the ability of individual neurons to develop high and variable morphological complexity, e.g. with respect to the extent of their axonal and dendritic arborization as a prerequisite to establish and modulate a large number of synaptic contacts. Differences in the total dendritic length and the number of branches – together with the diameter of the dendrites – also affect the electrical, biochemical and biophysical properties of the synaptic inputs of neurons (reviewed in Spruston, 2008). Therefore, variations in these parameters reflect differences in the complexity and information processing of neuronal circuits between species, which probably have important implications for cognitive functions. Indeed, a recent study showed correlation between single-cell phenotype and cognitive functioning in humans (Goriounova et al., 2018).
Purkinje cells of the cerebellar cortex are an informative example of neurons with a high interconnectivity. They belong to the largest neurons in the human brain and establish the most extensive dendritic arborization in the central nervous system (CNS), which allows for the formation of up to 200 000 synaptic inputs per neuron (Tyrrell and Willshaw, 1992). The cerebellum is a major part of the hindbrain, which represents an evolutionary old part of the brain and may have first evolved in the last common ancestor of chordates and arthropods between 570 and 555 million years ago (Ghysen, 2003). Thus, the morphological complexity of the dendritic arbor of Purkinje cells can be compared from the brain of simple vertebrates such as lamprey to primates including humans. Determination of the fractal dimensions of Purkinje cells as a measure for dendritic arborization has been performed for some representative species and revealed an increase over evolutionary time (Figure 1A) consistent with an increase of morphological complexity of neurons during evolution; it should however be noted that a regression analysis with a higher number of species did not reveal a significant increase of the fractal dimensions of Purkinje cells for different water creatures, suggesting that also other variables besides evolutionary time need to be taken into account, at least with respect to the development of the cerebellum (Krauss et al., 1994).

The morphological complexity of neurons increases over evolutionary time.
(A) Fractal dimension of Purkinje cells as a measure for the extent of dendritic arborization are plotted from selected species. The plot is based on data obtained by (Krauss et al., 1994), which include a re-examination of data by (Takeda et al., 1992); both data sets are shown in the graph and indicate an increased fractal dimension over evolutionary time. (B) Morphological parameters of CA1 pyramidal neurons of the hippocampus. A typical reconstruction of the morphology of a CA1 neuron from the mouse hippocampus is shown on top. The selected neuron is indicated by a yellow arrow in the stitched image (top left). Apical dendrites of the reconstructed neuron are shown in red, basal dendrites in blue (top right). The length of the dendrites and the number of branching points from three different species are shown in the table below. The numbers are based on data from the evaluation of eight fluorescent neurons from the hippocampus of a GFP-expressing mouse line (14–20 weeks old male mice; Schob et al., 2019), 20 horseradish peroxidase injected CA1 neurons from the rat hippocampus (33–57 days old female rats; Ishizuka et al., 1995), and 30 biocytin-labeled CA1 neurons from 11 months to 24-year-old Macaca mulatta and M. fascicularis (Altemus et al., 2005). Mean±SEM are shown.
Pyramidal neurons of the cerebral cortex may be another informative example for changes in morphological complexity during evolution. In contrast to the cerebellum, the cerebral cortex has evolved most recently and shows the biggest evolutionary variation (Rakic, 2009). It is the largest site of neuronal integration in the brain and plays a key role in higher cognitive functions such as memory and attention. During mammalian evolution, the cerebral cortex has established a large relative expansion with an allocation of approximately eight neurons in the cerebral cortex for every neuron allocated to the rest of the brain (Herculano-Houzel et al., 2014). The most abundant cortical neurons (estimated as 70–80% of the total neural population) represent the pyramidal cells (Defelipe, 2011). A cortical brain region with a well-defined cytoarchitecture and connectivity is the hippocampus, which is involved in the consolidation of information from short-term to long-term memory. Pyramidal neurons in the hippocampal subfield CA1 tend to be the most homogeneous population in the hippocampus with respect to their morphological variation within a species (Ishizuka et al., 1995). In humans, CA1 pyramidal neurons are considered to have a critical role in autobiographical memory retrieval and for re-experiencing detailed episodic memories (Bartsch et al., 2011). Also, these neurons show an increase in dendritic length and arborization from mouse to rats to monkeys, with a more than 3-fold increase in total dendritic length and an almost doubling in branching points (Figure 1B). Thus, these numbers are also in agreement with the view that the evolution of higher cognitive functions is paralleled by an increased morphological complexity on the level of individual neurons and support the view that human neurons are not just ‘scaled-up’ versions of rodent or macaque neurons, but have unique structural and functional properties (Mohan et al., 2015).
Most excitatory synapses in the cerebellar and cerebral cortex end at small dendritic protrusions, called dendritic spines (Yuste, 2010). Dendritic spines can be considered as neuronal microcompartments since they function as local units for the segregation of responses, serve as organizing platforms in a temporally and spatially highly restricted manner, and are regulated in a locally restricted and autonomous way (Brandt and Paululat, 2013). Thus, differences in the number of spines indicate differences in the number of excitatory inputs and can be considered as an additional measure for neuronal complexity. Indeed, neurons in the human prefrontal cortex have 72% more dendritic spines than those in the respective region of the macaque, and harbor approximately 4 times more dendritic spines than those in the prefrontal cortex of the squirrel monkey (Defelipe, 2011). Dendritic spines show also variation in their morphology reflecting functional differences [for a review see (Tackenberg et al., 2009)]. Potentially important structural spine parameters include the spine volume and the length of the spine neck, which is proportional to the extent of biochemical and electrical isolation of the spine from its parent dendrite. Dendritic spines in humans have 100% more volume than those in the somatosensory cortex of mice and also the length of the spine neck is significantly longer (about 30%) in humans than in mice (Defelipe, 2011).
The cytoskeleton is the major intracellular structure that determines the morphology of a neuron and microtubules (MTs) in particular are critical for the development and stabilization of axonal and dendritic processes [for a review see (Penazzi et al., 2016)]. The MT system is crucially involved in all aspects of the development of morphological complexity of neurons such as neuritogenesis, axogenesis and axon specification, axonal branch formation, dendritogenesis, arborization in dendrites, and the formation and morphing of dendritic spines (Table 1). MTs are also highly dynamic, which enables them to translate changes in neuronal activity into morphological changes of axons, dendrites and spines in an adjustable manner. The structure and dynamics of the MT system is regulated by different classes of proteins; with respect to aspects of neuronal morphogenesis, these include MT-binding proteins (MT-associated proteins, MAPs), which bind to the polymers, tubulin-sequestering proteins that predominantly interact with tubulin dimers, MT end-binding proteins with a preference for MT ends, and MT-severing proteins (Table 1). Further complexity is added by the presence of several α- and β-tubulin genes, which code for the MT structure proteins, and γ-tubulin and some other factors, which are involved in MT nucleation.
Involvement of the MT system in the development of morphological complexity of neurons.
| Involvement of the MT system | Selected references |
|---|---|
| Neuritogenesis | |
| Induction of MT polymerization by taxol or overexpression of neuronal MT-associated proteins (MAP2c or tau) induce neuritogenesis in cytochalasin-treated cells | (Edson et al., 1993; Leger et al., 1994, 1997) |
| The MT-associated protein MAP2 exhibits a shift in its localization from a microfilament-associated staining pattern to MT binding | (Kwei et al., 1998) |
| Overexpression of the tubulin-sequestering protein stathmin 2 strongly enhances neurite outgrowth | (Grenningloh et al., 2004) |
| Axonogenesis and axon specification | |
| Invasion and elongation of MTs in the axonal compartment is increased during axonogenesis | (Yu and Baas, 1994) |
| The ratio of acetylated to tyrosinated MTs (as a marker of MT stability) in the minor neurite that will become the future axon is significantly increased | (Witte et al., 2008) |
| The first marker for the development of neuronal polarity is the localization of the MT-associated protein tau to the neurite that develops to an axon | (Kempf et al., 1996) |
| Localized regulation of MT dynamics by the mPar3/mPar6 complex specifies the axon | (Shi et al., 2003) |
| Axonal branch formation | |
| Reorientation and reorganization of MTs contribute to branch formation | (Dent et al., 1999; Wang and Brown, 2002) |
| The MT-severing protein spastin concentrates in discrete patches along the axonal length that correspond to branching point sites | (Svenson et al., 2005; Yu et al., 2008) |
| The MT-associated protein tau strongly counteracts the activity of the MT-severing proteins katanin and spastin | (Qiang et al., 2006; Lacroix et al., 2010) |
| Dendritogenesis | |
| Conversion of minor processes into dendrites of cultured hippocampal neurons involves transfer of MT from the cell soma to the position of the dendrites | (Sharp et al., 1995) |
| Dendrite formation is mediated by increased association of the MT-associated protein MAP2 with MTs and enhanced MT stability | (Vaillant et al., 2002) |
| Arborization in dendrites | |
| MTs are initially cold-labile before progressively becoming cold-stable during development of dendritic arborization of cerebellar Purkinje cells | (Faivre et al., 1985) |
| Upregulation of the MT-associated proteins MAP2 and MAP1A stabilizes dendritic branches | (Vaillant et al., 2002; Szebenyi et al., 2005) |
| Deletion of the genes coding for the MT-associated proteins MAP2 and MAP1A disrupts MT spacing and lowers dendritic arbor complexity in mouse brain | (Teng et al., 2001; Harada et al., 2002) |
| Phosphorylation of the MT-associated protein MAP2 increases during neuronal development and correlates with the growth of the dendritic arbor in cultured hippocampal neurons | (Díez-Guerra and Avila, 1993) |
| Depletion of the MT-severing protein spastin causes reduction in the complexity of the apical dendritic arbor and shortening of basal dendrites but does not affect dendrite number and length | (Riano et al., 2009) |
| Drug-induced MT stabilization and a non-phosphorylatable tau isoform induce dendritic simplification in ex vivo cultures of hippocampal neurons | (Golovyashkina et al., 2015) |
| Formation and morphing of dendritic spines | |
| MTs transiently invade in a subset of spines corresponding to ~9% of the protrusions | (Fiala et al., 2003; Gu et al., 2008; Hu et al., 2008) |
| Drug-induced MT destabilization causes spine loss | (Fanara et al., 2010; Penazzi et al., 2016) |
| Drug-induced MT destabilization promotes morphologic changes of mature mushroom-shaped spines into immature filopodia-like spines without changing the total spine number | (Jaworski et al., 2009) |
| Knockdown of the MT end-binding protein EB3 results in reduced spine number without alteration of spine shape | (Gu et al., 2008) |
| Overexpression of the MT end-binding protein EB3 increases the number of mushroom-shaped spines | (Jaworski et al., 2009) |
| Induction of long-term potentiation (LTP) results in an increased number of spines invaded by MTs and increased frequency of MT spine invasions; intraspinal MTs lead to a faster and greater spine enlargement compared to noninvaded spines | (Merriam et al., 2011) |
| Drug-induced MT stabilization decreases spine length and increases the density of mushroom-shaped spines in cortical neurons | (Chuckowree et al., 2018) |
| Expression of a constitutively active tubulin-sequestering protein (Stathmin 4A) reduces spine density in granule neurons of the dentate gyrus | (Martel et al., 2016) |
Thus, it is conceivable that the evolution of neuronal complexity is driven by an increased capacity of the MT system to react to various environmental stimuli. This capacity may then be secured by a higher number of molecular players within the MT system and an increased potency for regulated molecular interactions. In this article, we aim to test this hypothesis by scrutinizing changes in the building blocks of the MT system, i.e. the tubulin isoforms, and the different classes of their regulatory proteins. We restrict our analysis to vertebrates, as they have a similar and easily comparable blueprint of their nervous system. The vertebrates are the only chordate group to exhibit cephalisation, the concentration of brain functions in the head, and they fall into two major clades, the cyclostomes (hagfishes and lampreys) and the gnathostomes (jawed vertebrates).
Results
The MT system is crucially involved in the development of the morphological complexity of neurons and consists of several groups of proteins with specific functions. These include (a) structure proteins such as α- and β-tubulin, (b) MT nucleators including γ-tubulin, (c) MT-binding proteins that bind along the length of MTs, (d) MT end-binding proteins, (e) tubulin-sequestering proteins, and (f) MT-severing proteins, which all contribute to different aspects of neuronal morphogenesis (Table 1). We excluded motor proteins from our analysis as we decided to focus on changes in MT assembly and dynamics; however, we are well aware that some kinesins have been shown to destabilize or depolymerize MTs in non-neuronal cells, which could also be of functional relevance for neurons (Newton et al., 2004; Ems-McClung and Walczak, 2010).
The presence of different functional classes and the variety of factors, which have the potential to regulate the assembly and dynamics of the MT cytoskeleton in neurons, suggests that the increase in morphological complexity of neurons during evolution could be achieved owing to an increase in the number of molecular players (i.e. more genes or more protein-coding splice variants), or the capacity of single molecules to perform more interactions (i.e. more exons or increased extent of protein regions, which mediate molecular interactions).
To test this hypothesis, we performed bioinformatics analysis on selected organisms with available genome annotation from different taxons of vertebrates (jawless fishes, bony fishes, coelacanths, amphibians, reptiles, birds and mammals). We included hagfish (Eptatretus burgeri) from the class Myxini, which together with lamprey (Petromyzon marinus) are considered to be at the origin of all vertebrates forming one superclass, Cyclostomata, and to have diverged shortly after the separation of cyclostomes (Kuraku and Kuratani, 2006). We were searching genes coding for the proteins of the MT system that descended from a common ancestral DNA after a speciation event (i.e. ortholog genes).
Increased numbers of orthologs – MT skeleton components
On the basis of their involvement in regulating MT dynamics during neuronal morphogenesis (see Table 1), we selected for our bioinformatics analysis α- and β-tubulins as MT structure proteins and γ-tubulins and associated proteins as MT nucleators. With respect to MT binding proteins, which interact along the length of MTs thereby affecting their stability, we included MT-associated protein tau (encoded by the MAPT gene) and its closely related family members MAP2 and MAP4, which contain similar MT-binding domains (MTBDs) (Dehmelt and Halpain, 2005) but differ in their N-terminal projection domains, when bound to MTs. We further included the three MAP1 family components, MAP1A, MAP1B and MAP1S, which – in contrast to the compartment-specific localized tau and MAP2 – are present ubiquitously in neurons. MAP6 (or stable-tubule-only-polypeptide, STOP) and MAP7 (enconsin) were also included as further MAPs. MT end-binding proteins are plus-end tracking proteins that bind to the very tip of growing MTs. We included into our analysis EB1, EB2, EB3, CLASP1 and CLASP2 (Gouveia and Akhmanova, 2010). Tubulin-sequestering proteins interact with tubulin dimers and lower the concentration of free tubulin via binding (Belmont and Mitchison, 1996). We included stathmins 1–4, which are encoded by four distinct genes STMN1–4. STMN1 codes for stathmin 1 (or oncoprotein 18), which is abundantly expressed in the developing nervous system (Chneiweiss et al., 1989). SCG10 (Superior cervical ganglion-10 protein), encoded by STMN2, SCLIP (SCG10 like protein), encoded by STMN3, and RB3 (stathmin-like protein B3), encoded by STMN4, are other stathmins expressed mostly in neurons (reviewed in Chauvin and Sobel, 2015). All stathmins possess a C-terminal stathmin-like domain (SLD) that binds tubulins in a phosphorylation-dependent manner. Stathmin 2 through 4 differ from stathmin 1 by N-terminal membrane-targeting regions (Ozon et al., 1997).
MT-severing enzymes cut MTs into short fragments (Sharp and Ross, 2012). Vertebrates have MT-severing protein katanin, as well as spastin and fidgetin, members of closely related enzyme subfamilies, that have been shown to sever MTs (Roll-Mecak and McNally, 2010). All of these proteins are expressed in neurons and were included in our analysis.
To determine the number of orthologs of the respective genes for MT skeleton components, we assessed the numbers of highly similar orthologs of the respective human genes in different species predicted by Ensembl genome browser Release 94 (Zerbino et al., 2018) (Figure 2A). We observed that human MT skeleton components had the lowest numbers of close orthologs in jawless fishes and bony fishes. However, it should be noted that our approach has limitations because sometimes, as was the case with STMN2 and STMN3 in jawless fish, organisms would have closer orthologs because of the high similarity of hits or no orthologs would be found because of high dissimilarity of these genes in different taxons. As an example, MAP6 has one ortholog in Danio rerio (Dacheux et al., 2015) which our approach did not show.
![Figure 2: Numbers of orthologs of selected human MT skeleton components in different species as predicted by the Ensembl genome browser.(A) The numbers of orthologs of selected genes coding for different MT skeleton components from the Ensembl genome browser are shown. The selected organisms are grouped according to higher taxons (Cyclostomata, Actinopterygii, Coelacanthiformes, Amphibia, Sauropsida, Mammalia) and are color coded from yellow (lower vertebrates) to orange (higher vertebrates). The dendrogram was generated by the program phyloT and visualized with Interactive Tree Of Life (ITOL). (B) The mean numbers of orthologs of genes shown in A predicted with high confidence for vertebrate organisms from the Ensembl genome browser are presented. The line at the left represents a linear fit to the data (R2=0.54). Note that the mean number of orthologs increases from lower to higher vertebrates. (C) Linear fit for mean numbers of orthologs for each group of selected human MT skeleton components with divergence times between mammals and other groups of vertebrates [jawless fishes – 615 MYA (million years ago), bony fishes – 435 MYA, coelacanths – 413 MYA, amphibians – 352 MYA, reptiles and birds – 312 MYA]. Note that the mean numbers of orthologs tend to increase from lower to higher vertebrates for tubulin-sequestering proteins, MT-binding proteins and structure proteins.](/document/doi/10.1515/hsz-2019-0149/asset/graphic/j_hsz-2019-0149_fig_002.jpg)
Numbers of orthologs of selected human MT skeleton components in different species as predicted by the Ensembl genome browser.
(A) The numbers of orthologs of selected genes coding for different MT skeleton components from the Ensembl genome browser are shown. The selected organisms are grouped according to higher taxons (Cyclostomata, Actinopterygii, Coelacanthiformes, Amphibia, Sauropsida, Mammalia) and are color coded from yellow (lower vertebrates) to orange (higher vertebrates). The dendrogram was generated by the program phyloT and visualized with Interactive Tree Of Life (ITOL). (B) The mean numbers of orthologs of genes shown in A predicted with high confidence for vertebrate organisms from the Ensembl genome browser are presented. The line at the left represents a linear fit to the data (R2=0.54). Note that the mean number of orthologs increases from lower to higher vertebrates. (C) Linear fit for mean numbers of orthologs for each group of selected human MT skeleton components with divergence times between mammals and other groups of vertebrates [jawless fishes – 615 MYA (million years ago), bony fishes – 435 MYA, coelacanths – 413 MYA, amphibians – 352 MYA, reptiles and birds – 312 MYA]. Note that the mean numbers of orthologs tend to increase from lower to higher vertebrates for tubulin-sequestering proteins, MT-binding proteins and structure proteins.
Next, we analyzed how the overall number of close orthologs for all selected proteins changes throughout evolution (Figure 2B). Some genes encoding MT skeleton components in Cyclostomata and Actinopterygii either appeared later in evolution with the rise of Sarcopterygii or displayed a large change throughout evolution and thus could not be found with a close homology search. We observed a rise for overall numbers of orthologs from lower to higher vertebrates consistent with the view that the number of molecular players of the MT system increases. The representation of the trend is shown besides the dendrogram of all the analyzed organisms in Figure 2B. We also analyzed the changes for each of the functional groups of proteins (Figures 2C, S1). When plotted against the divergence time, we observed an increase in numbers of highly similar orthologs for tubulin-sequestering proteins, MT-binding proteins and – most prominently – for structure proteins. We could not observe a similar trend for MT-severing proteins and end-binding proteins.
The data indicate that tubulin-structure proteins, MT-binding proteins and tubulin-sequestering proteins were either changing to a major extent throughout vertebrate evolution or exhibited a change in their number. This suggests that changes in these three groups of proteins were the most prominent drivers for the development of increased neuronal complexity during evolution of the vertebrates.
Expansion in gene numbers – tubulins and nucleators
MTs are directional polymeric structures formed by protofilaments consisting of α- and β-tubulin heterodimers. MT nucleation is associated with γ-tubulin. Tubulins are the most abundant and highly conserved proteins. α-, β- and γ-tubulin genes have the widest taxonomic representation and are ubiquitous in eukaryotes. As has been shown before, the tubulin gene family has undergone evolutionary expansion (McKean et al., 2001). In vertebrates each of the tubulin genes is located at a different genetic locus and encodes for a protein that is approximately 400 amino acids in length. While tubulins are highly conserved between and within vertebrates, their C-terminal region shows great variation and is a target of post-translational modification, which can have diverse effect on MT functioning (Breuss et al., 2017).
Invertebrate organisms have smaller numbers of α- and β-tubulin genes, for example, yeast contains two α-tubulin and one β-tubulin genes and fruit flies harbor four α-tubulin and four β-tubulin genes. We analyzed the numbers of tubulin genes for selected vertebrates including humans by database search. It is evident that the number of tubulin genes increases with the evolution of vertebrates (Table 2). It should be noted that some authors argue that the human genome may contain even more tubulin genes, i.e. at least 15 α-tubulin and 21 β-tubulin genes (Dutcher, 2003) by inclusion of recent duplicates, pseudogenes and tubulin-like genes. However, when all of these genes from databases for mice, rats and humans were included, the trend of overall expansion became less clear (Table S1).
Tubulin genes of well-annotated organisms.
| Danio rerio | Xenopus tropicalis | Mus musculus | Rattus norvegicus | Homo sapiens |
|---|---|---|---|---|
| α-Tubulins | ||||
| TUBA1A | TUBA1A | TUBA1A | TUBA1A | TUBA1A |
| TUBA1B | TUBA1B | TUBA1B | TUBA1B | TUBA1B |
| TUBA1C | TUBA1C | TUBA1C | TUBA1C | TUBA1C |
| – | TUBA3C | – | – | TUBA3C |
| – | – | TUBA3B | TUBA3B | TUBA3D |
| – | – | TUBA3A | TUBA3A | TUBA3E |
| – | TUBA4A | TUBA4A | TUBA4A | TUBA4A |
| TUBA2 | – | – | – | TUBA4B |
| – | TUBA8 | TUBA8 | TUBA8 | TUBA8 |
| β-Tubulins | ||||
| TUBB1 | – | TUBB1 | TUBB1 | TUBB1 |
| TUBB2A | – | TUBB2A | TUBB2A | TUBB2A |
| TUBB2B | TUBB2B | TUBB2B | TUBB2B | TUBB2B |
| – | TUBB3 | TUBB3 | TUBB3 | TUBB3 |
| – | TUBB4A | TUBB4A | TUBB4A | TUBB4A |
| TUBB4B | TUBB4B | TUBB4B | TUBB4B | TUBB4B |
| TUBB5 | TUBB1/5 | TUBB5 | TUBB5 | TUBB5 |
| TUBB6 | TUBB6 | TUBB6 | TUBB6 | TUBB6 |
| – | – | – | – | TUBB8 |
| γ-Tubulins | ||||
| TUBG1 | TUBG1 | TUBG1 | TUBG1 | TUBG1 |
| – | – | TUBG2 | TUBG2 | TUBG2 |
Tubulin genes that are associated with neuronal diseases in humans (bold) or were shown to be neuronally expressed (gray background) are indicated. Genes are presented in alphabetical order for humans and the closest homologues from other organisms are located in the same row. (a) TUBA1A (Keays et al., 2007), (b) TUBA4A (Smith et al., 2014), (c) TUBB2A (Cushion et al., 2014), (d) TUBB2B (Jaglin et al., 2009), (e) TUBB3 (Tischfield et al., 2010), (f) TUBB5 (Breuss et al., 2012), (g) TUBB4A (Simons et al., 2013), (h) TUBA8 (Abdollahi et al., 2009), and (i) TUBG1 (Poirier et al., 2013).
In contrast, for γ-tubulin, which is involved in the nucleation of MTs, changes were less impressive; humans have two γ-tubulin genes (as well as mice and rats) but frog (Xenopus – African clawed frog) and fish have only one (Table 2). To form a nucleation complex γ-tubulin binds to other proteins, the γ-tubulin complex proteins (GCPs). In selected vertebrates the numbers of these genes did not change, and all contained genes TUBGCP2 through TUBGCP6. In contrast, budding yeast has only two homologs of GCP genes – SPC97/GCP2 and SPC98/GCP3 – and their nucleation complex is much smaller than that of vertebrates (Murphy et al., 1998).
The data indicate that the number of α- and β-tubulin genes shows a trend to increase through vertebrate evolution, while this is not the case for the components, which are involved in MT nucleation. Tubulin genes are very similar, yet even slight modifications may provide the opportunity for a more precise regulation of their stability and interactions, which could be important to organize the increased morphological complexity of neurons during the evolution of vertebrates. The data support the view that – with respect to variants of α- and β-tubulin – evolution has acted to modify an existing molecule to create a number of variants with special purposes (Oakley, 2000), which was less required for nucleation.
Changes in splicing and numbers of exons – stabilizing and destabilizing proteins
Alternative splicing increases protein-coding capability of a single gene and expands proteome diversity, thus being an important cell-functioning regulatory factor (Leipzig et al., 2004). In particular, during brain development, alternative splicing increases the diversification of protein isoforms in specific cell populations and is thought to play an important role in the spatiotemporal control of transcripts (Furlanis and Scheiffele, 2018). Thus, the intron/exon structure of genes may give further information than changes in sequences and help to understand evolutionary relationships of genes from different species. As our data on the number of orthologs of proteins of the MT system indicated that in particular MT-binding proteins and tubulin-sequestering proteins appeared to be the main drivers for the development of increased neuronal complexity, we concentrated our analysis on these two classes of proteins.
To determine changes in alternative splicing during evolution, we assessed the number of protein-coding splice variants for selected MT-binding proteins and tubulin-sequestering proteins (Figure 3A). To exclude potential other variables besides evolutionary time, we restricted our analysis to land vertebrates (Krauss et al., 1994). The number of splice variants tended to increase for all analyzed MT-binding and tubulin-sequestering proteins and was similar for the three proteins of the tau/MAP2/MAP4 family. When grouped by divergence times the trends were also similar to those presented in Figure 3 (not shown). To determine a potential correlation with respect to the complexity of the respective genes, we also assessed the maximal numbers of exons of the respective MT-binding and tubulin-sequestering proteins (Figure 3B). Here, we observed that the trends were different for the two groups; while the genes for the MT-binding proteins (MAPT, MAP2 and MAP4) did not have major changes in the numbers of exons, genes for the tubulin-sequestering proteins (STMN1-4) all showed a slight increase in exon numbers.

The number of predicted protein-coding splice variants and maximal number of exons for selected MT-binding and tubulin-binding proteins in land vertebrates from the Ensembl genome browser.
(A) The number of predicted protein-coding splice variants from genes coding for MAPs (left) and tubulin-sequestering proteins (right) are shown from the Ensembl genome browser. Note that the numbers show a trend to increase from lower to higher land vertebrates. (B) Maximal number of exons for genes coding for MAPs (left) and tubulin-sequestering proteins (right) from the Ensembl genome browser are shown. The data do not reveal a clear trend for the selected components from lower to higher vertebrates. Lines represent a linear fit to the data. The dendrogram was generated by phyloT and visualized with the ITOL. The respective R2 values are shown in the graphs. The species are color coded from yellow to orange as shown in Figure 2.
The data suggest that the protein diversity of MT-binding and tubulin-sequestering proteins increased by alternative splicing during the evolution of land vertebrates, which is in line of a potential role of these proteins as drivers for the development of increased neuronal complexity and plasticity. The results should however be considered with caution, as the difference could – at least partially – also be due to the fact that some organisms, such as mice and humans, are more thoroughly studied than others (which can result in higher splice variants detected).
Intrinsically disordered regions – MT-binding and tubulin-sequestering proteins
Recently, it is becoming increasingly evident that a large number of proteins are either fully disordered (they are called intrinsically disordered proteins – IDPs) or partially disordered (they have intrinsically disordered regions – IDRs, characterized by high structural plasticity) (Uversky et al., 2000; van der Lee et al., 2014). Many IDPs and proteins with a substantial extent of IDRs may have multiple interaction partners, thus forming hubs of cell interactome (Uchida and Shumyatsky, 2015). Thus, an increase in IDRs during evolution may provide a mechanism for increased binding promiscuity and an improved ability to react quickly in response to changes in the environment.
The MT-binding proteins tau, MAP2 and MAP4 contain a similar C-terminal region with multiple highly conserved MTBDs, while the N-terminal region of tau is intrinsically disordered and has been proposed to interact with a high number of proteins (Brandt and Leschik, 2004; Jeganathan et al., 2008; Uversky, 2015). Indeed, we have shown that the N-terminus of tau interacts with components of the plasma membrane including several members of the annexin family (Gauthier-Kemper et al., 2011, 2018). The association of tau with ribonucleoproteins has also been shown (Gunawardana et al., 2015). The projection domain of MAP2 has been proposed to have disordered structure to act as a spacer between the MT skeleton and other cell compartments (Mukhopadhyay and Hoh, 2001; van der Lee et al., 2014). Some tubulin-sequestering proteins belong to the class of IDPs as well. Stathmin 1 is an intrinsically disordered protein with its C-terminus being more disordered than the N-terminal part (Honnappa et al., 2006). Interestingly, other stathmins are not as disordered as stathmin 1 even in the region of the somewhat similar SLDs.
The extent of disorder of soluble proteins with IDRs may be predicted from their sequence properties. For example, the correlation between the hydrophobicity of amino acids making up the protein and its structure were shown to be significant for different hydrophobicity scales (Moelbert et al., 2004). Thus, we analyzed whether different regions of MT-binding and tubulin-sequestering proteins may have different properties including more hydrophobic or hydrophilic amino acids. First, we assessed the properties of tau amino acid sequences based on the longest CNS MAPT isoform coding for tau with 441 amino acids with the IDP-hydropathy scale (Figure 4A). This scale had been developed for improved discrimination between structured proteins and IDPs (Huang et al., 2014). We observed that the MTBDs have a higher IDP-hydropathy score with more hydrophobic amino acids suggesting these regions are more prone to folding. Proline-rich regions were the most hydrophilic regions, and the N-terminal regions also contained some more hydrophilic loci. Then we assessed the structure properties of tau via IUPred2A prediction of IDRs (Meszaros et al., 2018) (Figure 4B). The MTBDs and the C-terminal region have a lower disorder extent than the N-terminal region and the proline-rich region. It is also evident that the disorder extent of the N-terminal region and the proline-rich region increases during evolution (Figure 4B, right). For a more quantitative comparison we determined the extent of predicted disorder for the individual regions (N-terminal region, proline-rich region, MTBDs and C-terminal region) and normalized it to the length of the respective region in every organism, as different exons of tau have been shown to have different length in the various groups of vertebrates (Sundermann et al., 2016; Gauthier-Kemper et al., 2018). We observed that the disorder in the N-terminal region showed a clear increase throughout evolution (Figure 4D, S4A, green line). Other regions did not change to a major extent. We also analyzed changes in disorder extent of MAP6 that possesses disordered regions (Figure 4C). As MAP6 is important for stabilization of axonal MTs we decided to include it into our analysis (Tortosa et al., 2017). In fact, we observed that also the N-terminal region of MAP6 showed a clear increase in disorder throughout evolution (Figures 4E, S4B).
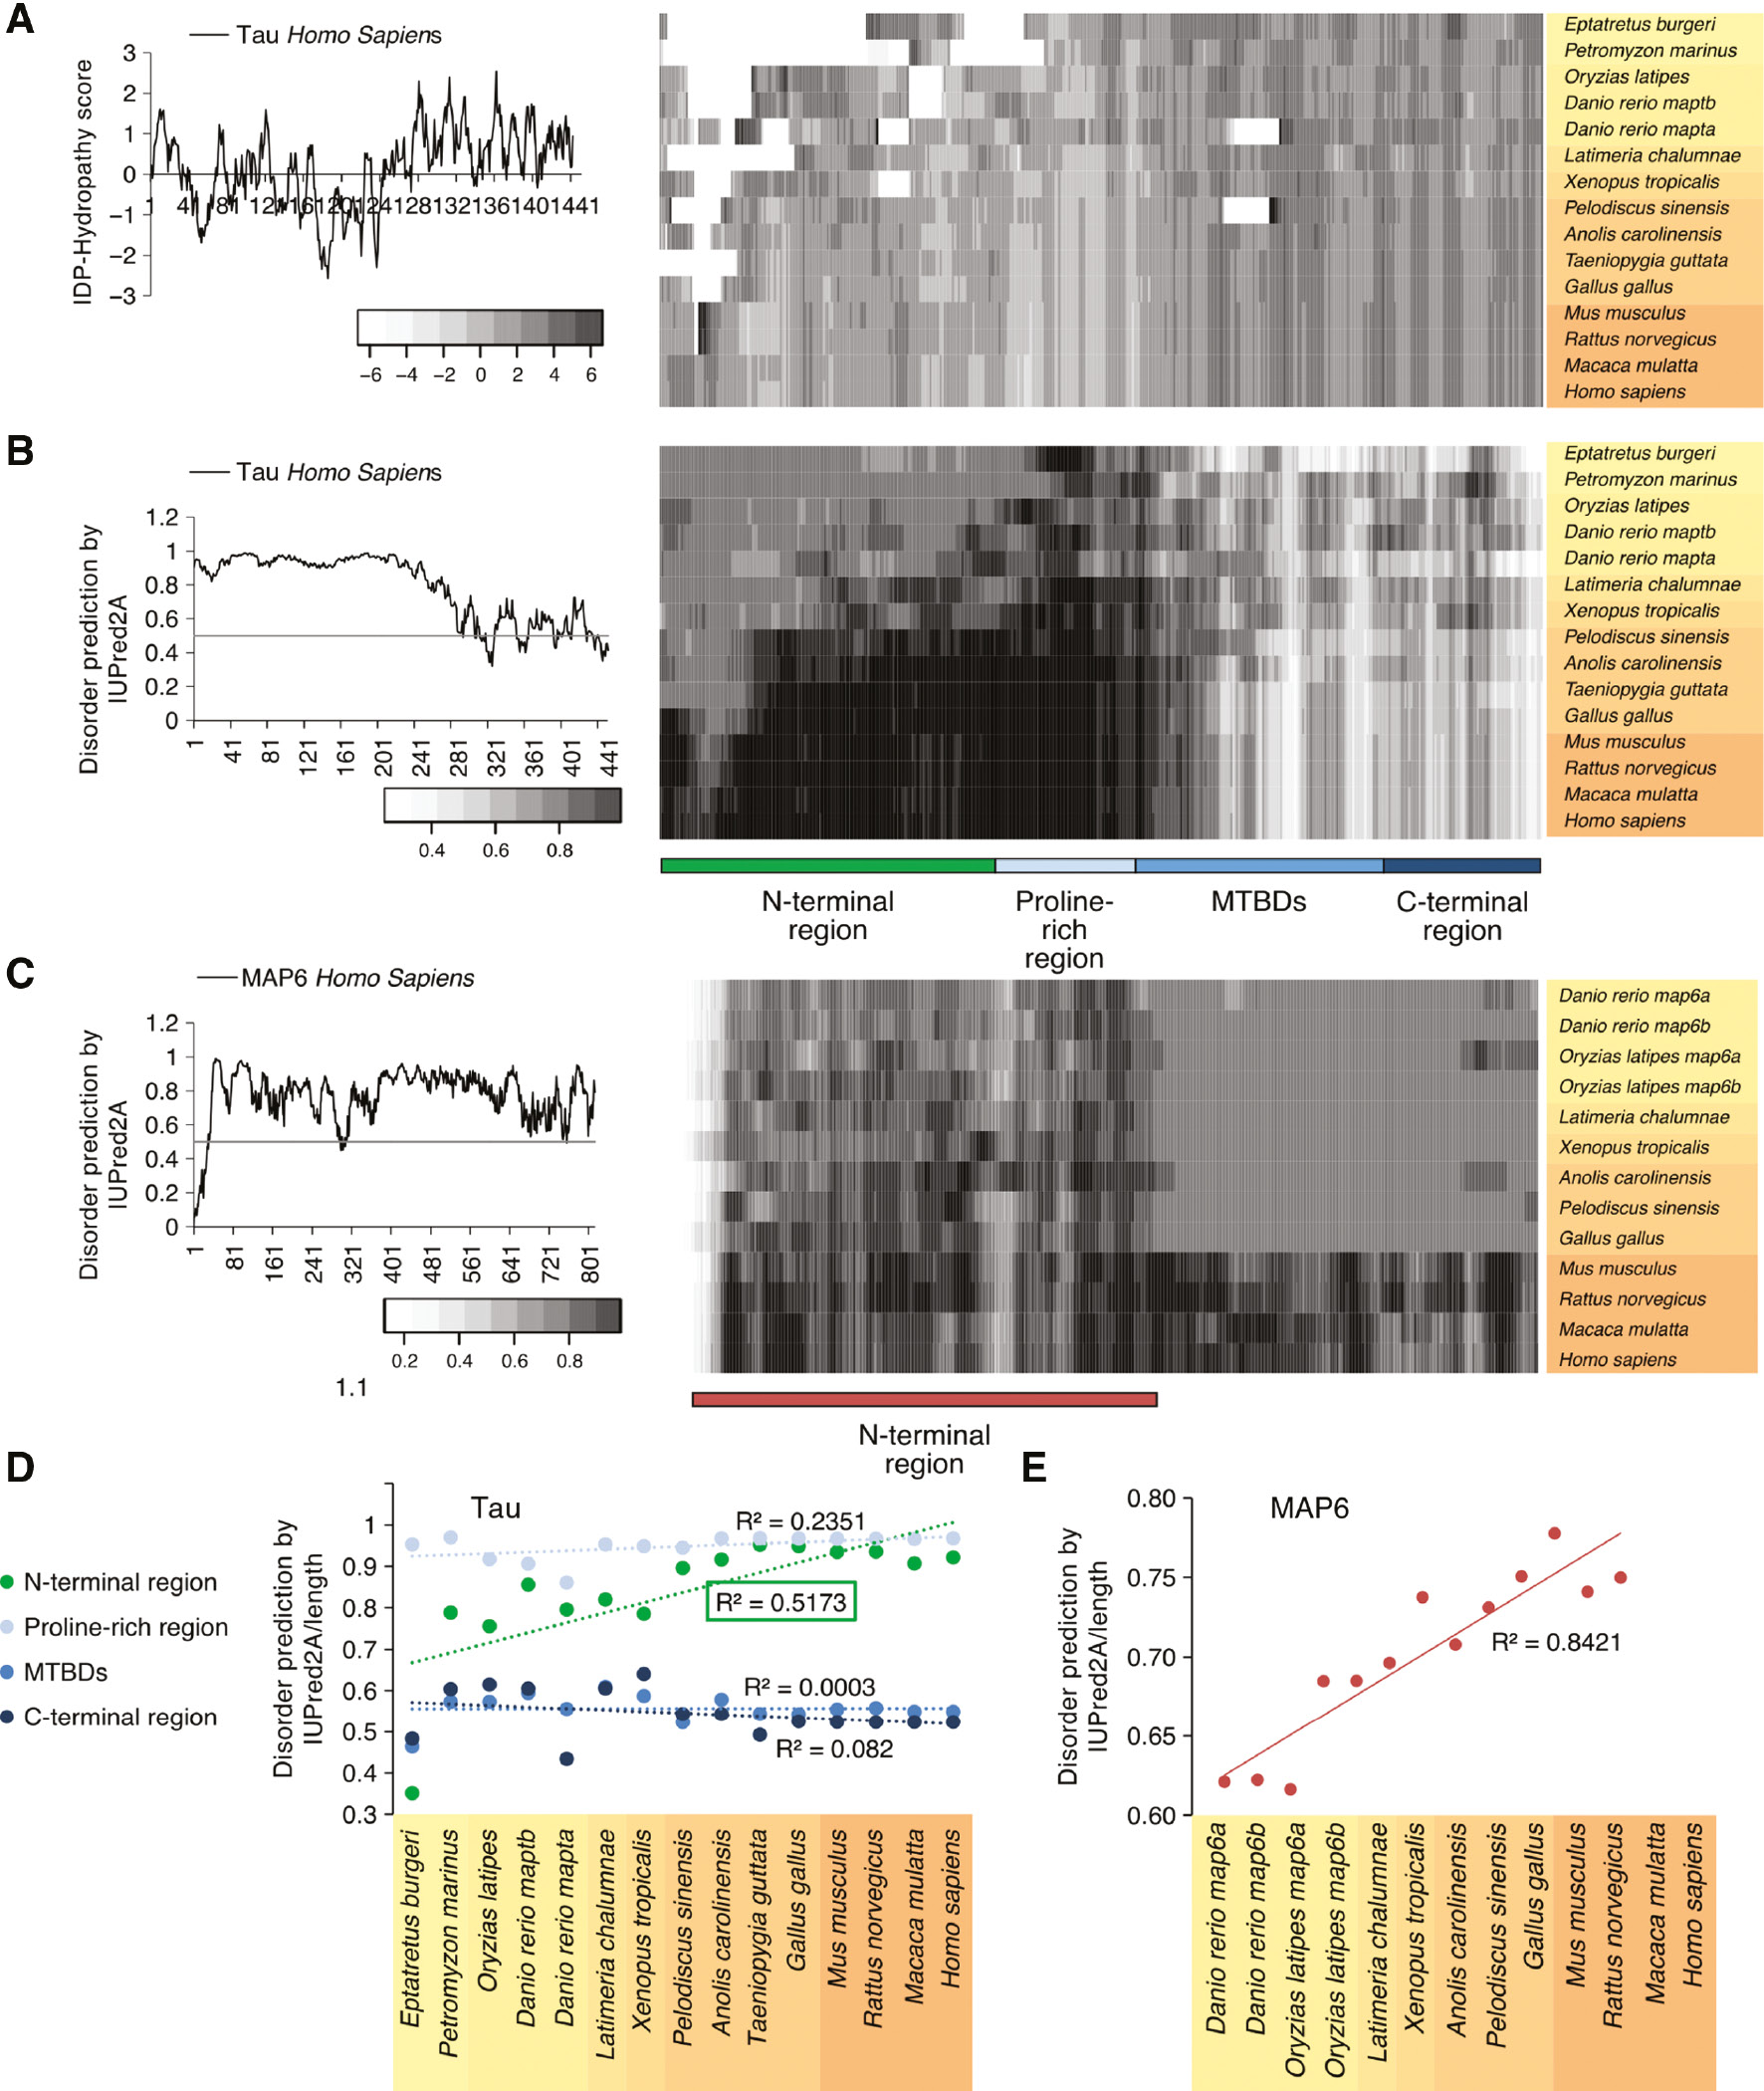
Predicted structure properties of tau and MAP6 throughout evolution of vertebrates.
(A) Intrinsically disordered protein (IDP)-hydropathy plot of the longest human CNS MAPT isoform coding for tau containing 441 amino acids (aa) is shown on the left. An IDP-hydropathy map of tau for selected organisms is shown on the right. The respective values were smoothened with a 10aa-window. Gaps in the alignment appear white. (B) Disorder prediction plot of human tau (441 aa) is shown on the left. For the prediction, the program IUPred2A with prediction type ‘long disorder’ was used. A disorder prediction map of tau for selected organisms is shown on the right. The different regions of tau are indicated below. Note that the map suggests an increase in predicted disorder in particular in tau’s N-terminal part (green). (C) Disorder prediction plot of human MAP6 ‘canonical’ isoform (813 aa) is shown on the left. For the prediction, the program IUPred2A with prediction type ‘long disorder’ was used. A disorder prediction map of MAP6 for selected organisms is shown on the right. The region of MAP6 that is present in all of the selected organisms (N-terminal region) is indicated below. Note that only mammalian MAP6 have longer C-terminal sequences. For comparison only the N-terminal regions were taken. (D) Quantitative evaluation of disorder in different regions of tau (as indicated in B) for selected organisms is shown. The respective R2 values are shown in the graphs. The species are color coded from yellow to orange as shown in Figure 2. Note that only the N-terminal region exhibits a clear increase in disorder. (E) Quantitative evaluation of disorder in the N-terminal region of MAP6 (as indicated in C) for selected organisms is shown. The respective R2 value is shown in the graph. The species are color coded from yellow to orange as shown in Figure 2. Note that the N-terminus of MAP6 exhibits a clear increase in disorder.
Next, we analyzed whether stathmin 1 (Figure 5A) and any region of MAP2 (Figure S2A), in particular its projection-domain (full sequences of which were only available for some land vertebrates), also have any propensity to change the extent of disorder throughout evolution. Stathmin 1 is more disordered on the C-terminus compared to the N-terminus (Figure 5A, left). The projection-domain of MAP2 also showed some regions of disorder (Figure S2A, left). The disorder prediction map of both proteins did not show an obvious trend in the change of the extent of disorder during evolution neither in the whole protein nor in any protein region (Figure 5A, S2A, right). This was confirmed by a quantitative analysis of the extent of predicted disorder for individual regions (SLD for stathmin 1; N-terminal region, projection domain, proline-rich region, MTBDs, C-terminal region for MAP2), where no specific trend was observed for any region (Figures 5B, S2B, S4C, D).
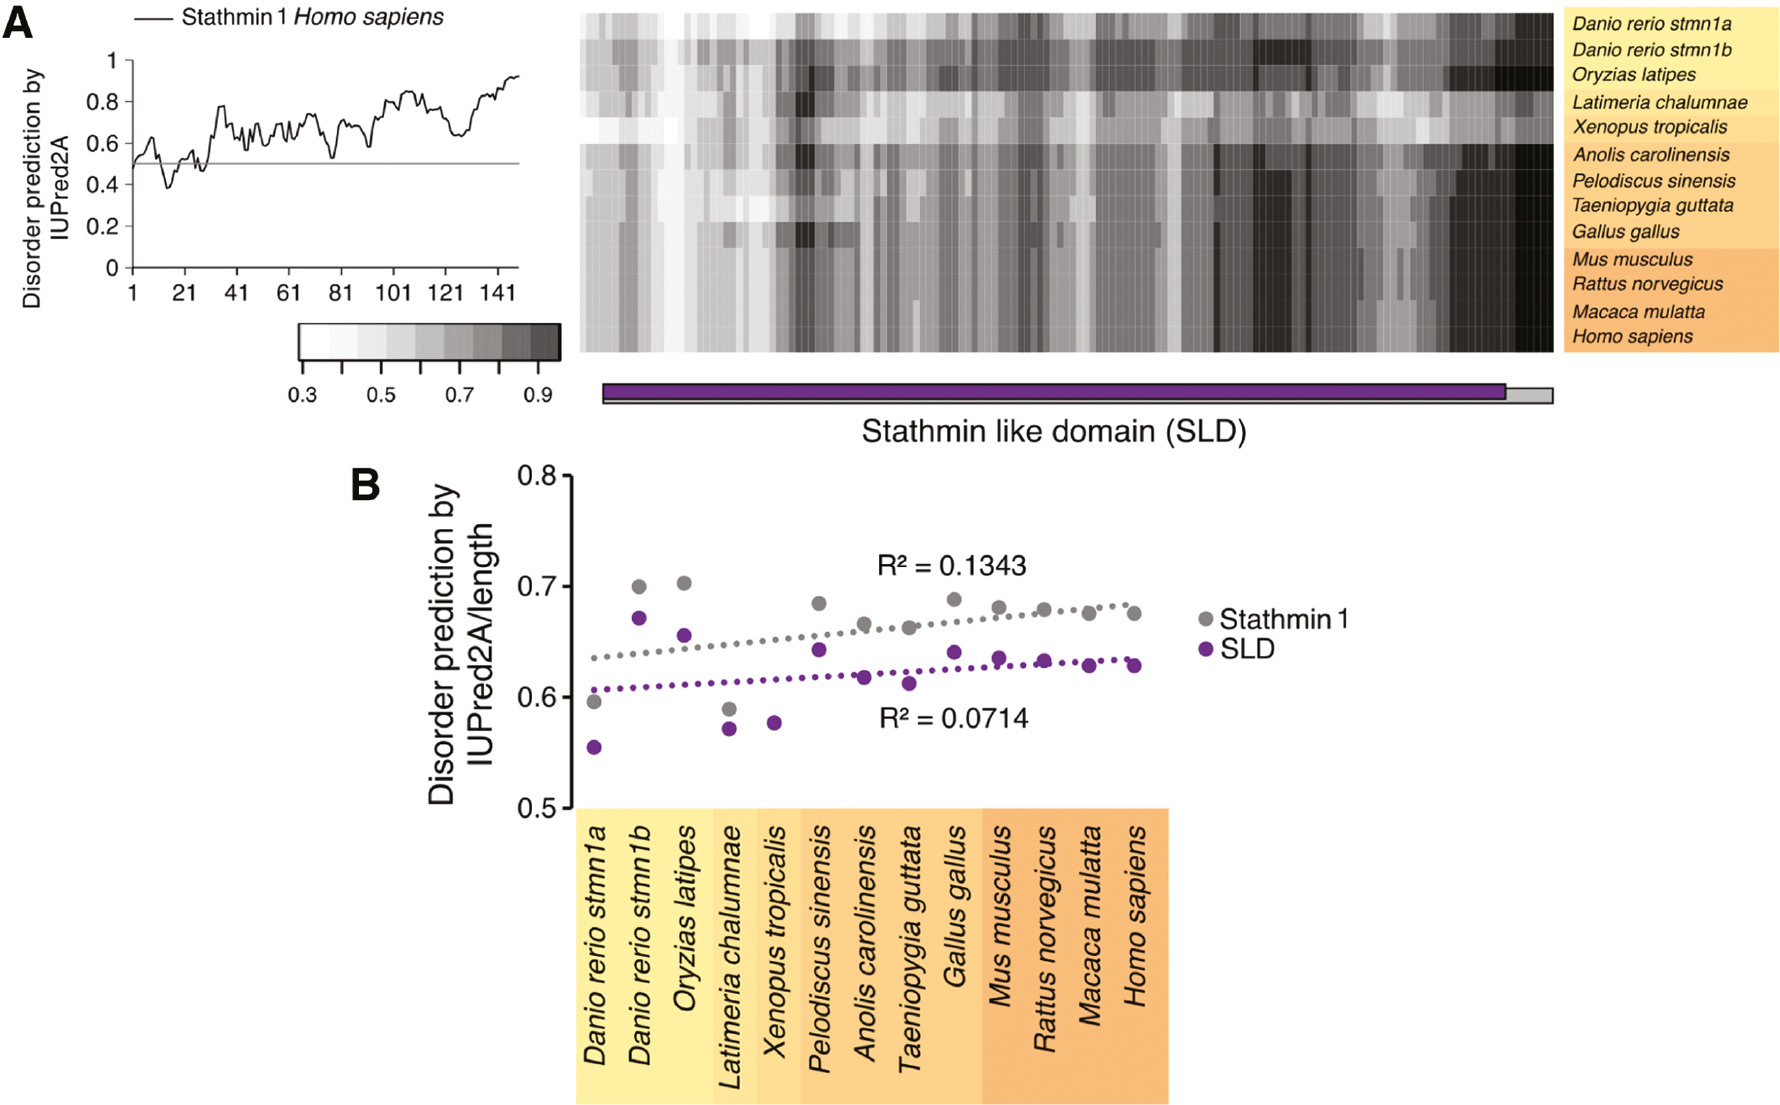
Predicted disorder of stathmin 1 throughout evolution of vertebrates.
(A) Disorder prediction plot of human stathmin 1 (149 aa) (coded by the STMN1 gene) is shown on the left. For the prediction, the program IUPred2A with prediction type ‘long disorder’ was used. A disorder prediction map of stathmin 1 for selected organisms is shown on the right. The SLD is indicated below. (B) Quantitative evaluation of disorder of whole stathmin 1 and the SLD as indicated in (A) for selected organisms is shown. The respective R2 values are shown in the graphs. The species are color coded from yellow to orange as shown in Figure 2. Note that none of the regions exhibits a clear trend of disorder change throughout evolution.
Although not being a classic MT-associated protein, experimental evidence indicates that the presynaptic protein α-synuclein also interacts with MTs (Cartelli et al., 2016; Toba et al., 2017). Therefore, we decided to include α-synuclein (encoded by the SNCA gene) in our analysis, as it is known to be an IDP (Uversky, 2015). α-Synuclein is mainly disordered on the C-terminal part (Figure S3A). However, our data show that there is no increase (but rather a decrease) in the extent of disorder in this protein during evolution (Figures S3B, S4E).
The data indicate that MT-binding and tubulin-sequestering proteins contain IDRs, which may serve as interaction domains in cellular protein-protein interaction networks. However, with respect to changes during evolution, a clear increase in disorder was only evident in the N-terminal region of tau and MAP6. This suggests a unique role of the projection domain of tau and the N-terminus of MAP6, which developed during evolution and provided a mechanism for increased binding promiscuity. Interestingly, tau is the only MAP which is directly involved in neurodegenerative diseases and aggregates of tau protein have been observed in Alzheimer’s disease and other tauopathies. Thus, the increase in disorder during evolution may be associated with the misbehavior of the IDR in neurodegenerative diseases and could explain why tauopathies have only been observed in higher vertebrates.
Discussion
In this study we tested the hypothesis that the evolution of neuronal complexity is driven by an increasing capacity of the MT system for regulated molecular interactions as it may be implemented by a higher number of molecular players and a greater ability of the individual molecules to interact. We focused our bioinformatics analysis on the examination of six different classes of proteins, which have been implicated in the development of neuronal morphology, and we restricted our study to vertebrates as they have a similar organization of their nervous system.
We show that, during vertebrate evolution, (1) three classes of proteins – tubulin-structure proteins, MT-binding proteins and tubulin-sequestering proteins – displayed a particular large increase in the number of orthologs, and that (2) the protein diversity of MT-binding and tubulin-sequestering proteins increased by alternative splicing during the evolution of land vertebrates. In addition, we found that (3) although several MT-binding and tubulin-sequestering proteins contained IDRs, only the N-terminal region of the MT-binding protein tau and MAP6 displayed a clear increase in disorder during evolution.
The role of the MT skeleton in the development and functioning of the nervous system seems to be immense and a spatiotemporal fine tuning of MT dynamics is very important. There are various possibilities to increase the capacity for the fine tuning of MT skeleton function during evolution. These include gene expansions, changes in alternative splicing, evolution of coding sequences and post-translational modifications. Tau is probably the best studied MT regulating protein due to its involvement in neurodegenerative diseases (Bakota et al., 2017). MAPT codes for many isoforms, some of which are produced in the CNS, others were shown to be only present in the peripheral nervous system (PNS). The gene contains 16 exons and in the adult human brain, six isoforms are expressed, produced by alternative splicing of exons 2, 3 and 10. We found that MT-binding proteins (tau, MAP2 and MAP4) did not have major changes in the numbers of exons, while tubulin-sequestering proteins such as the stathmins (coded by STMN1–4 genes) displayed a slight increase in this parameter. This might be due to the fact that MAPs already had a high complexity early in evolution due to a large number of exons, which already provided many combinatorial possibilities for functional regulation. In support of such a hypothesis, protein diversity of the MAPs increased by alternative splicing during evolution. In contrast, stathmins are very small proteins, so that the presence of additional exons would facilitate fine tuning in more complex neurons. Hence, MAPs and stathmins of vertebrates could be considered as proteoforms owing to their ability to exist in multiple forms while being coded by same genes (Smith et al., 2013; Uversky, 2016).
MT-binding and tubulin-sequestering proteins displayed an additional mechanism for modulation and control of their binding partners by intrinsically disordered protein regions. A higher extent of protein disorder was proposed to correlate with higher numbers of interaction partners, which may imply higher complexity of regulation (Uversky, 2015, 2016). We observed that the projection domain of tau and MAP6 exhibited an increase in disorder during evolution while MAP2 or stathmins did not display such a trend. Thus, some IDRs of MT-binding and MT-severing proteins may become more disordered throughout evolution implying increasing regulation complexity, whereas in others, structured regions or regions prone to induced folding may become more ordered calling for higher specificity. The increase in disorder in the case of the projection domain of tau and the N-terminal part of MAP6 correlates with a transition from poikilotherms to homeotherms. On the one hand, the proteins of poikilotherms (e.g. fishes) operate at lower temperatures than those of homeotherms. On the other hand, intrinsically disordered proteins were shown to attain secondary structure elements and ‘collapse’ at higher temperatures (Uversky, 2009); it appears that their ‘spread wide’ structures, which allow interactions with multiple partners, are maintained by networks of weak bonds that become disrupted at higher temperature (Langridge et al., 2014). Therefore, the increase in predicted disordered segments in case of tau and MAP6 of homeotherms deserves attention. Several possibilities, which are not mutually exclusive, could be considered: (1) the predicted disordered segments might be less disordered as predicted and contain secondary structure elements in the case of vertebrates with high body temperature; (2) the complex network of bonds, which stabilizes the divaricate structure of intrinsically disordered segments, remains intact only at particular, optimal temperatures that can be maintained by homeotherms, but not poikilotherms; (3) the evolutionary pressure for attaining new functions in the framework of the structure-function continuum (Uversky, 2016) was so strong in the case of tau and MAP6 that the fraction of intrinsically disordered segments increased in spite of higher body temperature. Comparative analysis of other nervous system proteins may help to discriminate between these three possibilities.
We performed our analysis using IUPred2A which is just one of many disorder predictors. Using multiple disorder predictors may have the potential to provide further insights with respect to the variability in the intrinsic disorder predisposition. Moreover, predictions of disorder-based interaction regions related to the protein functionality [such as MoRFpred (Disfani et al., 2012) or OPAL (Sharma et al., 2018)] may be conducted to further analyze the regions with changed disorder.
We would like to emphasize that we did not touch the subject of post-translational modifications. It is known that the tubulin-structure proteins α- and β-tubulin exhibit many kinds of posttranslational modifications such as acetylation, polyglutamylation, polyglycylation and detyrosination and changes in the tubulin code may be important for fine-tuning of the MT system (Gadadhar et al., 2017). It is also known that phosphorylation is an important mechanism to regulate the function of several MT-binding and tubulin-sequestering proteins (Uchida and Shumyatsky, 2015; Ramkumar et al., 2018). Thus, it is likely that the different post-translational modifications provide an additional level of regulation of the interactions and functions of proteins of the MT system, which also deserve analysis.
Taken together, our data suggest that evolutionary changes in tubulin-structure proteins, MT-binding proteins and tubulin-sequestering proteins in particular were prominent drivers for the development of increased neuronal complexity, while this was less the case for MT nucleators, MT end-binding, and MT-severing proteins. It will be important to test aspects of this hypothesis by an evolutionary cell biological approach, i.e. whether changes in intrinsically disordered protein regions of MAPs affect the size of the interactome of the MT system, and which novel interactions and functions are mediated by specific, evolutionary new isoforms of MT-binding and tubulin-sequestering proteins or variants of α- and β-tubulin during neuronal morphogenesis. In the future, it would also be of interest to determine whether tendencies similar to those described in this study can be found in proteins associated with neurofilaments and microfilaments.
Materials and methods
Phylogeny
Dendrograms were generated by phyloT (phylot.biobyte.de) which is based on NCBI taxonomy (ncbi.nlm.nih.gov/Taxonomy) and visualized with Interactive Tree Of Life (itol.embl.de; Letunic and Bork, 2016). From the early diverged groups of vertebrates, superclass Cyclostomata, we took two available organisms: hagfish (Eptatretus burgeri) and lamprey (Petromyzon marinus). For taxons where more organisms were available, we selected well-studied model organisms, such as zebrafish (Danio rerio) and Japanese medaka (Oryzias latipes). We took into consideration available species from Sarcopterygii superclass: coelacanth (Latimeria chalumnae) and frog (Xenopus tropicalis). For Sauropsida we selected species from different groups that include the following: superorder Lepidosauria – anole lizard (Anolis carolinensis), order Testudines – Chinese softshell turtle (Pelodiscus sinensis), class Aves – well-studied birds: zebra finch (Taeniopygia guttata) and chicken (Gallus gallus). For class Mammalia we selected the model organism mouse (Mus musculus), rat (Rattus norvegicus) and macaque (Macaca mulatta). Protein-coding splice variants and maximal number of exons analysis, as well as consequent sequences analysis also included human (Homo sapiens). The extended list of organisms was based on available vertebrates from Ensembl genome browser Release 94 (Zerbino et al., 2018). All organisms were also grouped by the mentioned taxons.
Identification of orthologs
The following MT skeleton components, which are involved in regulating neuronal MT dynamics, were selected for analysis: structure proteins (α- and β-tubulins), nucleators [γ-tubulins and γ-tubulin complex proteins (GCPs)], MT-binding proteins [MAP1A, MAP1B, MAP1S, MAP2, tau (encoded by the MAPT gene), MAP4, MAP6 (STOP) and MAP7 (ensconsin)], tubulin-sequestering proteins [stathmins, encoded by STMN1, STMN2 (SCG10), STMN3 (SCLIP), STMN4 (RB3)], end-binding proteins [including EB1, EB2, EB3 (encoded by MAPRE1, MAPRE2, MAPRE3, respectively), CLASP1 and CLASP2], MT-severing proteins [P60-katanin (encoded by KATNA1 and KATNB1), fidgetin (FIGN) and spastin (SPAST)]. Numbers of predicted orthologs of selected human MT skeleton components in different species were retrieved from Ensembl genome browser release 94 (Zerbino et al., 2018). The search was conducted in tables of predicted orthologs for each selected human gene. Orthologs were predicted either with high confidence based on the high percentage of identity, high Gene Order Conservation Score or Whole Genome Alignment coverage in the Ensembl genome browser. Orthologs of selected genes predicted with high confidence in selected species were used to build Figure 2.
Estimation of tubulin gene numbers
Tubulin gene data for this paper were retrieved from respective organisms’ databases [December 5, 2018]: GeneCards – the human gene database (Stelzer et al., 2016), the Rat Genome Database (Shimoyama et al., 2015), Mouse Genome Informatics – the mouse genome database (Smith et al., 2018), Xenbase (Wang et al., 2017), The Zebrafish Information Network (Howe et al., 2013). TUBA, TUBB and TUBG genes were searched for in the presented databases, which can be further investigated to assess the homologous relationship between genes from different organisms. Pseudogenes and tubulin-like genes were not taken into consideration for building Table 2.
Estimation of splice variant numbers and exon numbers
We assessed the numbers of protein-coding splice variants for MT-binding proteins and tubulin-sequestering proteins and also the numbers of exons that could be observed from available data from Ensembl genome browser release 94 (Figure 3). We took the maximal exons number as they would arguably represent the most complex form.
Hydropathy and disorder predictions
Protein sequences analyzed in this study were retrieved from Uniprot (uniprot.org, release 12/2018), Refseq Release 91 (ncbi.nlm.nih.gov/refseq) and Ensembl genome browser Release 94. We based our search on the longest human CNS MAPT isoform coding for tau containing 441 amino acids (aa), human MAP6 (813 aa), human stathmin 1 (STMN1, isoform coding for 149 aa), human α-synuclein (SNCA, isoform coding for 140 aa) and longest isoform of MAP2 (containing 1827 aa), sometimes referred to as MAP2b and expressed in adult neurons; only sequences containing long projection domain were taken (Table S2). Alignment of obtained sequences was performed with ProbCons (Do et al., 2005) and further edited manually. We assessed the different amino acid sequence characteristics throughout the sequences coded by MAPT from selected vertebrate organisms (Figure 4). Properties for selected sequences were predicted with IDP-hydropathy scale (smoothed by a 10 aa window), a scale that has been shown to better discriminate between structured proteins and IDPs (Huang et al., 2014), and IUPred2A, an algorithm that evaluates the energy resulting from inter-residues interactions (Meszaros et al., 2018). We also assessed the IUPred2A predictions for the sequences of stathmin 1, MAP2 and α-synuclein (coded by STMN1, MAP2 and SNCA, respectively) from selected vertebrate organisms (Figures 5, S2 and S4).
Acknowledgments
We thank Lidia Bakota for helpful suggestions on the manuscript and Mariya Hrynchak for providing a picture of mouse neurons. This work was supported by a fellowship of the graduate college ‘EvoCell’ of the University of Osnabrück (to N.T.).
References
Abdollahi, M.R., Morrison, E., Sirey, T., Molnar, Z., Hayward, B.E., Carr, I.M., Springell, K., Woods, C.G., Ahmed, M., Hattingh, L., et al. (2009). Mutation of the variant alpha-tubulin TUBA8 results in polymicrogyria with optic nerve hypoplasia. Am. J. Hum. Genet. 85, 737–744.10.1016/j.ajhg.2009.10.007Suche in Google Scholar
Altemus, K.L., Lavenex, P., Ishizuka, N., and Amaral, D.G. (2005). Morphological characteristics and electrophysiological properties of CA1 pyramidal neurons in macaque monkeys. Neuroscience 136, 741–756.10.1016/j.neuroscience.2005.07.001Suche in Google Scholar
Bakota, L., Ussif, A., Jeserich, G., and Brandt, R. (2017). Systemic and network functions of the microtubule-associated protein tau: implications for tau-based therapies. Mol. Cell Neurosci. 84, 132–141.10.1016/j.mcn.2017.03.003Suche in Google Scholar
Bartsch, T., Dohring, J., Rohr, A., Jansen, O., and Deuschl, G. (2011). CA1 neurons in the human hippocampus are critical for autobiographical memory, mental time travel, and autonoetic consciousness. Proc. Natl. Acad. Sci. U.S.A. 108, 17562–17567.10.1073/pnas.1110266108Suche in Google Scholar
Belmont, L.D. and Mitchison, T.J. (1996). Identification of a protein that interacts with tubulin dimers and increases the catastrophe rate of microtubules. Cell. 84, 623–631.10.1016/S0092-8674(00)81037-5Suche in Google Scholar
Brandt, R. and Leschik, J. (2004). Functional interactions of tau and their relevance for Alzheimer’s disease. Curr. Alzheimer Res. 1, 255–269.10.2174/1567205043332054Suche in Google Scholar PubMed
Brandt, R. and Paululat, A. (2013). Microcompartments in the Drosophila heart and the mammalian brain: general features and common principles. Biol. Chem. 394, 217–230.10.1515/hsz-2012-0261Suche in Google Scholar PubMed
Breuss, M., Heng, J.I., Poirier, K., Tian, G., Jaglin, X.H., Qu, Z., Braun, A., Gstrein, T., Ngo, L., Haas, M., et al. (2012). Mutations in the beta-tubulin gene TUBB5 cause microcephaly with structural brain abnormalities. Cell Rep. 2, 1554–1562.10.1016/j.celrep.2012.11.017Suche in Google Scholar PubMed PubMed Central
Breuss, M.W., Leca, I., Gstrein, T., Hansen, A.H., and Keays, D.A. (2017). Tubulins and brain development – the origins of functional specification. Mol. Cell. Neurosci. 84, 58–67.10.1016/j.mcn.2017.03.002Suche in Google Scholar PubMed
Cartelli, D., Aliverti, A., Barbiroli, A., Santambrogio, C., Ragg, E.M., Casagrande, F.V., Cantele, F., Beltramone, S., Marangon, J., De Gregorio, C., et al. (2016). Alpha-Synuclein is a novel microtubule dynamase. Sci. Rep. 6, 33289.10.1038/srep33289Suche in Google Scholar PubMed PubMed Central
Chauvin, S. and Sobel, A. (2015). Neuronal stathmins: a family of phosphoproteins cooperating for neuronal development, plasticity and regeneration. Prog. Neurobiol. 126, 1–18.10.1016/j.pneurobio.2014.09.002Suche in Google Scholar PubMed
Chneiweiss, H., Beretta, L., Cordier, J., Boutterin, M.C., Glowinski, J., and Sobel, A. (1989). Stathmin is a major phosphoprotein and cyclic AMP-dependent protein kinase substrate in mouse brain neurons but not in astrocytes in culture: regulation during ontogenesis. J. Neurochem. 53, 856–863.10.1111/j.1471-4159.1989.tb11783.xSuche in Google Scholar PubMed
Chuckowree, J.A., Zhu, Z., Brizuela, M., Lee, K.M., Blizzard, C.A., and Dickson, T.C. (2018). The microtubule-modulating drug Epothilone D alters dendritic spine morphology in a mouse model of mild traumatic brain injury. Front. Cell. Neurosci. 12, 223–223.10.3389/fncel.2018.00223Suche in Google Scholar PubMed PubMed Central
Cushion, T.D., Paciorkowski, A.R., Pilz, D.T., Mullins, J.G., Seltzer, L.E., Marion, R.W., Tuttle, E., Ghoneim, D., Christian, S.L., Chung, S.K., et al. (2014). De novo mutations in the beta-tubulin gene TUBB2A cause simplified gyral patterning and infantile-onset epilepsy. Am. J. Hum. Genet. 94, 634–641.10.1016/j.ajhg.2014.03.009Suche in Google Scholar PubMed PubMed Central
Dacheux, D., Roger, B., Bosc, C., Landrein, N., Roche, E., Chansel, L., Trian, T., Andrieux, A., Papaxanthos-Roche, A., Marthan, R., et al. (2015). Human FAM154A (SAXO1) is a microtubule-stabilizing protein specific to cilia and related structures. J. Cell Sci. 128, 1294–1307.10.1242/jcs.155143Suche in Google Scholar PubMed
Defelipe, J. (2011). The evolution of the brain, the human nature of cortical circuits, and intellectual creativity. Front. Neuroanat. 5, 29.10.3389/fnana.2011.00029Suche in Google Scholar PubMed PubMed Central
Dehmelt, L. and Halpain, S. (2005). The MAP2/Tau family of microtubule-associated proteins. Genome Biol. 6, 204–204.10.1186/gb-2004-6-1-204Suche in Google Scholar PubMed PubMed Central
Dent, E.W., Callaway, J.L., Szebenyi, G., Baas, P.W., and Kalil, K. (1999). Reorganization and movement of microtubules in axonal growth cones and developing interstitial branches. J. Neurosci. 19, 8894–8908.10.1523/JNEUROSCI.19-20-08894.1999Suche in Google Scholar
Díez-Guerra, F.J. and Avila, J. (1993). MAP2 phosphorylation parallels dendrite arborization in hippocampal neurones in culture. Neuroreport 4, 419–422.10.1097/00001756-199304000-00020Suche in Google Scholar PubMed
Disfani, F.M., Hsu, W.L., Mizianty, M.J., Oldfield, C.J., Xue, B., Dunker, A.K., Uversky, V.N., and Kurgan, L. (2012). MoRFpred, a computational tool for sequence-based prediction and characterization of short disorder-to-order transitioning binding regions in proteins. Bioinformatics 28, i75–i83.10.1093/bioinformatics/bts209Suche in Google Scholar PubMed PubMed Central
Do, C.B., Mahabhashyam, M.S., Brudno, M., and Batzoglou, S. (2005). ProbCons: Probabilistic consistency-based multiple sequence alignment. Genome Res. 15, 330–340.10.1101/gr.2821705Suche in Google Scholar
Dutcher, S.K. (2003). Long-lost relatives reappear: identification of new members of the tubulin superfamily. Curr. Opin. Microbiol. 6, 634–640.10.1016/j.mib.2003.10.016Suche in Google Scholar
Edson, K., Weisshaar, B., and Matus, A. (1993). Actin depolymerisation induces process formation on MAP2-transfected non-neuronal cells. Development 117, 689–700.10.1242/dev.117.2.689Suche in Google Scholar
Ems-McClung, S.C. and Walczak, C.E. (2010). Kinesin-13s in mitosis: key players in the spatial and temporal organization of spindle microtubules. Semin. Cell Dev. Biol. 21, 276–282.10.1016/j.semcdb.2010.01.016Suche in Google Scholar
Faivre, C., Legrand, C., and Rabie, A. (1985). The microtubular apparatus of cerebellar Purkinje cell dendrites during postnatal development of the rat: the density and cold-stability of microtubules increase with age and are sensitive to thyroid hormone deficiency. Int. J. Dev. Neurosci. 3, 559–565.10.1016/0736-5748(85)90045-0Suche in Google Scholar
Fanara, P., Husted, K.H., Selle, K., Wong, P.Y.A., Banerjee, J., Brandt, R., and Hellerstein, M.K. (2010). Changes in microtubule turnover accompany synaptic plasticity and memory formation in response to contextual fear conditioning in mice. Neuroscience 168, 167–178.10.1016/j.neuroscience.2010.03.031Suche in Google Scholar PubMed
Fiala, J.C., Kirov, S.A., Feinberg, M.D., Petrak, L.J., George, P., Goddard, C.A., and Harris, K.M. (2003). Timing of neuronal and glial ultrastructure disruption during brain slice preparation and recovery in vitro. J. Compar. Neurol. 465, 90–103.10.1002/cne.10825Suche in Google Scholar PubMed
Furlanis, E. and Scheiffele, P. (2018). Regulation of neuronal differentiation, function, and plasticity by alternative splicing. Annu. Rev. Cell Dev. Biol. 34, 451–469.10.1146/annurev-cellbio-100617-062826Suche in Google Scholar PubMed PubMed Central
Gadadhar, S., Bodakuntla, S., Natarajan, K., and Janke, C. (2017). The tubulin code at a glance. J. Cell Sci. 130, 1347–1353.10.1242/jcs.199471Suche in Google Scholar PubMed
Gauthier-Kemper, A., Weissmann, C., Golovyashkina, N., Sebo-Lemke, Z., Drewes, G., Gerke, V., Heinisch, J.J., and Brandt, R. (2011). The frontotemporal dementia mutation R406W blocks tau’s interaction with the membrane in an annexin A2-dependent manner. J. Cell Biol. 192, 647–661.10.1083/jcb.201007161Suche in Google Scholar PubMed PubMed Central
Gauthier-Kemper, A., Suarez Alonso, M., Sundermann, F., Niewidok, B., Fernandez, M.P., Bakota, L., Heinisch, J.J., and Brandt, R. (2018). Annexins A2 and A6 interact with the extreme N terminus of tau and thereby contribute to tau’s axonal localization. J. Biol. Chem. 293, 8065–8076.10.1074/jbc.RA117.000490Suche in Google Scholar PubMed PubMed Central
Ghysen, A. (2003). The origin and evolution of the nervous system. Int. J. Dev. Biol. 47, 555–562.Suche in Google Scholar
Golovyashkina, N., Penazzi, L., Ballatore, C., Smith 3rd, A.B., Bakota, L., and Brandt, R. (2015). Region-specific dendritic simplification induced by Aβ, mediated by tau via dysregulation of microtubule dynamics: a mechanistic distinct event from other neurodegenerative processes. Mol. Neurodegen. 10, 60.10.1186/s13024-015-0049-0Suche in Google Scholar PubMed PubMed Central
Goriounova, N.A., Heyer, D.B., Wilbers, R., Verhoog, M.B., Giugliano, M., Verbist, C., Obermayer, J., Kerkhofs, A., Smeding, H., Verberne, M., et al. (2018). Large and fast human pyramidal neurons associate with intelligence. eLife 7, e41714.10.7554/eLife.41714Suche in Google Scholar PubMed PubMed Central
Gouveia, S.M. and Akhmanova, A. (2010). Cell and molecular biology of microtubule plus end tracking proteins: end binding proteins and their partners. Int. Rev. Cell Mol. Biol. 285, 1–74.10.1016/B978-0-12-381047-2.00001-3Suche in Google Scholar PubMed
Grenningloh, G., Soehrman, S., Bondallaz, P., Ruchti, E., and Cadas, H. (2004). Role of the microtubule destabilizing proteins SCG10 and stathmin in neuronal growth. J. Neurobiol. 58, 60–69.10.1002/neu.10279Suche in Google Scholar PubMed
Gu, J., Firestein, B.L., and Zheng, J.Q. (2008). Microtubules in dendritic spine development. J. Neurosci. 28, 12120–12124.10.1523/JNEUROSCI.2509-08.2008Suche in Google Scholar PubMed PubMed Central
Gunawardana, C.G., Mehrabian, M., Wang, X., Mueller, I., Lubambo, I.B., Jonkman, J.E., Wang, H., and Schmitt-Ulms, G. (2015). The human tau interactome: binding to the ribonucleoproteome, and impaired binding of the proline-to-leucine mutant at position 301 (P301L) to chaperones and the proteasome. Mol. Cell Proteomics. 14, 3000–3014.10.1074/mcp.M115.050724Suche in Google Scholar PubMed PubMed Central
Harada, A., Teng, J., Takei, Y., Oguchi, K., and Hirokawa, N. (2002). MAP2 is required for dendrite elongation, PKA anchoring in dendrites, and proper PKA signal transduction. J. Cell Biol. 158, 541–549.10.1083/jcb.200110134Suche in Google Scholar PubMed PubMed Central
Herculano-Houzel, S., Manger, P.R., and Kaas, J.H. (2014). Brain scaling in mammalian evolution as a consequence of concerted and mosaic changes in numbers of neurons and average neuronal cell size. Front. Neuroanat. 8, 77.10.3389/fnana.2014.00077Suche in Google Scholar PubMed PubMed Central
Honnappa, S., Jahnke, W., Seelig, J., and Steinmetz, M.O. (2006). Control of intrinsically disordered stathmin by multisite phosphorylation. J. Biol. Chem. 281, 16078–16083.10.1074/jbc.M513524200Suche in Google Scholar PubMed
Howe, D.G., Bradford, Y.M., Conlin, T., Eagle, A.E., Fashena, D., Frazer, K., Knight, J., Mani, P., Martin, R., Moxon, S.A., et al. (2013). ZFIN, the Zebrafish Model Organism Database: increased support for mutants and transgenics. Nucleic Acids Res. 41, D854–860.10.1093/nar/gks938Suche in Google Scholar PubMed PubMed Central
Hu, C.-K., Coughlin, M., Field, C.M., and Mitchison, T.J. (2008). Cell polarization during monopolar cytokinesis. J. Cell Biol. 181, 195–202.10.1083/jcb.200711105Suche in Google Scholar PubMed PubMed Central
Huang, F., Oldfield, C.J., Xue, B., Hsu, W.L., Meng, J., Liu, X., Shen, L., Romero, P., Uversky, V.N., and Dunker, A. (2014). Improving protein order-disorder classification using charge-hydropathy plots. BMC Bioinformatics 15(Suppl 17), S4.10.1186/1471-2105-15-S17-S4Suche in Google Scholar PubMed PubMed Central
Ishizuka, N., Cowan, W.M., and Amaral, D.G. (1995). A quantitative analysis of the dendritic organization of pyramidal cells in the rat hippocampus. J. Comp. Neurol. 362, 17–45.10.1002/cne.903620103Suche in Google Scholar PubMed
Jaglin, X.H., Poirier, K., Saillour, Y., Buhler, E., Tian, G., Bahi-Buisson, N., Fallet-Bianco, C., Phan-Dinh-Tuy, F., Kong, X.P., Bomont, P., et al. (2009). Mutations in the beta-tubulin gene TUBB2B result in asymmetrical polymicrogyria. Nat. Genet. 41, 746–752.10.1038/ng.380Suche in Google Scholar PubMed PubMed Central
Jaworski, J., Kapitein, L.C., Gouveia, S.M., Dortland, B.R., Wulf, P.S., Grigoriev, I., Camera, P., Spangler, S.A., Di Stefano, P., Demmers, J., et al. (2009). Dynamic microtubules regulate dendritic spine morphology and synaptic plasticity. Neuron 61, 85–100.10.1016/j.neuron.2008.11.013Suche in Google Scholar PubMed
Jeganathan, S., von Bergen, M., Mandelkow, E.M., and Mandelkow, E. (2008). The natively unfolded character of tau and its aggregation to Alzheimer-like paired helical filaments. Biochemistry 47, 10526–10539.10.1021/bi800783dSuche in Google Scholar PubMed
Keays, D.A., Tian, G., Poirier, K., Huang, G.J., Siebold, C., Cleak, J., Oliver, P.L., Fray, M., Harvey, R.J., Molnar, Z., et al. (2007). Mutations in alpha-tubulin cause abnormal neuronal migration in mice and lissencephaly in humans. Cell 128, 45–57.10.1016/j.cell.2006.12.017Suche in Google Scholar PubMed PubMed Central
Kempf, M., Clement, A., Faissner, A., Lee, G., and Brandt, R. (1996). Tau binds to the distal axon early in development of polarity in a microtubule- and microfilament-dependent manner. J. Neurosci. 16, 5583–5592.10.1523/JNEUROSCI.16-18-05583.1996Suche in Google Scholar
Krauss, B.R., Serog, B.J., Chialvo, D.R., and Apkarian, A.V. (1994). Dendritic complexity and the evolution of cerebellar Purkinje cells. Fractals 02, 95–102.10.1142/S0218348X94000089Suche in Google Scholar
Kuraku, S. and Kuratani, S. (2006). Time scale for cyclostome evolution inferred with a phylogenetic diagnosis of hagfish and lamprey cDNA sequences. Zool. Sci. 23, 1053–1064.10.2108/zsj.23.1053Suche in Google Scholar PubMed
Kwei, S.L., Clement, A., Faissner, A., and Brandt, R. (1998). Differential interactions of MAP2, tau and MAP5 during axogenesis in culture. Neuroreport 9, 1035–1040.10.1097/00001756-199804200-00015Suche in Google Scholar PubMed
Lacroix, B., Van Dijk, J., Gold, N.D., Guizetti, J., Aldrian-Herrada, G., Rogowski, K., Gerlich, D.W., and Janke, C. (2010). Tubulin polyglutamylation stimulates spastin-mediated microtubule severing. J. Cell Biol. 189, 945–954.10.1083/jcb.201001024Suche in Google Scholar PubMed PubMed Central
Langridge, T.D., Tarver, M.J., and Whitten, S.T. (2014). Temperature effects on the hydrodynamic radius of the intrinsically disordered N-terminal region of the p53 protein. Proteins 82, 668–678.10.1002/prot.24449Suche in Google Scholar PubMed
Leger, J.G., Brandt, R., and Lee, G. (1994). Identification of tau protein regions required for process formation in PC12 cells. J. Cell Sci. 107, 3403–3412.10.1242/jcs.107.12.3403Suche in Google Scholar PubMed
Leger, J., Kempf, M., Lee, G., and Brandt, R. (1997). Conversion of serine to aspartate imitates phosphorylation-induced changes in the structure and function of microtubule-associated protein tau. J. Biol. Chem. 272, 8441–8446.10.1074/jbc.272.13.8441Suche in Google Scholar PubMed
Leipzig, J., Pevzner, P., and Heber, S. (2004). The Alternative Splicing Gallery (ASG): bridging the gap between genome and transcriptome. Nucleic Acids Res. 32, 3977–3983.10.1093/nar/gkh731Suche in Google Scholar PubMed PubMed Central
Letunic, I. and Bork, P. (2016). Interactive tree of life (iTOL) v3: an online tool for the display and annotation of phylogenetic and other trees. Nucleic Acids Res. 44, W242–245.10.1093/nar/gkw290Suche in Google Scholar PubMed PubMed Central
Martel, G., Uchida, S., Hevi, C., Chevere-Torres, I., Fuentes, I., Park, Y.J., Hafeez, H., Yamagata, H., Watanabe, Y., and Shumyatsky, G.P. (2016). Genetic demonstration of a role for stathmin in adult hippocampal neurogenesis, spinogenesis, and NMDA receptor-dependent memory. J. Neurosci. 36, 1185–1202.10.1523/JNEUROSCI.4541-14.2016Suche in Google Scholar PubMed PubMed Central
McKean, P.G., Vaughan, S., and Gull, K. (2001). The extended tubulin superfamily. J. Cell Sci. 114, 2723–2733.10.1242/jcs.114.15.2723Suche in Google Scholar PubMed
Merriam, E.B., Lumbard, D.C., Viesselmann, C., Ballweg, J., Stevenson, M., Pietila, L., Hu, X., and Dent, E.W. (2011). Dynamic microtubules promote synaptic NMDA receptor-dependent spine enlargement. PLoS One 6, e27688.10.1371/journal.pone.0027688Suche in Google Scholar
Meszaros, B., Erdos, G., and Dosztanyi, Z. (2018). IUPred2A: context-dependent prediction of protein disorder as a function of redox state and protein binding. Nucleic Acids Res. 46, W329–w337.10.1093/nar/gky384Suche in Google Scholar
Moelbert, S., Emberly, E., and Tang, C. (2004). Correlation between sequence hydrophobicity and surface-exposure pattern of database proteins. Protein Sci. 13, 752–762.10.1110/ps.03431704Suche in Google Scholar
Mohan, H., Verhoog, M.B., Doreswamy, K.K., Eyal, G., Aardse, R., Lodder, B.N., Goriounova, N.A., Asamoah, B., B Brakspear, A.B., Groot, C., et al. (2015). Dendritic and axonal architecture of individual pyramidal neurons across layers of adult human neocortex. Cereb. Cortex 25, 4839–4853.10.1093/cercor/bhv188Suche in Google Scholar
Mukhopadhyay, R. and Hoh, J.H. (2001). AFM force measurements on microtubule-associated proteins: the projection domain exerts a long-range repulsive force. FEBS Lett. 505, 374–378.10.1016/S0014-5793(01)02844-7Suche in Google Scholar
Muotri, A.R. and Gage, F.H. (2006). Generation of neuronal variability and complexity. Nature 441, 1087–1093.10.1038/nature04959Suche in Google Scholar
Murphy, S.M., Urbani, L., and Stearns, T. (1998). The mammalian gamma-tubulin complex contains homologues of the yeast spindle pole body components spc97p and spc98p. J. Cell Biol. 141, 663–674.10.1083/jcb.141.3.663Suche in Google Scholar
Newton, C.N., Wagenbach, M., Ovechkina, Y., Wordeman, L., and Wilson, L. (2004). MCAK, a Kin I kinesin, increases the catastrophe frequency of steady-state HeLa cell microtubules in an ATP-dependent manner in vitro. FEBS Lett. 572, 80–84.10.1016/j.febslet.2004.06.093Suche in Google Scholar
Oakley, B.R. (2000). An abundance of tubulins. Trends Cell Biol. 10, 537–542.10.1016/S0962-8924(00)01857-2Suche in Google Scholar
Ozon, S., Maucuer, A., and Sobel, A. (1997). The stathmin family – molecular and biological characterization of novel mammalian proteins expressed in the nervous system. Eur. J. Biochem. 248, 794–806.10.1111/j.1432-1033.1997.t01-2-00794.xSuche in Google Scholar PubMed
Penazzi, L., Bakota, L., and Brandt, R. (2016). Microtubule dynamics in neuronal development, plasticity, and neurodegeneration. Int. Rev. Cell Mol. Biol. 321, 89–169.10.1016/bs.ircmb.2015.09.004Suche in Google Scholar PubMed
Poirier, K., Lebrun, N., Broix, L., Tian, G., Saillour, Y., Boscheron, C., Parrini, E., Valence, S., Pierre, B.S., Oger, M., et al. (2013). Mutations in TUBG1, DYNC1H1, KIF5C and KIF2A cause malformations of cortical development and microcephaly. Nat. Genet. 45, 639–647.10.1038/ng.2613Suche in Google Scholar PubMed PubMed Central
Qiang, L., Yu, W., Andreadis, A., Luo, M., and Baas, P.W. (2006). Tau protects microtubules in the axon from severing by katanin. J. Neurosci. 26, 3120–3129.10.1523/JNEUROSCI.5392-05.2006Suche in Google Scholar PubMed PubMed Central
Rakic, P. (2009). Evolution of the neocortex: a perspective from developmental biology. Nat. Rev. Neurosci. 10, 724.10.1038/nrn2719Suche in Google Scholar PubMed PubMed Central
Ramkumar, A., Jong, B.Y., and Ori-McKenney, K.M. (2018). ReMAPping the microtubule landscape: How phosphorylation dictates the activities of microtubule-associated proteins. Dev. Dynam. 247, 138–155.10.1002/dvdy.24599Suche in Google Scholar PubMed PubMed Central
Riano, E., Martignoni, M., Mancuso, G., Cartelli, D., Crippa, F., Toldo, I., Siciliano, G., Di Bella, D., Taroni, F., Bassi, M.T., et al. (2009). Pleiotropic effects of spastin on neurite growth depending on expression levels. J. Neurochem. 108, 1277–1288.10.1111/j.1471-4159.2009.05875.xSuche in Google Scholar PubMed
Roll-Mecak, A. and McNally, F.J. (2010). Microtubule-severing enzymes. Curr. Opin. Cell Biol. 22, 96–103.10.1016/j.ceb.2009.11.001Suche in Google Scholar PubMed PubMed Central
Schob, C., Morellini, F., Ohana, O., Bakota, L., Hrynchak, M.V., Brandt, R., Brockmann, M.D., Cichon, N., Hartung, H., Hanganu-Opatz, I.L., et al. (2019). Cognitive impairment and autistic-like behaviour in SAPAP4-deficient mice. Transl. Psychiatry 9, 7.10.1038/s41398-018-0327-zSuche in Google Scholar PubMed PubMed Central
Sharma, R., Raicar, G., Tsunoda, T., Patil, A., and Sharma, A. (2018). OPAL: prediction of MoRF regions in intrinsically disordered protein sequences. Bioinformatics 34, 1850–1858.10.1093/bioinformatics/bty032Suche in Google Scholar PubMed
Sharp, D.J. and Ross, J.L. (2012). Microtubule-severing enzymes at the cutting edge. J. Cell Sci. 125, 2561–2569.10.1242/jcs.101139Suche in Google Scholar PubMed PubMed Central
Sharp, D.J., Yu, W., and Baas, P.W. (1995). Transport of dendritic microtubules establishes their nonuniform polarity orientation. J. Cell Biol. 130, 93–103.10.1083/jcb.130.1.93Suche in Google Scholar
Shi, S.H., Jan, L.Y., and Jan, Y.N. (2003). Hippocampal neuronal polarity specified by spatially localized mPar3/mPar6 and PI 3-kinase activity. Cell 112, 63–75.10.1016/S0092-8674(02)01249-7Suche in Google Scholar
Shimoyama, M., De Pons, J., Hayman, G.T., Laulederkind, S.J., Liu, W., Nigam, R., Petri, V., Smith, J.R., Tutaj, M., Wang, S.J., et al. (2015). The Rat Genome Database 2015: genomic, phenotypic and environmental variations and disease. Nucleic Acids Res. 43, D743–750.10.1093/nar/gku1026Suche in Google Scholar PubMed PubMed Central
Simons, C., Wolf, N.I., McNeil, N., Caldovic, L., Devaney, J.M., Takanohashi, A., Crawford, J., Ru, K., Grimmond, S.M., Miller, D., et al. (2013). A de novo mutation in the β-tubulin gene TUBB4A results in the leukoencephalopathy hypomyelination with atrophy of the basal ganglia and cerebellum. Am. J. Hum. Genet. 92, 767–773.10.1016/j.ajhg.2013.03.018Suche in Google Scholar PubMed PubMed Central
Smith, L.M., Kelleher, N.L., Consortium for Top Down Proteomics (2013). Proteoform: a single term describing protein complexity. Nat. Methods 10, 186–187.10.1038/nmeth.2369Suche in Google Scholar PubMed PubMed Central
Smith, B.N., Ticozzi, N., Fallini, C., Gkazi, A.S., Topp, S., Kenna, K.P., Scotter, E.L., Kost, J., Keagle, P., Miller, J.W., et al. (2014). Exome-wide rare variant analysis identifies TUBA4A mutations associated with familial ALS. Neuron 84, 324–331.10.1016/j.neuron.2014.09.027Suche in Google Scholar PubMed PubMed Central
Smith, C.L., Blake, J.A., Kadin, J.A., Richardson, J.E., and Bult, C.J. (2018). Mouse Genome Database (MGD)-2018: knowledgebase for the laboratory mouse. Nucleic Acids Res. 46, D836–D842.10.1093/nar/gkx1006Suche in Google Scholar PubMed PubMed Central
Spruston, N. (2008). Pyramidal neurons: dendritic structure and synaptic integration. Nat. Rev. Neurosci. 9, 206–221.10.1038/nrn2286Suche in Google Scholar PubMed
Stelzer, G., Rosen, N., Plaschkes, I., Zimmerman, S., Twik, M., Fishilevich, S., Stein, T.I., Nudel, R., Lieder, I., Mazor, Y., et al. (2016). The genecards suite: from gene data mining to disease genome sequence analyses. Curr. Protoc. Bioinformatics 54, 1.30.31–31.30.33.10.1002/cpbi.5Suche in Google Scholar PubMed
Sundermann, F., Fernandez, M.P., and Morgan, R.O. (2016). An evolutionary roadmap to the microtubule-associated protein MAP Tau. BMC Genomics 17, 264.10.1186/s12864-016-2590-9Suche in Google Scholar PubMed PubMed Central
Svenson, I.K., Kloos, M.T., Jacon, A., Gallione, C., Horton, A.C., Pericak-Vance, M.A., Ehlers, M.D., and Marchuk, D.A. (2005). Subcellular localization of spastin: implications for the pathogenesis of hereditary spastic paraplegia. Neurogenetics 6, 135–141.10.1007/s10048-005-0219-2Suche in Google Scholar
Szebenyi, G., Bollati, F., Bisbal, M., Sheridan, S., Faas, L., Wray, R., Haferkamp, S., Nguyen, S., Caceres, A., and Brady, S.T. (2005). Activity-driven dendritic remodeling requires microtubule-associated protein 1A. Curr. Biol. 15, 1820–1826.10.1016/j.cub.2005.08.069Suche in Google Scholar
Tackenberg, C., Ghori, A., and Brandt, R. (2009). Thin, stubby or mushroom: spine pathology in Alzheimer’s disease. Curr. Alzheimer Res. 6, 261–268.10.2174/9781608058525114020015Suche in Google Scholar
Takeda, T., Ishikawa, A., Ohtomo, K., Kobayashi, Y., and Matsuoka, T. (1992). Fractal dimension of dendritic tree of cerebellar Purkinje cell during onto- and phylogenetic development. Neurosci Res. 13, 19–31.10.1016/0168-0102(92)90031-7Suche in Google Scholar
Teng, J., Takei, Y., Harada, A., Nakata, T., Chen, J., and Hirokawa, N. (2001). Synergistic effects of MAP2 and MAP1B knockout in neuronal migration, dendritic outgrowth, and microtubule organization. J. Cell Biol. 155, 65–76.10.1083/jcb.200106025Suche in Google Scholar PubMed PubMed Central
Tischfield, M.A., Baris, H.N., Wu, C., Rudolph, G., Van Maldergem, L., He, W., Chan, W.M., Andrews, C., Demer, J.L., Robertson, R.L., et al. (2010). Human TUBB3 mutations perturb microtubule dynamics, kinesin interactions, and axon guidance. Cell 140, 74–87.10.1016/j.cell.2009.12.011Suche in Google Scholar PubMed PubMed Central
Toba, S., Jin, M., Yamada, M., Kumamoto, K., Matsumoto, S., Yasunaga, T., Fukunaga, Y., Miyazawa, A., Fujita, S., Itoh, K., et al. (2017). Alpha-synuclein facilitates to form short unconventional microtubules that have a unique function in the axonal transport. Sci. Rep. 7, 16386.10.1038/s41598-017-15575-3Suche in Google Scholar PubMed PubMed Central
Tortosa, E., Adolfs, Y., Fukata, M., Pasterkamp, R.J., Kapitein, L.C., and Hoogenraad, C.C. (2017). Dynamic palmitoylation targets MAP6 to the axon to promote microtubule stabilization during neuronal polarization. Neuron 94, 809–825 e807.10.1016/j.neuron.2017.04.042Suche in Google Scholar PubMed
Tyrrell, T. and Willshaw, D. (1992). Cerebellar cortex: its simulation and the relevance of Marr’s theory. Philos. Trans. R. Soc. Lond. B Biol. Sci. 336, 239–257.10.1098/rstb.1992.0059Suche in Google Scholar PubMed
Uchida, S. and Shumyatsky, G.P. (2015). Deceivingly dynamic: Learning-dependent changes in stathmin and microtubules. Neurobiol. Learn. Mem. 124, 52–61.10.1016/j.nlm.2015.07.011Suche in Google Scholar PubMed PubMed Central
Uversky, V.N. (2009). Intrinsically disordered proteins and their environment: effects of strong denaturants, temperature, pH, counter ions, membranes, binding partners, osmolytes, and macromolecular crowding. Protein J. 28, 305–325.10.1007/s10930-009-9201-4Suche in Google Scholar
Uversky, V.N. (2015). Intrinsically disordered proteins and their (disordered) proteomes in neurodegenerative disorders. Front. Aging Neurosci. 7, 18.10.3389/fnagi.2015.00018Suche in Google Scholar
Uversky, V.N. (2016). p53 proteoforms and intrinsic disorder: an illustration of the protein structure-function continuum concept. Int. J. Mol. Sci. 17, 1874.10.3390/ijms17111874Suche in Google Scholar
Uversky, V.N., Gillespie, J.R., and Fink, A.L. (2000). Why are “natively unfolded” proteins unstructured under physiologic conditions? Proteins 41, 415–427.10.1002/1097-0134(20001115)41:3<415::AID-PROT130>3.0.CO;2-7Suche in Google Scholar
Vaillant, A.R., Zanassi, P., Walsh, G.S., Aumont, A., Alonso, A., and Miller, F.D. (2002). Signaling mechanisms underlying reversible, activity-dependent dendrite formation. Neuron 34, 985–998.10.1016/S0896-6273(02)00717-1Suche in Google Scholar
van der Lee, R., Buljan, M., Lang, B., Weatheritt, R.J., Daughdrill, G.W., Dunker, A.K., Fuxreiter, M., Gough, J., Gsponer, J., Jones, D.T., et al. (2014). Classification of intrinsically disordered regions and proteins. Chem. Rev. 114, 6589–6631.10.1021/cr400525mSuche in Google Scholar
Wang, L. and Brown, A. (2002). Rapid movement of microtubules in axons. Curr. Biol. 12, 1496–1501.10.1016/S0960-9822(02)01078-3Suche in Google Scholar
Wang, D.Z., Vize, P.D., Chu, S., Pells, T.J., Lotay, V.S., Wang, Y., Karimi, K., Zorn, A.M., James-Zorn, C., Fortriede, J.D., et al. (2017). Xenbase: a genomic, epigenomic and transcriptomic model organism database. Nucleic Acids Res. 46, D861–D868.10.1093/nar/gkx936Suche in Google Scholar
Witte, H., Neukirchen, D., and Bradke, F. (2008). Microtubule stabilization specifies initial neuronal polarization. J. Cell Biol. 180, 619–632.10.1083/jcb.200707042Suche in Google Scholar
Yu, W. and Baas, P.W. (1994). Changes in microtubule number and length during axon differentiation. J. Neurosci. 14, 2818–2829.10.1523/JNEUROSCI.14-05-02818.1994Suche in Google Scholar
Yu, D., Cook, M.C., Shin, D.M., Silva, D.G., Marshall, J., Toellner, K.M., Havran, W.L., Caroni, P., Cooke, M.P., Morse, H.C., et al. (2008). Axon growth and guidance genes identify T-dependent germinal centre B cells. Immunol. Cell Biol. 86, 3–14.10.1038/sj.icb.7100123Suche in Google Scholar
Yuste, R. (2010). Dendritic spines (Cambridge, MA: MIT Press).10.7551/mitpress/9780262013505.001.0001Suche in Google Scholar
Zerbino, D.R., Achuthan, P., Akanni, W., Amode, M.R., Barrell, D., Bhai, J., Billis, K., Cummins, C., Gall, A., Giron, C.G., et al. (2018). Ensembl 2018. Nucleic Acids Res. 46, D754–D761.10.1093/nar/gkx1098Suche in Google Scholar
Zilles, K. (1992). Neuronal plasticity as an adaptive property of the central nervous system. Ann. Anat. 174, 383–391.10.1016/S0940-9602(11)80255-4Suche in Google Scholar
Supplementary Material
The online version of this article offers supplementary material (https://doi.org/10.1515/hsz-2019-0149).
©2019 Nataliya I. Trushina et al., published by De Gruyter, Berlin/Boston
This work is licensed under the Creative Commons Attribution-NonCommercial-NoDerivatives 4.0 License.
Artikel in diesem Heft
- Frontmatter
- Highlight: dynamics of the nervous system in health and disease
- Actin(g) on mitochondria – a role for cofilin1 in neuronal cell death pathways
- Neuronal microtubules and proteins linked to Parkinson’s disease: a relevant interaction?
- Contribution of astrocytes to metabolic dysfunction in the Alzheimer’s disease brain
- Chemical LTD, but not LTP, induces transient accumulation of gelsolin in dendritic spines
- Sub-membranous actin rings in the axon initial segment are resistant to the action of latrunculin
- The role of GFAP and vimentin in learning and memory
- Vimentin is required for normal accumulation of body fat
- The microtubule skeleton and the evolution of neuronal complexity in vertebrates
- Amyloidosis causes downregulation of SorLA, SorCS1 and SorCS3 expression in mice
- A fluorescent protein-readout for transcriptional activity reveals regulation of APP nuclear signaling by phosphorylation sites
- Kavalactones from Kava (Piper methysticum) root extract as modulators of recombinant human glycine receptors
- Research Articles/Short Communications
- Cell Biology and Signaling
- LncRNA HOTAIR targets miR-126-5p to promote the progression of Parkinson’s disease through RAB3IP
- Novel Techniques
- In vitro import experiments with semi-intact cells suggest a role of the Sec61 paralog Ssh1 in mitochondrial biogenesis
- Corrigendum
- Corrigendum to: SIAH1/ZEB1/IL-6 axis is involved in doxorubicin (Dox) resistance of osteosarcoma cells