Three-dimensional grain angle measurement of softwood (Hinoki cypress) using near infrared spatially and spectrally resolved imaging (NIR-SSRI)
-
Te Ma


Abstract
As the strength of wood is greatly affected by its three-dimensional (3D) grain angles (the dive angle and the surface angle), the wood industry today requires automatic, rapid, and robust measurement techniques for measuring them simultaneously. In the present study, a near infrared spatially and spectrally resolved imaging (NIR-SSRI) system was designed in a line scan model, mainly including an NIR hyperspectral imaging camera and a halogen spotlight source (Ø 1 mm). Spatially resolved diffuse reflectance images at three target wavelengths (1002 nm, 1217 nm, and 1413 nm) were obtained from Hinoki cypress [Chamaecyparis obtusa (Siebold & Zucc.) Endl.] samples at various (0°, 3°, 6°, … 45°) dive angles and surface angles (0°, 3°, 6°, … 45°). The scattering patterns caused by the “tracheid effect” were almost elliptical. Subsequently, nonlinear least squares fitting was used to determine their eccentricities (e) and rotation angles (θ). The e values at each selected wavelength were highly correlated with the dive angle reference values; and the global identification model developed using Gaussian process regression (GPR) under five-fold cross-validation (CV) reached a determination coefficient (r2) of 0.98 with a root mean square error (RMSE) of 2.2°. On the other hand, local surface angle identification models developed using linear regression analysis achieved determination coefficients higher than 0.90 on r2 and an RMSE of CV lower than 3.8° when the dive angle was lower than 30°.
Introduction
When wood logs with distinct growth rings and/or spiral grain are sawn, the lumber formed have three-dimensional (3D) grain directions that are defined by their angles within and into the plane of the measured surface, which are, respectively, referred to as surface and dive angles. Grain direction influences almost all the mechanical properties of wood, including strength, elasticity, and toughness (Simonaho et al. 2004). A previous study reported a decrease in wood lumber strength whenever the slope to the board length was greater than 1 in 20. For example, if the slope is 1 in 8, the strength reduction in bending and compression parallel to the grain would be 47% and 34%, respectively (Haygreen and Bowyer 1989). Therefore, grain angle measurement is critical for wood quality control, particularly for strength grading in sawmills (Schajer and Sutton 2016). Conventionally, the identification of wood grain angle is achieved by the experts with extensive training in wood histology. In addition, some identification techniques have been developed to facilitate wood grain angle measurements. For example, microwaves (Schajer and Orhan 2006) can measure wood density and moisture content simultaneously. Other techniques that could be used to evaluate the grain orientation of wood include X-ray diffractometry, which requires delicate sample preparation (Buksnowitz et al. 2008), and near infrared (NIR) spectroscopy analysis (Tsuchikawa and Tsutsumi 1997; Gindl and Teischinger 2002). It is thought that there are numerous overtone and combination bands of vibrational frequencies due to functional groups, such as C-H, O-H, and N-H, in the 800–2500 nm wavelength range. Although the overlapping NIR bands appear non-specific and poorly resolved, they could be effectively evaluated using multivariate calibration algorithms and statistical methods (chemometrics) such as principal component regression and partial least squares regression analyses (Martens and Naes 1989). However, conventional NIR spectroscopy approaches can only describe the aggregate effects of light absorption and scattering (Qin and Lu 2008). As light scattering is more prominent in wood compared to light absorption, an understanding of the light scattering differences is required to develop a more robust wood property prediction model without relying on substantial explanatory variables.
Some studies have employed visible light (single wavelength laser) scattering pattern differences caused by the “tracheid effect” to measure wood grain angle (Zhou and Shen 2003; Hu et al. 2004; Simonaho et al. 2004). The techniques are based on the fact that softwood is composed of numerous tubular cells called tracheids at the microscopic scale, and their direction determines the spatial grain direction of wood tissue (Simonaho et al. 2004). When a wood surface is illuminated by a concentrated light source such as a laser, a fraction of the light will be reflected directly at the surface, while some of the light could penetrate the surface and be scattered within the material (Nyström, 2003). As there is a high refractive index mismatch between wood cell wall substances (n=1.55) and cell lumen (air=1.0, water=1.33), multiple reflections of light on the repetitive wood cell wall substance-air boundary result in the conduction of an illuminated spotlight by the fiber layers (Kitamura et al. 2016). In addition, light propagated across wood cell walls is attenuated more than that propagated through cell lumen (Ma et al. 2018), so the light propagated across wood cell walls eventually form elliptical shapes in the longitudinal direction of the fibers. However, a key limitation of the “tracheid effect” method is that it has the capacity to measure only the surface angle. Although laser light scattering patterns from wood grain have been used to infer dive angle (Simonaho et al. 2004), the measurement resolution remains low. Here, we investigate if the measurement accuracy of dive angle could be enhanced if the light scattering (physical structure) and light absorption (chemical component) properties of wood are evaluated together. Therefore, instead of employing single visible light wavelength scattering information, multi-wavelengths on the NIR range, which exhibit greater light absorption by wood chemicals than visible light, were used. Another recent study based on laser light directional reflection measurement (specular component) revealed that at higher dive angles, the accuracy of surface angle determination deteriorates, with errors of up to 10° for 10° dive angles (Schajer and Sutton 2016), which indicates that light scattering patterns on the wood surface would shift from an elliptical to a circular shape in our method (in extreme cases, the scattering patterns would be reduced to an almost perfect circular shape when the grain direction is perpendicular to the surface plane). How various dive angles influence wood surface angle prediction models based on elliptical shapes (e.g. major axis, minor axis) requires investigation.
The aim of the present study was to evaluate spatially and spectrally resolved imaging (NIR-SSRI) in identifying softwood dive angles and surface angles simultaneously with a high prediction accuracy. An NIR imaging (hyperspectral) camera with a focused halogen light source (Ø 1 mm) in line-scanning mode was applied to acquire three fundamental wavelengths (1002 nm: mainly light scattering, 1217 nm: second OT C-H str., and 1413 nm: first OT O-H str.; Schwanninger et al. 2011) and spatially resolved reflectance images of softwood samples at various dive and surface angles. Subsequently, the scattering pattern differences between them were examined for application in softwood 3D grain angle prediction. It was expected that the effective utilization of both light scattering and light absorption properties in wood samples would facilitate the identification of dive angle patterns from 0° to 45°, with 3° intervals, and confirm that higher dive angles would influence the prediction of surface angles based on softwood “tracheid effect” methods.
Materials and methods
Preparation of wood samples with various dive angles
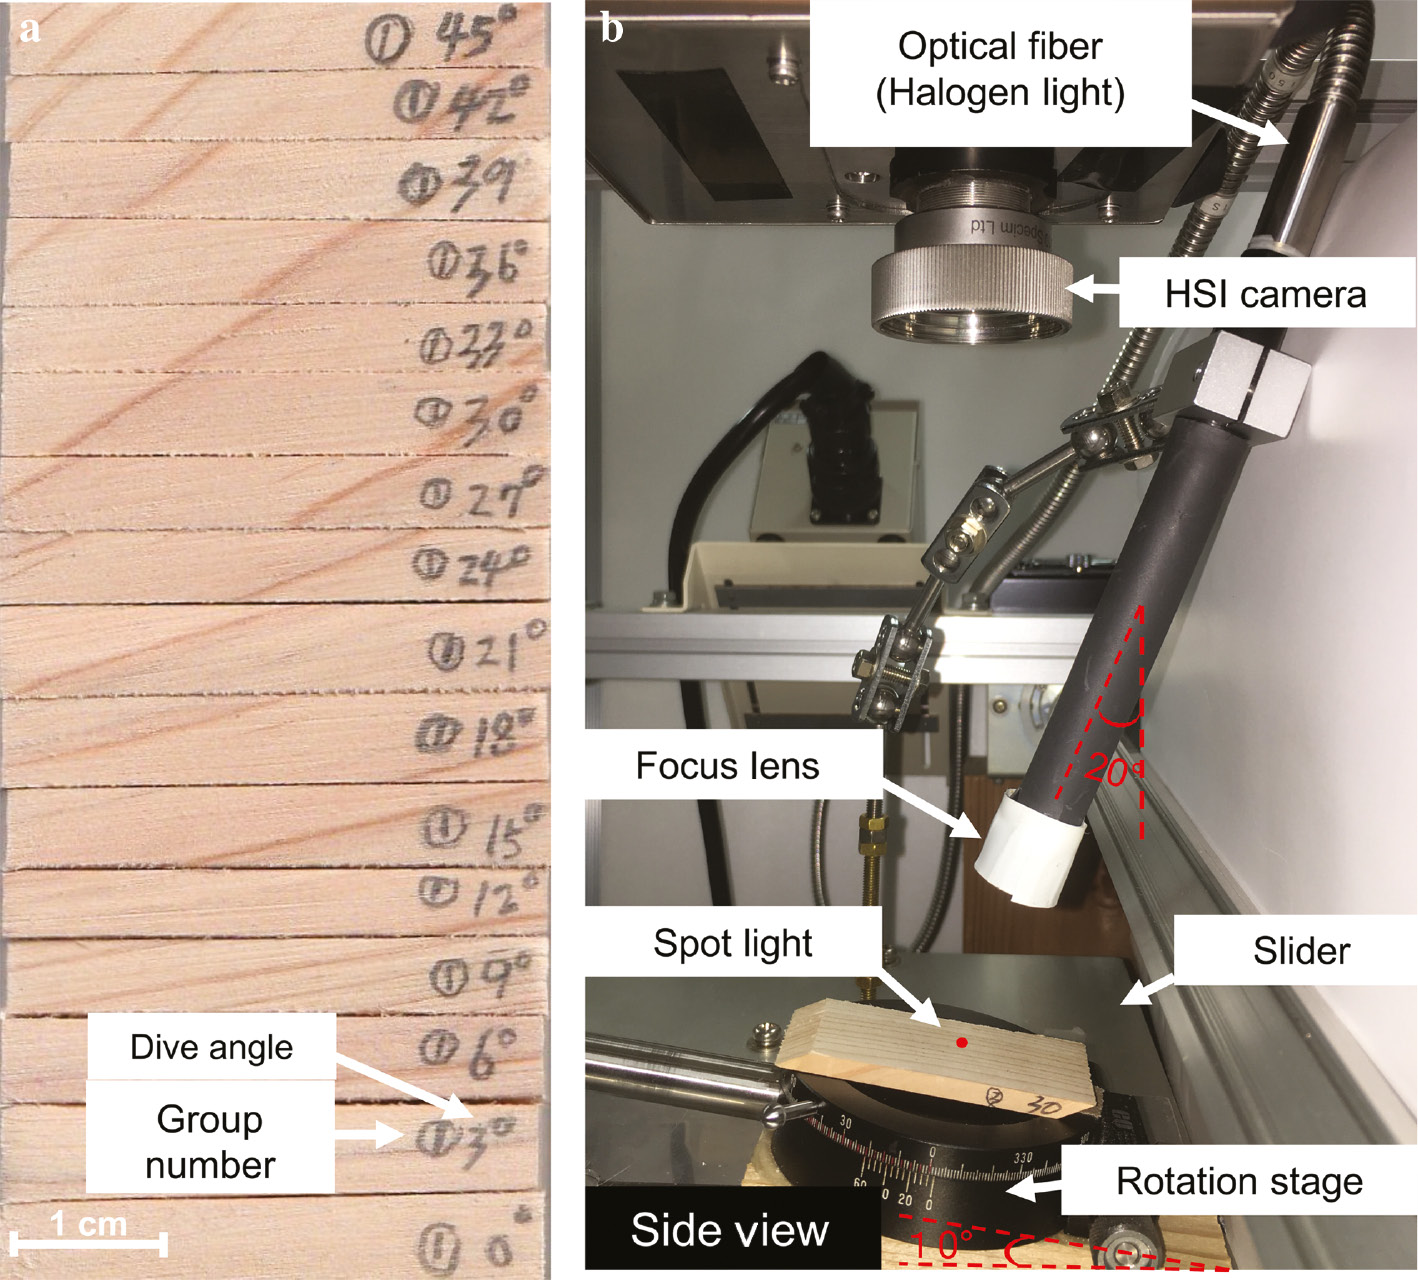
Three pieces of rectangular Hinoki cypress [Chamaecyparis obtusa (Siebold & Zucc.) Endl.] commercial timber were purchased from a local wood processing company. The samples were selected based on the directions of the wood fiber, which were as parallel as possible to the longitudinal direction. After air-drying, 16 wood samples with a dive angle ranging from 0° to 45° at 3° intervals (Figure 1a) were cut from each rectangular piece of timber. The sample dimensions were approximately 5 mm (tangential)×30 mm (radial).
Each wood sample at specific dive angle was fixed on a slide. The same early-wood section was scanned in a push-broom manner for sixteen times with rotating the sample to obtain varying surface grain angles (0°, 3°, ...45°).
(a) Sixteen Hinoki cypress samples cut from each rectangular piece timber with dive angles ranging from 0° to 45°, with 3° intervals. (b) A near infrared spatially and spectrally resolved imaging system, mainly including an NIR hyperspectral imaging camera and a focused halogen lamp source (Ø 1 mm).
Near infrared spatially and spectrally resolved imaging (NIR-SSRI)
An NIR (hyperspectral) imaging camera (Compovision, Sumitomo Electric Industries, Ltd., Osaka, Japan) having a spectroscope and two-dimensional indium gallium arsenide (InGaAs) detectors [256 pixels (spectral information)×320 pixels (spatial information)], which can detect NIR light in the 913–2519 nm range, at a spectral interval of approximately 6.2 nm was used. The NIR imaging camera was used to collect data from targeted wavelengths for different research applications. In the present study, three fundamental wavelengths (1002 nm, 1217 nm, and 1413 nm) were selected for data collection and analysis. The distance between the target and the camera was manually adjusted to achieve a horizontal field of view of 45 mm with spatial intervals of 140.6 μm. The NIR-hyperspectral imaging (HSI) system was operated on a vertical plane with the specimen directly below. A concentrated point light source, derived from a halogen lamp focused to a Ø 1-mm spot, was set up on one side of the imaging lens 20° from the vertical plane. Therefore, to appropriately capture the reflected light, the samples were adjusted to a 10° slope from the horizontal plane. Each sample and the light source were fixed on a slide and scanned for light scattering area line-by-line in a push-broom manner (Figure 1b). The frame rate was set to 250 frames/s. Sixteen scans of the same early-wood section at various surface grain angles (0°,3°, … 45°) were carried out for each sample at different dive angles (0°,3°, … 45°). The assessed surfaces were set in a tangential direction, which would facilitate the direct determination of dive angles. The samples were then rotated to obtain varying surface grain angles. A white plate was imaged under the same conditions for reference while a dark image was obtained by turning off the light source and completely covering the lens with its cap. Light illumination center values were copied for matching with data from samples obtained from similar areas. Finally, relative reflectance values were converted based on Equation (1):
where λ and n denote the wavelength and pixel index variables, respectively, and Rλ,n is the standardized light reflectance value at wavelength λ and pixel n. Sλ,n and Bλ,n denote sample and white reference images, and Dλ,n stands for dark image.
The theory of softwood 3D grain angle prediction based on light scattering patterns (the tracheid effect)
The nonlinear least squares ellipse fitting method was used for image data pretreatment. Subsequently, the shape (eccentricity) and the rotation angles of new elliptical forms were used to predict sample dive angle and surface angle, respectively.
Briefly, the standard form equation of an ellipse is as follows:
where parameter b is called the semi-minor axis, which is analogous to parameter a, which is called the semi-major axis (assuming b<a). In general, an ellipse can be centered at any point, or have an axis not parallel to the coordinate axis. Assuming the translation is (X0, Y0) and the rotation angle is θ, the new ellipse can be explained as follows (Agin 1981):
Expansion of Eq (3):
Simplifying Eq (4):
with B2–4AC≤0, then reducing one parameter of Eq (5):
To find the optimal fitting parameters G, H, I, J, K by solving nonlinear least squares curving fitting problems (minimizing the sum of the squares of Eq. [6]) on a given data set (Xi, Yi)
Calculating ellipse rotation angle θ (wood surface grain angle in the present study), translation (X0, Y0), and two axes (a, b) using G, H, I, J, K values and Eq (4)
Finally, eccentricity (e) values were calculated using values in the two axes (a, b):
where parameter a is the semi-major axis, and b is the semi-minor axis (b<a).
Eccentricity (e) is a parameter that indicates how much the conic section deviates from being circular. The eccentricity of a circle is 0, while an eccentricity greater than 0 but less than 1 is that of an ellipse.
Dive angle prediction model construction based on three-wavelength light scattering patterns (eccentricity)
Gaussian process regression (GPR) is a powerful nonparametric regression tool, which can conveniently be used for Bayesian supervised learning, such as regression and classification (Rasmussen and Williams 2005). Exponential GPR analysis (basis function: constant, kernel function: exponential, use isotropic kernel: true, kernel scale and kernel sigma: automatic, standardize and optimize numeric parameters: true) combined with five-fold cross-validation (CV) (the original sample is randomly partitioned into five equal-sized subsamples, four subsamples for training a classification model and a single subsample for testing the model. The CV process is repeated 5 times) was used to evaluate the dive angle prediction accuracy based on the three-wavelength light scattering patterns (eccentricity).
Surface angle prediction model construction based on ellipse rotation angle and changes in the sum of raw ellipse pixel numbers at each y-axis and x-axis
In the present study, the calculated ellipse rotation angle (Equation 8) and the sum of the values of raw ellipse shape area (pixel numbers) in the y-axis and x-axis were combined to derive wood surface local (at each dive angle) prediction angles (a calculated ellipse rotation angle is based on fitted ellipse edge information, while the sum of the pixel values could provide information on the inner parts of the raw image data). Combining such data is expected to achieve surface angle prediction with greater accuracy and stability. Principal component analysis (Martens and Naes 1989) was used to compress the counted pixel numbers in each axis. Susbequently, linear regression analysis was used to develop a wood surface angle prediction model at different dive angles.
where y is the wood surface angle, x1 is the calculated ellipse rotation angle, x2 and x3 are the first principal component (PC1) scores calculated from counting the pixel numbers from the y-axis and x-axis, respectively. A similar five-fold CV procedure was used to evaluate the robustness of the developed models. The statistics and machine learning toolbox 11.2 in MATLAB (Mathworks, Inc., Natick, MA, USA) was used for data analysis.
Results and discussion
Figure 2 illustrates representative images spatially resolved at 1002 nm collected from wood samples at various dive angles (vertical): 0°, 9° 18°, 27°, 36°, 45°, and surface angles (horizontal): 0°, 9° 18°, 27°, 36°, 45°, respectively. The “tracheid effect” resulted in changes in the orientations of the ellipses according to the wood surface grain directions. In addition, at similar surface angles, the ellipses shifted to a circular shape with increase in dive angles. Selecting the best distance from the illumination point to obtain the optimal back-scattered data was necessary as different locations provide different light path lengths and depths into the sample. In the present study, the diffuse reflectance at 0.015 was suitable for the classification of ellipse shape differences as the noise increased markedly under such conditions.

Representative images spatially resolved at 1002 nm collected from the prepared wood samples at various dive angles (vertical) and surface angles (horizontal).
The “tracheid effect” caused the changes in ellipse shapes and their orientation angles.
Figure 3 illustrates the edges of the measured data in Figure 2 (dark dot) and their new ellipse forms (red line) fitted using Equations 3–7. The noise problem in the raw data was addressed to facilitate the accurate determination of ellipse shapes and orientations.
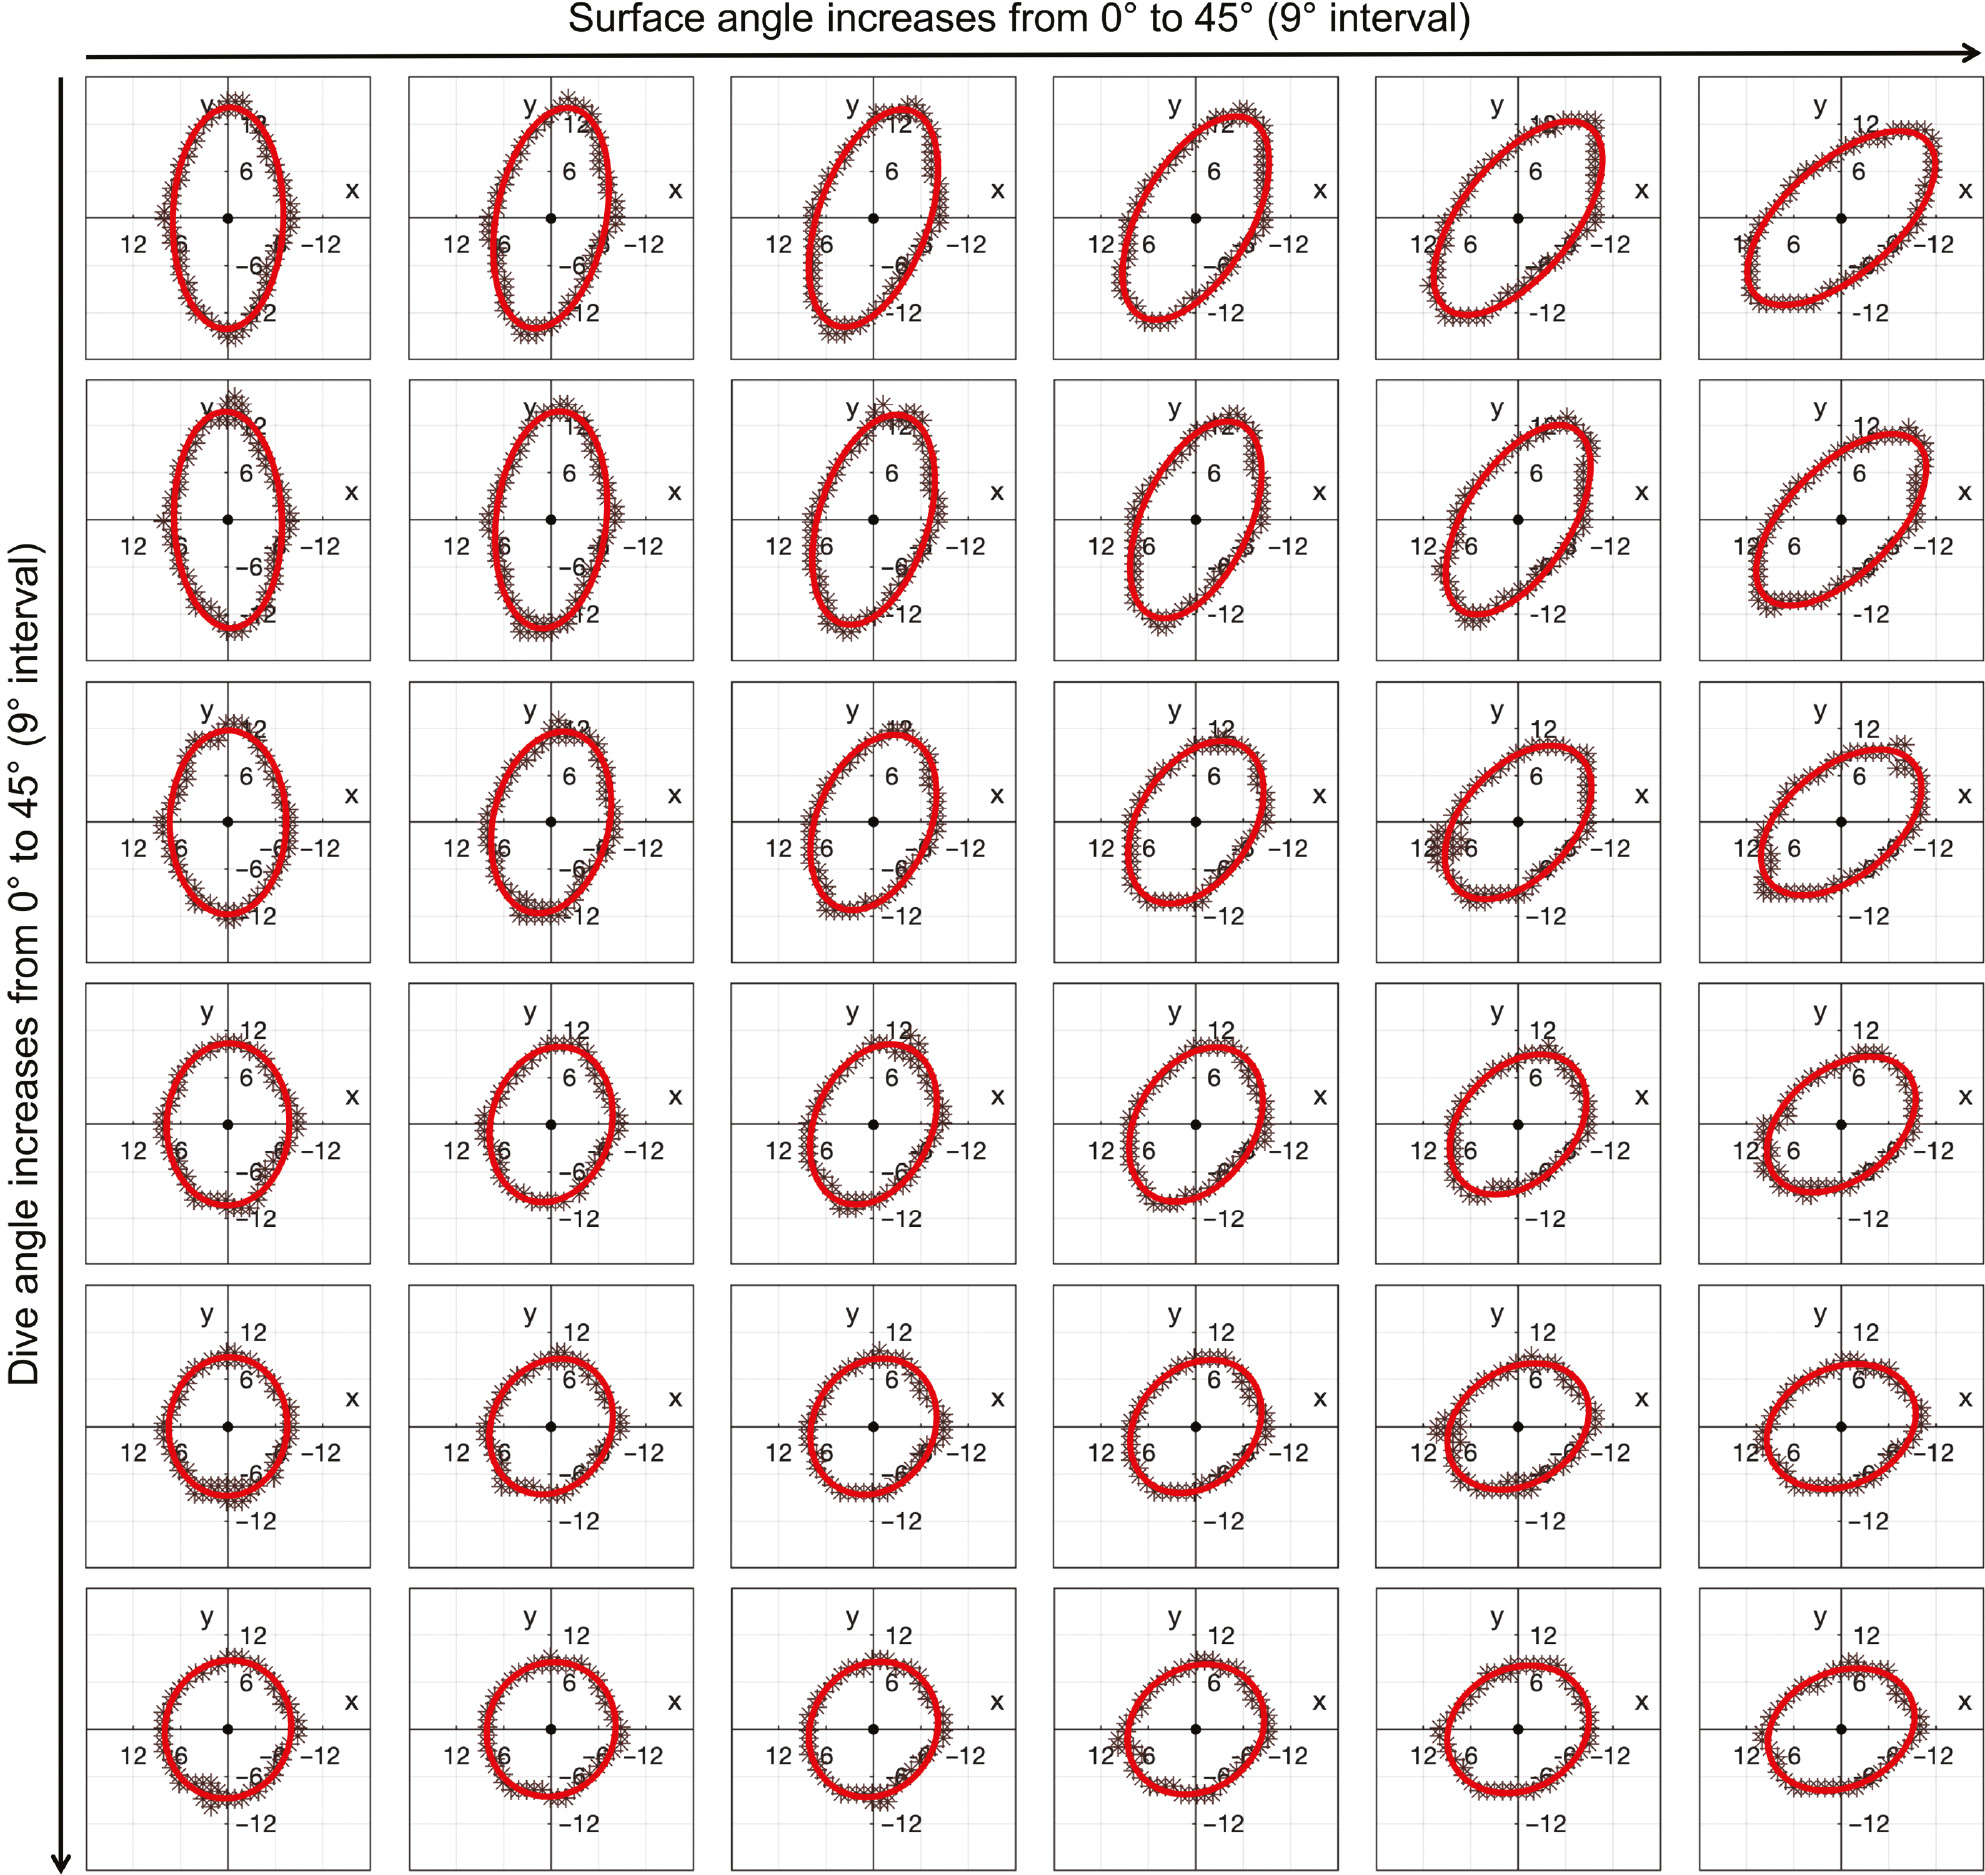
Nonlinear least squares ellipse fitting results of each ellipse edge (diffuse reflectance at 0.015) in Figure 2, which were further used to calculate wood three-dimensional grain angles.
Figure 4 shows that the ellipse shapes were different even at the same dive angles, but at different wavelengths, which is because light scattering is dominant in the 1002–1400 nm wavelength range. Conversely, the effects of light absorption increase after 1400 nm. Therefore, the combined effects of light scattering and light absorption resulted in the differences in light scattering patterns, based on the minimal changes observed at three different wavelengths applied in the present study. Compared with 1002 nm, the pronounced smaller ellipses observed at 1217 nm and 1413 nm were attributed to C-H and O-H group absorptions in wood, respectively.

Nonlinear least squares ellipse fitting results for each ellipse edge (diffuse reflectance at 0.015) in Figure 2, at wavelengths of 1002 nm, 1217 nm, and 1413 nm.
Figure 5 shows the scatter plots between the dive angle reference data and the ellipse eccentricities calculated from spatially resolved images at 1002 nm (light scattering is dominant), 1217 nm (related to C-H absorption), and 1413 nm (related to O-H absorption); although highly correlated, they still require enhancement. Figure 5d shows the scatter plot between the dive angle reference data and the values determined using multiple linear regression analysis of the ellipse eccentricities calculated from the three wavelengths. The accuracy was greater when the local prediction models were developed separately for different surface angles.
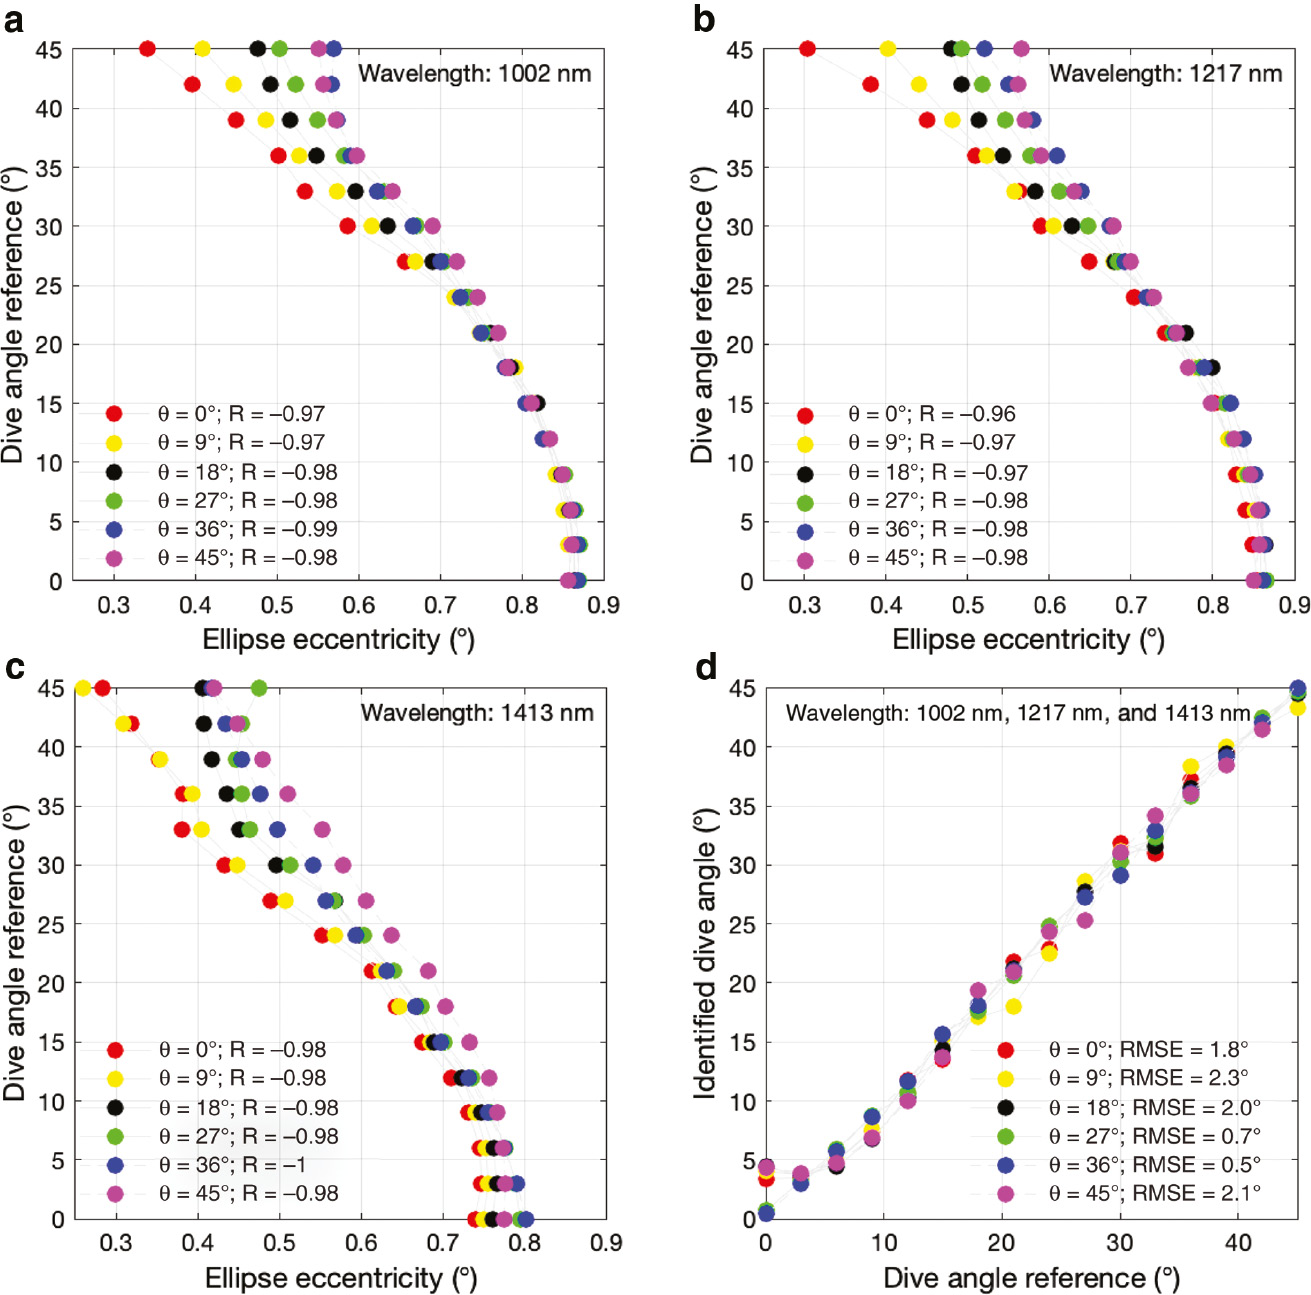
It illustrates the importance of using both light scattering and absorption properties together to achieve a higher dive angle prediction accuracy.
Scatter plots for dive angle reference data at each of the surface angles (θ) and ellipse eccentricities calculated from the spatially resolved images at (a) 1002 nm, (b) 1217 nm, and (c) 1413 nm. The correlation between the dive angle reference data and the values identified using multiple linear regression analysis of the ellipse eccentricities calculated from the three wavelengths is high (d).
Figure 6 is a a line plot with error bars for 768 dive angle reference data values (3 Hinoki cypress rectangular timbers×16 dive angle patterns×16 surface angle patterns) and the angles predicted using GPR. It is notable that compared with the dive angles determined from a similar sample and similar grain angle (Figure 5d), there was an apparent decrease in accuracy, particularly at both low and high dive angles. The decrease could be attributed to the heterogeneous microstructure of wood, which could have influenced dive angle sample preparation in the study, causing minimal changes in the stability of optical light scattering under “similar conditions”. Nevertheless, the global model achieves a determination coefficient (r2) of 0.98 with a root mean square error (RMSE) of 2.18° under five-fold CV, which suggests that the method is still powerful in the identification of softwood dive angle.
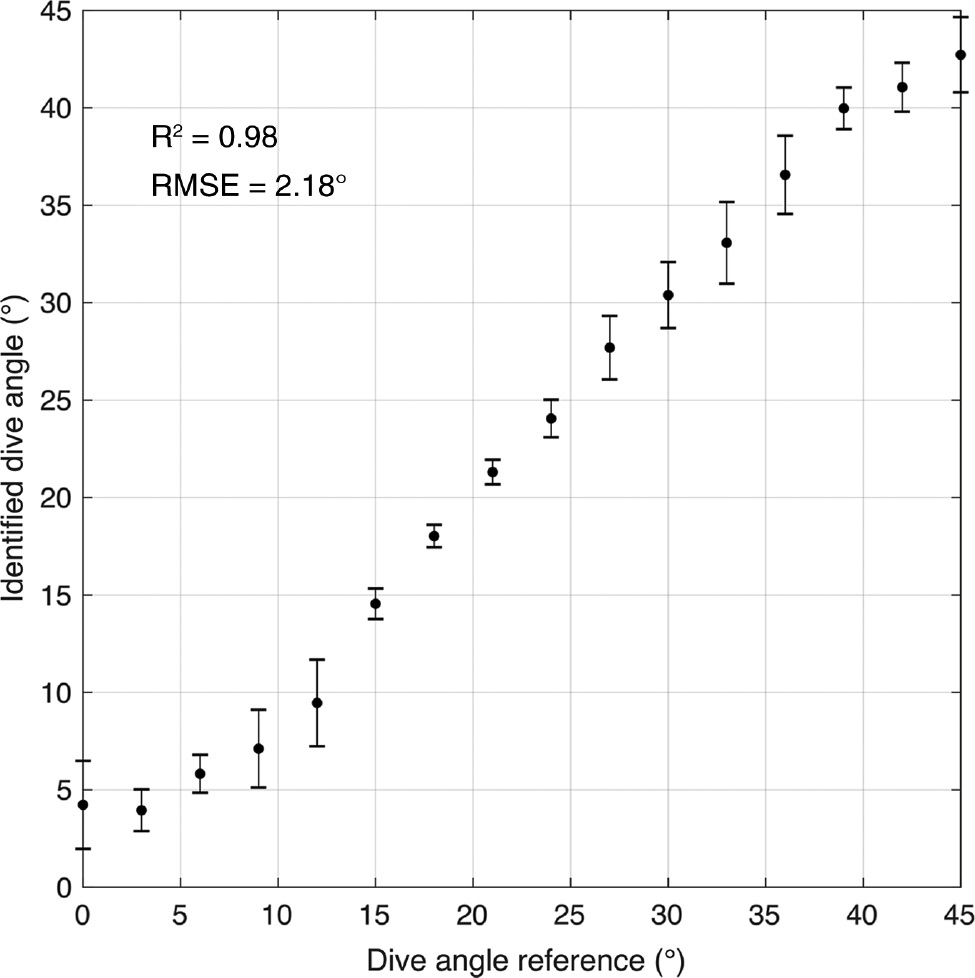
Line plot with error bars of the dive angle reference data at various surface grain angles and angles determined using Gaussian process regression analysis based on the ellipse eccentricities from 1002 nm, 1217 nm, and 1413 nm wavelengths.
Figure 7 presents a scatter plot of the reference surface angle data values and the calculated ellipse rotation angles (can be regarded as the identified surface angles in this case) of a single sample set. The correlation coefficients were higher than 0.93 when the dive angles were lower than 30° (a), and lower than 0.82 following further increases in the dive angle (b). The observation suggests that the dive angle has negative effects on the surface angle prediction method, which is based on ellipse rotation angles, as wood surface light scattering patterns formed from an elliptical shape shift to a circular shape with increase in the dive angle.

Scatter plot for the surface angle reference data and the identified angles.
The correlation coefficients were higher than 0.93 with a dive angle (θ) up to 30° (a), while they were lower than 0.82 with additional increase in the dive angle (b).
Figure 8a illustrates the area plot of the sum pixel numbers in the y-axis of each ellipse shape at various surface angles. The curves are stacked showing the relative contributions of each surface angle to the total height of the curve at each pixel interval. When the wood surface angle was 0, it had the highest sum value at the position of light illumination center, and with increase in the surface angle, the sum value was decreased. However, there was an opposite trend when the sum values on the x-axis (b) were calculated.
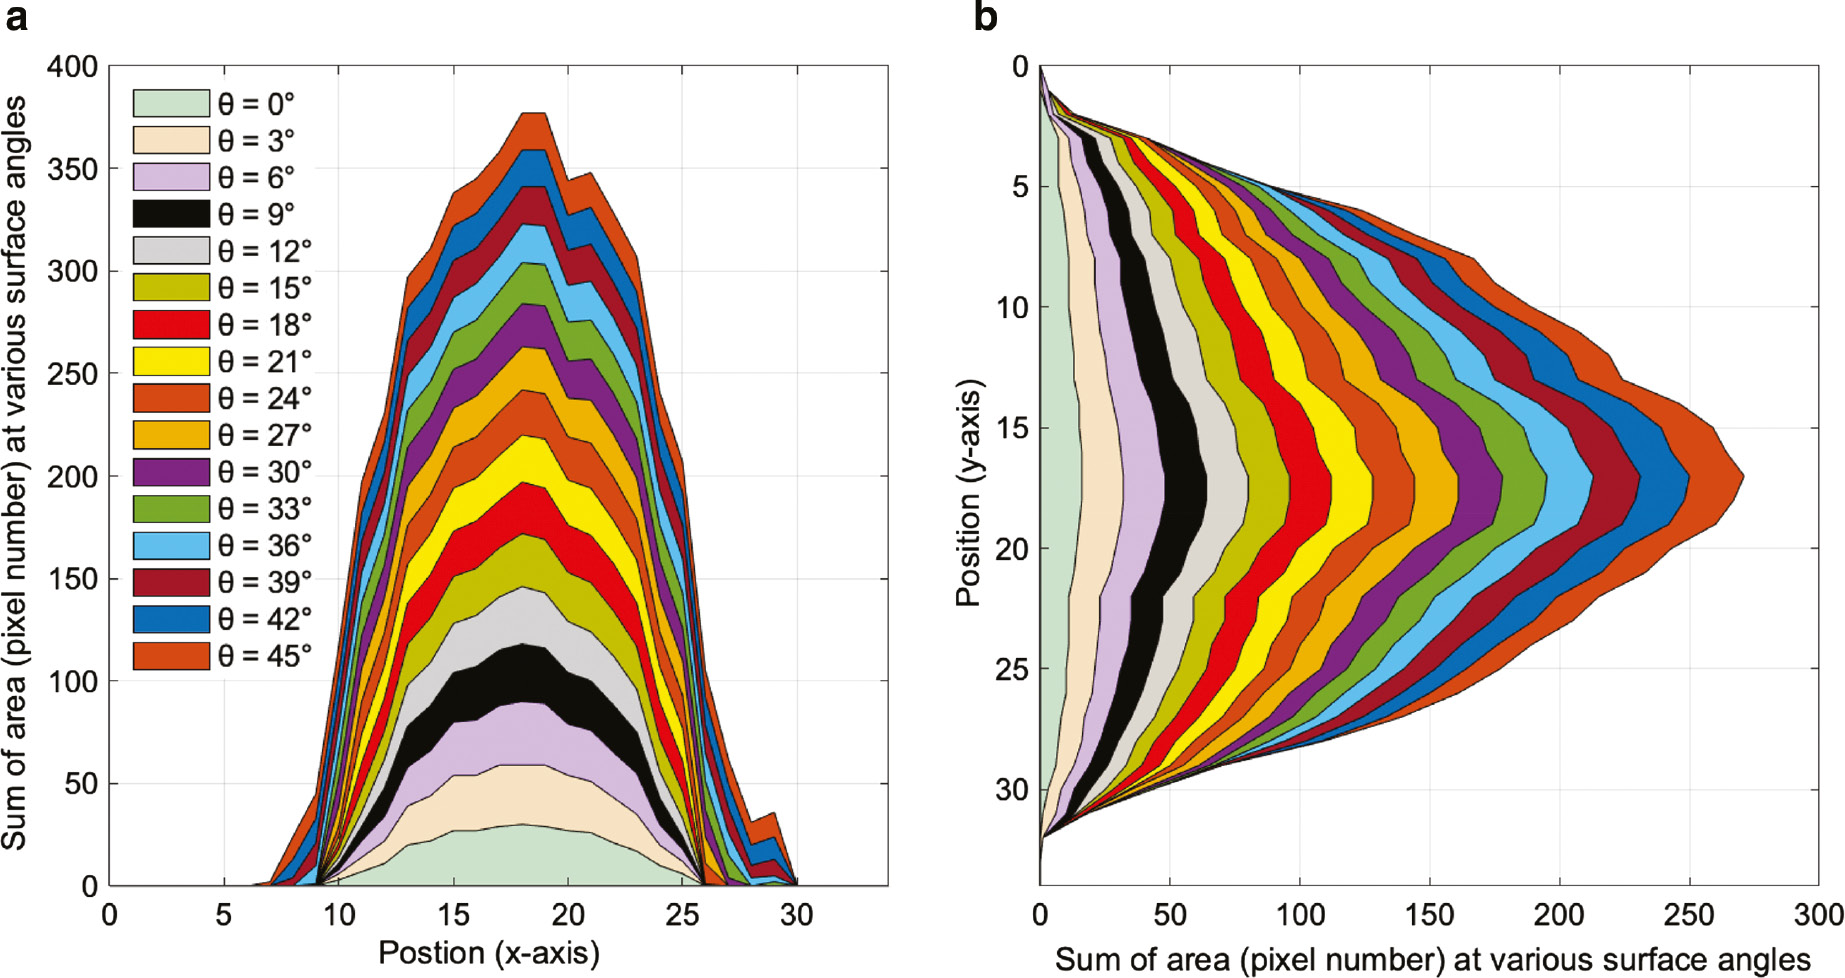
When the wood surface angle was 0, it had the highest sum value at the position of light illumination center, and with increase in the surface angle, the sum value was decreased. However, there was an opposite trend when the sum values on the x-axis (b) were calculated.
Area plot for total pixel numbers counted on the y-axis (a) and x-axis (b). Their values are correlated with the ellipse rotation angles (θ).
Table 1 presents the surface angle prediction results. When the dive angle was greater than 30° and the RMSE was over 4°, the prediction model was poor. The conclusion is almost consistent with that made from Figure 7.
Surface angle prediction models and their accuracies.
| Dive angle (°) | r2 | RMSECV (°) | CRa of PC1 (y/x direction) | Regression coefficients | |||
|---|---|---|---|---|---|---|---|
| a | b | c | d | ||||
| 0 | 0.90 | 3.8 | 73%/59% | −1.15 | 1.15 | −1.10 | 0.45 |
| 3 | 0.92 | 3.4 | 75%/66% | 16.07 | 0.28 | 0.80 | 0.21 |
| 6 | 0.99 | 0.7 | 77%/49% | 12.11 | 0.44 | 0.53 | −0.07 |
| 9 | 0.98 | 2.1 | 79%/49% | 4.90 | 0.78 | 0.21 | −0.01 |
| 12 | 0.96 | 2.1 | 75%/61% | 3.23 | 0.84 | 0.08 | −0.18 |
| 15 | 0.97 | 1.4 | 74%/52% | 8.26 | 0.57 | 0.11 | −0.77 |
| 18 | 0.96 | 2.4 | 75%/41% | 10.33 | 0.49 | 0.77 | −0.42 |
| 21 | 0.96 | 2.4 | 65%/72% | 11.71 | 0.44 | 1.01 | 0.14 |
| 24 | 0.96 | 2.9 | 62%/59% | 12.07 | 0.44 | −1.30 | 0.20 |
| 27 | 0.94 | 3.7 | 46%/72% | 5.62 | 0.70 | 0.65 | 0.10 |
| 30 | 0.92 | 4.0 | 48%/61% | 16.79 | 0.23 | −2.28 | 0.46 |
| 33 | 0.6 | 8.8 | 49%/71% | −0.80 | 0.89 | 0.86 | −0.46 |
| 36 | 0.78 | 6.0 | 44%/38% | 8.94 | 0.51 | 2.29 | 0.54 |
| 39 | 0.86 | 5.2 | 47%/66% | 18.21 | 0.15 | 3.88 | 0.14 |
| 42 | 0.83 | 5.1 | 43%/65% | 15.40 | 0.26 | 4.92 | 1.64 |
| 45 | 0.61 | 9.0 | 41%/53% | 14.18 | 0.31 | 3.75 | 0.37 |
aCR, contribution rate.
Conclusion
In the present study, an NIR imaging camera combined with a focused halogen light source (Ø 1 mm) was employed to evaluate light scattering patterns at various dive angles. Spatially resolved reflectance images (1002 nm, 1217 nm, and 1413 nm) of Hinoki cypress (Chamaecyparis obtusa [Siebold & Zucc.] Endl.) at various dive angles and surface angles were obtained. Subsequently, based on the ellipse scattering patterns caused by the “tracheid effect”, eccentricities (e) and ellipse rotation angles (θ) were calculated for predicting softwood sample 3D grain angles. A high accuracy in wood dive angle prediction was achieved (r2: 0.98 and RMSE: 2.18° under five-fold CV). In addition, the surface angle prediction results were greater than 0.90 on r2 with RMSE values lower than 3.8° when the dive angle was under 30°. Although higher dive angles have been demonstrated to affect the prediction of surface angles based on softwood “tracheid effect” methods, the issue could be solved or addressed by combining the obtained results with results from traditional image analyses of wood sample surfaces.
Based on the laboratory experiment results, a cheaper and effective softwood grain angle measurement system could be developed to facilitate practical measurement activities using a high spatial resolution (more pixel numbers) multispectral imaging camera and a row of spotlight sources.
Author contributions: All the authors have accepted responsibility for the entire content of this submitted manuscript and approved submission.
Research funding: None declared.
Employment or leadership: None declared.
Honorarium: None declared.
References
Agin, G.J. (1981) Fitting ellipses and general second-order curves. Technical Report CMU-RI-TR-81-5, Robotics Institute, Carnegie-Mellon University.Suche in Google Scholar
Buksnowitz, C., Muller, U., Evans, R., Teischinger, A., Grabner, M. (2008) The potential of SilviScan’s X-ray diffractometry method for the rapid assessment of spiral grain in softwood, evaluated by goniometric measurements. Wood Sci. Technol. 42:95–102.10.1007/s00226-007-0153-6Suche in Google Scholar
Gindl, W., Teischinger, A. (2002) The potential of Vis- and NIR-spectroscopy for the nondestructive evaluation of grain-angle in wood. Wood Fiber Sci. 34:651–656.Suche in Google Scholar
Haygreen, J.G., Bowyer Jim, L. Forest Products and Wood Science: An Introduction, 2nd Ed. Iowa State University Press, Ames, IA, 1989, p. 500, ISBN: 081381801X, pp. 241.Suche in Google Scholar
Hu, C., Tanaka, C., Ohtani, T. (2004) On-line determination of the grain angle using ellipse analysis of the laser light scattering pattern image. J. Wood Sci. 50:321–326.10.1007/s10086-003-0569-zSuche in Google Scholar
Kitamura, R., Inagaki, T., Tsuchikawa, S. (2016) Determination of true optical absorption and scattering coefficient of wooden cell wall substance by time-of-flight near infrared spectroscopy. Opt. Express 24:3999–4009.10.1364/OE.24.003999Suche in Google Scholar
Ma, T., Schajer, G., Inagaki, T., Pirouz, Z., Tsuchikawa, S. (2018)Optical characteristics of Douglas fir at various densities, grain directions and thicknesses investigated by near-infrared spatially resolved spectroscopy (NIR-SRS). Holzforschung 72:789–796.10.1515/hf-2017-0213Suche in Google Scholar
Martens, H., Naes, T. Multivariate Calibration. Wiley, NY, 1989.p. 438, ISBN: 0471909793, pp. 97–163.Suche in Google Scholar
Nyström, J. (2003) Automatic measurement of fiber orientation in softwoods by using the tracheid effect. Comput. Electron. Agr. 41:91–99.10.1016/S0168-1699(03)00045-0Suche in Google Scholar
Qin, J., Lu, R. (2008) Measurement of the optical properties of fruits and vegetables using spatially resolved hyperspectral diffuse reflectance imaging technique. Postharvest Biol. Technol. 49:355–365.10.1016/j.postharvbio.2008.03.010Suche in Google Scholar
Rasmussen, C.E., Williams, C.K.I. Gaussian Processes for Machine Learning. The MIT Press, London, 2005. p. 272, ISBN: 026218253X.10.7551/mitpress/3206.001.0001Suche in Google Scholar
Schajer, G.S., Orhan, F.B. (2006) Measurement of wood grain angle, moisture content and density using microwaves. Holz. Roh. Werkst. 64:483–490.10.1007/s00107-006-0109-9Suche in Google Scholar
Schajer, G.S., Sutton, D.B. (2016) Identification of 3D wood grain angle by directional reflection measurement. Wood Mater. Sci. Eng. 11:170–175.10.1080/17480272.2016.1147075Suche in Google Scholar
Schwanninger, M., Rodrigues, J.C., Fackler, K. (2011) A review of band assignments in near infrared spectra of wood and wood components. J. Near Infrared Spec. 19:287–308.10.1255/jnirs.955Suche in Google Scholar
Simonaho, S.P., Palviainen, J., Tolonen, Y., Silvennoinen, R. (2004) Determination of wood grain direction from laser light scattering pattern. Opt. Lasers Eng. 41:95–103.10.1016/S0143-8166(02)00144-6Suche in Google Scholar
Tsuchikawa, S., Tsutsumi, S. (1997) Application of near infrared spectrophotometry to wood. 5. Calibration equations for physical conditions of wood. Mokuzai Gakkaishi. 43:149–158.Suche in Google Scholar
Zhou, J., Shen, J. (2003) Ellipse detection and phase demodulation for wood grain orientation measurement based on the tracheid effect. Opt. Lasers Eng. 39:73–89.10.1016/S0143-8166(02)00041-6Suche in Google Scholar
©2019 Walter de Gruyter GmbH, Berlin/Boston
Artikel in diesem Heft
- Frontmatter
- Original Articles
- Evaluating timber quality in larger-diameter standing trees: rethinking the use of acoustic velocity
- The use of ultrasound velocity and damping for the detection of internal structural defects in standing trees of European beech and Norway spruce
- Three-dimensional grain angle measurement of softwood (Hinoki cypress) using near infrared spatially and spectrally resolved imaging (NIR-SSRI)
- Stress wave evaluation for predicting the properties of thermally modified wood using neuro-fuzzy and neural network modeling
- An innovative method for the chemical modification of Carpinus betulus wood: a methodology and approach study
- Effect of process variations of polycaprolactone modification on wood durability, dimensional stability and boron leaching
- Influence of Quercus petraea Liebl. wood structure on the permeation of oxygen through wine barrel staves
- Measurement of mechanical properties of multilayer waterborne coatings on wood by nanoindentation
- Effect of lignin-containing cellulose nanofibrils on the curing kinetics of polymeric diphenylmethane diisocyanate (PMDI) resin