Differences in wood properties of Picea abies L. Karst. in relation to site of provenance and population genetics
-
Jakub Sandak
 ,
Anna Sandak
,
Anna Sandak

Abstract
Chemical and physical characteristics of wood from six European populations of Picea abies were investigated taking into consideration their genetic differentiation determined by four microsatellites markers. The growth conditions of investigated spruce trees differed significantly. As a consequence, several adaptations were observed in samples from varying environments. The adaptation mechanisms include a variation to the annual rings morphology as well as the physical properties of the wood. It was proved that some properties, such as wood density or latewood ratio, are strictly correlated to the environmental variables. Results show that trees from geographically distinct populations present some diversity in the genotypes. It was also noticed that some trees did not share their genetic profile with other plants from the same location due to high intrapopulation variability. Samples from Finland possessed the lowest level of internal differentiation, while samples from northern Poland presented the lowest allele richness and were most divergent from the others. It was not possible to correlate any wood properties (chemical or physical) to genetic features of the population due to high intrapopulation diversity.
Introduction
Norway spruce (Picea abies L. Karst.) is widely cultivated in Europe, being one of the most important tree species used for the production of pulp and timber products. The wood properties of Picea, as all the other species, may be strongly influenced by local variables. Climate (temperature, rainfall, wind, and sun), as well as soil features (fertility, drainage, and nutrient availability), deeply affect the growth of trees. The spruce wood from northern provenances of Norway and Finland has, on average, a higher percentage of latewood (LW) and a higher overall density than trees from Central Europe (Skrøppa et al. 1999). Trees growing at higher elevation sites, which are, in general, more exposed, often have an inferior stem form and contain less stiff wood, compared to those planted in more protected sites (Moore et al. 2009). High rainfall induces, in most cases, a wider ring width. The correlation between wood density and temperature during the growing season is generally negative (Ivković et al. 2013). Water availability is a limiting factor for earlywood (EW) development in the spring time, whereas low air temperature is restraining LW growth in the summer time (Pokorný et al. 2012). According to Franceschini et al. (2012), between- and within-ring variations are influenced by tree developmental stage, site, genetics, and forest management. Climate or hydraulic maintenance was hypothesized to be responsible for the variation of the radial tracheid width. Several other variations in the tree ring structure due to genetic provenance were observed by Park and Spicker (2005), Miina (2000), Manetti and Cutini (2006), and Andreassen et al. (2006). Bernabei and Bontadi (2011) compared a series of tree rings as measured on historic musical instruments and effectively linked dendrochronological analysis to wood provenance. The provenance of wood has an effect on the chemical composition of the wood. Different contents of cellulose, lignin, hemicelluloses, and extractive components were measured in spruce wood from various locations (Tjoelker et al. 1998).
Wood properties and the economical value of resources may differ between stands as an effect of forest management and silvicultural practices (Jyske et al. 2010). The combined effects of tree spacing, thinning, pruning, etc., on wood technological properties (wood density, ring width, proportion of juvenile, EW, and LW) were investigated by Jaakkola et al. (2006, 2007), among others. It was proven that increasing thinning intensity resulted in lower mean wood density, tracheid length, and LW proportion in harvested wood. Fertilization, however, accelerated volume growth and increased the overall economic value of resources (Cao et al. 2008). Fertilization might also change the fiber characteristics. Mäkinen et al. (2002) concluded that fertilization reduced fiber length and cell wall thickness, but increased fiber and lumen diameter in rings of the same age.
Phenotypic traits of trees are greatly influenced by the environment and also by their genetic origin. Density, for example, shows high heritability and responds well to genetic improvement (Zobel and Jett 1995). It was confirmed in another work by Pliura et al. (2007), where wood density of poplar hybrids was under strong genetic control. Heritability and additive genetic coefficient of variation within seven traits of forest trees were compiled by Cornelius (1994) on the basis of 67 published papers. Wood specific gravity heritability was always low as well as other traits. The analysis of additive genetic coefficients of variation suggested that specific gravity tends to have lower values than other traits, while height and diameter had lower values than straightness. The levels of additive genetic variation and heritabilities suggest that reasonable levels of genetic gain can be achieved by screening relatively low numbers of trees. The term “gene diversity” (or “expected heterozygosity”), proposed by Nei (1973, 1987) as a measure of diversity, is frequently used to estimate genetic variation in population genetics. This was the case for quantifying a genetic variation in populations (Driscoll et al. 2002; Hoelzel et al. 2002), evaluating genetic divergence and population relationships (Nei 1973; Ramachandran et al. 2005). This parameter is also considered as the most suitable for inbred mating populations (Weir 1996).
The overall goal of molecular population studies is to identify the causal genes of natural variation in traits that affect fitness and result in evolutionary change through natural selection and adaptation to local environments. Similarly, plant breeders seek to identify causative polymorphisms for important agronomic traits, thus, providing a powerful resource for genetic improvement of plant crops through direct allele selection (Haussmann et al. 2004) and/or biotechnology (Boerjan 2005). DNA markers were also proposed for identification of protected species in the context of combating illegal logging (Höltken et al. 2012). In this context, there is a tendency for a combination of genetic, anatomic, and chemical-spectroscopic methods for the identification of the origin of a wood (Zahnen 2014).
Genetic variability of P. abies from different populations in Europe has been previously investigated by means of several markers (Acheré et al. 2005; Goncharenko et al. 2005; Maghuly et al. 2006; La Porta et al. 2007). Also microsatellites, as markers especially suitable for studies of tree population genetics, have already been applied to highlight differences among populations (Scotti et al. 2000, 2002). The major advantages of nuclear microsatellite markers are their lower sensitivity to the variation in population effective size and the possibility of assessing heterozygosity (Scotti et al. 2006). Populations characterized by a narrow genetic basis are thought to be more sensitive to environmental changes or disease, leading to a decrease in productivity (Oleksyn et al. 1994). Another benefit of studying simple sequence repeat (SSR) markers is their high ability of alleles’ discriminations. Finally, relatively fast analysis procedure (the isolation of DNA, the duplication of DNA fragments by PCR, and the comparison of markers’ profiles) allows rapid and accurate DNA testing (Nowakowska 2011).
Summarizing the state of the art, it was stated that wood properties can be affected by both environmental factors as well as genetic characteristics. The objective of this research was, therefore, to investigate the differences in wood properties of selected Norway spruce trees taking into consideration the location of the stands and genetic characteristics of the population. Another goal was to determine if any correlation between wood properties and genetic features of these populations is noticeable.
Materials and methods
Norway spruce wood samples collected in six different settlements [from Finland, Estonia, Poland (three lots), and Italy] within its natural range in Europe was investigated (Figure 1). At least 36 disks from the bottom of the freshly harvested trees were extracted at each location. Stands differed in geographical position, elevation, climate, and silviculture, covering the actual distribution of P. abies in Europe. The summary of site characteristics is presented in Table 1. The details for the procedure of sample harvesting, conditioning, and preparation was described previously (Sandak et al. 2011). Experimental samples were obtained from adult wood zones ensuring an equal cambial age of all investigated samples. It was impossible, however, to collect tree samples of exactly the same age.
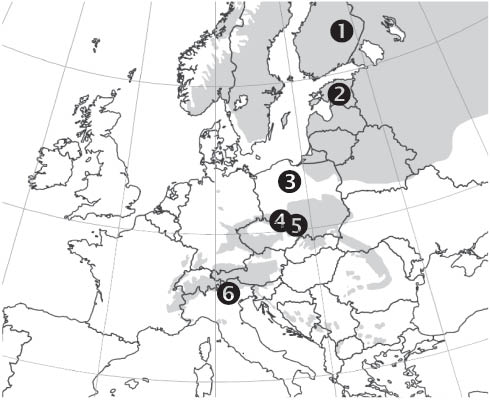
The distribution map of Norway spruce (Picea abies) and sampling locations, source: EUFORGEN 2009, www.euforgen.org.
Geographic coordinates, annual mean temperature and precipitation of each locations followed by altitude, mean tree age and trunk radius of the trees observed. ± standard error of the mean.
| Provenance | Location | Coordinates | Climatic conditions | Altitude (msl) | Age (year) | Radius (mm) | |||
|---|---|---|---|---|---|---|---|---|---|
| Latitude | Longitude | Avg. temp. (°C) | Avg. prec. (mm) | ||||||
| ➊ | Finland | Lieksa | 63°22′00″ | 30°42′00″ | +2 | 650 | ∼140 | 153±4 | 135±5 |
| ➋ | Estonia | Tartu | 58°18′00″ | 27°16′00″ | +4.8 | 600 | ∼70 | 92±2 | 164±8 |
| ➌ | Poland 1 | Rynków | 53°42′00″ | 18°30′00″ | +7.0 | 548 | ∼135 | 52±5 | 99±6 |
| ➍ | Poland 2 | Grzędy | 50°42′36″ | 16°11′24″ | +8.4 | 600 | 600–810 | 92±2 | 167±7 |
| ➎ | Poland 3 | Krzeszów | 50°44′24″ | 16°02′24″ | +8.4 | 600 | 490–540 | 73±2 | 183±11 |
| ➏ | Italy | Paneveggio | 46°18′00″ | 11°49′59″ | +2.4 | 1260 | 1700–1800 | 150±6 | 211±11 |
The cross sections of samples, including pith and bark, were scanned on the office scanner and calibrated spatially. The physical properties of samples (LW ratio and average ring width) were measured by means of image analysis. The image processing included filtering and contrast enhancement. The border between EW rings as well as the transition of EW toward LW were automatically detected by the software (LabView, National Instruments, Austin, TX, USA) and reported separately for each sample. Wood density was estimated according to both gravimetric method and X-ray radiography. The second method provided detailed density maps and profiles in a form of X-ray absorbance images. The samples were conditioned to ∼12% moisture content (MC) before measurement (20°C, 60% RH).
Radiometric density was determined on the custom-built X-ray densitometer equipped with a long-focus X-ray source (ItalStructure, Rovereto, TN, Italy). The settings of the bulb were 55 kV and 35 mA, with the exposition time of 100 ms. Scintillated photodiode array (Hamamatsu S5668, Hamamatsu Photonics k.k., Shizuoka, Japan) served as an X-ray detector. The calibration of the system was performed on the basis of a set of selected samples, including varying densities and thicknesses.
The concentration of cellulose was determined according to the Seifert procedure (with acetylacetone-dioxane-hydrochloric acid) (Browning 1967). Holocellulose content was obtained by wood delignification by sodium chlorite with the addition of acetic acid (Browning 1967). The amount of other wood components was determined according to the following standards: lignin (Tappi standard 2006), hot water extractives (Tappi standard 2008), 1% NaOH extractives (Tappi standard 2007c), organic solvent extractives (Tappi standard 2007a), and ash content (Tappi standard 2007b). The quantity of hemicelluloses was computed as the difference between cellulose and holocellulose contents. Detailed chemical analyses were performed on three representative sample sets selected from each lot.
Total genomic DNA was extracted based on the protocol of Rachmayanti et al. (2006). Wood, 100 mg, was scratched from each sample with a scraper, put in a 1.5-ml vial adding 800 μl of extraction buffer made of AP1 DNeasy Plant Mini Kit (Qiagen Sciences, Germantown, MD, USA) buffer, PVP 3.1% (w/v), and 8 μl of RNA-ase, then mixed and incubated 65°C overnight. After incubation, 250 μl of AP2 buffer was added and then stored at -20°C overnight. Finally, the solution was mixed for 5 min at 16 000g and eluted following DNeasy Plant Mini kit instructions.
Four nuclear primer pairs for SSR loci were used for this study: EAC1G05, EAC1D10 (Scotti et al. 2002), SpAC1B8 (Pfeiffer et al. 1997), and UAPCA24 (Hodgetts et al. 2001). PCR amplifications were conducted by a 96-well MasterCycler EpGradient (Eppendorf, Hauppauge, NY, USA) using a total volume of 25 μl with 2.5 μl 10× Dream Taq Buffer, 0.5 U of Dream Taq (Termo Scientific, Fermentas, Pittsburgh, PA, USA) 200 μM dNTPs, 0.2 μM of each primer, 50 ng of total genomic DNA. PCR-cycling conditions consisted of fan initial denaturation step at 94°C for 5 min, followed by 35 cycles of 45 s at 94°C, 45 s at annealing temperature, and 45 s at 72°C. Annealing temperatures were 60°C, 53°C, 55°C, and 57°C respectively, for EAC1D10, EAC1G05, UAPCA24, and SpAC1B8. A final extension step of 45 min at 72°C ended the cycle. The fluorescently labeled microsatellite fragments were analyzed on a MegaBace 500 (Ge Healthcare, Little Chalfont, UK) automated sequencer. Fragment sizing was performed by means of MegaBace 1.2 (Ge Healthcare) fragment profiler software.
Physical and chemical parameters were analyzed using SYSTAT 11 (Systat Software Inc., Richmond, CA, USA) statistical package. Several procedures of the package were applied to study the impact of different factors on the measured variables. Linear correlation was applied to study the effect of altitude and latitude on chemical variables. Analysis of variance was applied to study location and tree age as a source of variation on average ring width, LW ratio, and wood density. Robust discriminant analysis was finally used to classify the wood in relation to the provenance on the basis of density, LW ratio, and ring width. Population genetic parameters were used to evaluate genetic polymorphisms and to quantify genetic variation among the investigated populations. The number of alleles at each locus, fixation index (FIS), inbreeding coefficient (FST), genotypic differentiation (exact G-test), and P-value (Fisher’s method) for each population pair were calculated using the software GENEPOP 4.2 (University of Montpellier, France) (Rousset 2008). Accessions with only a single amplified fragment were assumed to be homozygous for that fragment. This leads to underestimate the percentage of heterozygosity when computing gene diversity. The frequency of null alleles was, thus, estimated per locus and per population by the EM algorithm of GENEPOP 4.2 (Dempster et al. 1977). The so-called “gene diversity”, or expected heterozygosity as proposed by Nei (1987) was calculated with the software FSTAT 2.9.3 (Lausanne University, Lausanne, France) (Goudet 2002). Genetic distances were computed according to Nei (1978). The software NTSYSpc (Exter Publishing Ltd., Setauket, NY, USA) served to cluster populations and plants on the basis of their genetic distances. A sequential agglomerative hierarchical nested cluster analysis with an unweighted pair group method of clustering (UPGMA) was applied. It was followed by a tree plot procedure of the same package to provide a graphic representation of similarity parameters, from which relationships among populations and plants may be deduced. Euclidean distance single linkage method was used (after the standardization of data within the SIMINT procedure of the NTSYSpc program) to calculate the average “taxonomic” distance among the populations based on chemical and physical data. The matrix of similarity based on SSRs data was compared to the matrix based on chemical or physical parameters by a two-way Mantel test (Mantel 1967). The procedure computes the product-moment correlation r and the Mantel test statistics to measure the degree of relationships between the two matrices.
Results and discussion
Chemical composition
The chemical analysis of powdered wood allowed the quantitative assessment of the differences in chemical composition of investigated materials and is summarized in Table 2. The values of individual chemical components of Norway spruce wood for all locations are within the reference values for this species as reported in the literature (Tjoelker et al. 1998). The quantity of cellulose was ∼45.5% and was similar in all samples. The holocellulose content ranged from 67% to almost 72% and was the most varying component among all. Significant differences (almost 2.5%) in lignin content were observed between the material from northern Poland (➌) and Italy (➏). A positive Pearson correlation value was found between site altitude and lignin content (r=0.727). Moreover, 53% of the variation in the lignin content was explained by the increase of altitude (R2=0.529) at the significance level of 90% (P=0.101) through a consecutive regression analysis. This finding is in agreement with Gindl et al. (2001), who observed that trees growing at higher altitudes compensate for the thinner cell walls with increased lignin content to maintain mechanical integrity of the xylem.
Chemical composition (average for each group) estimated as percent of dry weight.
| Provenance (%) | Cellulose (%) | Lignin (%) | Holocelulose (%) | Hemicelluloses (%) | Extractives (%) | Soluble in | Minerals (%) | ||
|---|---|---|---|---|---|---|---|---|---|
| Hot H2O (%) | 1% NaOH (%) | ||||||||
| ➊ | Finland | 45.16 | 28.82 | 70.24 | 25.08 | 1.82 | 2.05 | 11.48 | 0.28 |
| ➋ | Estonia | 45.62 | 27.06 | 67.25 | 21.63 | 1.97 | 0.65 | 9.75 | 0.29 |
| ➌ | Poland 1 | 45.52 | 26.92 | 67.36 | 21.84 | 1.51 | 0.93 | 10.87 | 0.31 |
| ➍ | Poland 2 | 45.68 | 28.41 | 70.18 | 24.50 | 1.84 | 0.56 | 9.73 | 0.30 |
| ➎ | Poland 3 | 45.49 | 27.91 | 71.82 | 26.33 | 2.45 | 1.02 | 11.54 | 0.27 |
| ➏ | Italy | 45.49 | 29.34 | 70.75 | 25.26 | 1.15 | 0.87 | 10.65 | 0.31 |
| Standard error of mean | ±1.36 | ±0.25 | ±1.80 | ±1.50 | ±0.32 | ±0.30 | ±0.60 | ±0.26 | |
The variation in extractives amount did not exceed 1.3% within all tested materials. These contents were inferior to those published in the literature (Tjoelker et al. 1998). Indeed, the extraction was carried out only with ethanol, while most of the literature references were based on ethanol-benzene mixture extraction. Slightly higher differentiations were noticed for substances soluble in 1% NaOH and varied in the range of ∼1.8%. A positive correlation between the extractive components soluble in hot H2O, and the latitude was observed (r=0.656, R2=0.431, and P=0.157). Such results are in agreement with findings of Hakkila (1968), who observed that the average proportion of extractives slightly increase with increasing latitude in pine heartwood. However, the average total extractives’ proportion of sapwood remains constant. The most recent research published by Caron et al. (2013) state that yield class, latitude, longitude, and thinning do not have an impact on the total amount of acetone-soluble extractives.
The quantitative data related to the chemical composition of wood can be utilized for studies of taxonomy (Sokal and Sneath 1963; Sneath and Sokal 1973) and/or ecology (Legendre and Legendre 1983; Pielou 1984). The average “taxonomic” distance due to chemical content variations within all investigated populations is shown as a cluster plot in Figure 2a. A clear clustering of samples from northern populations of Finland and Estonia is noticed. All the other populations are grouped in the second cluster and reflect the geographical distances between sites.

Cluster plots of the taxonomic distances among six populations of Picea abies on the basis of chemical (a) and physical (b) wood characteristics.
It should also be noted that traditional “wet chemical analysis”, as discussed here, possesses a relatively large error margin and is not capable of providing refined qualitative information. Instead, clear evidences of variations to the molecular structure (as scrutinized with near-infrared spectra), due to the combined effect of tree provenance, environmental factors, and silvicultural practices, were previously reported by Sandak et al. (2011).
Physical properties
The summary of investigated physical wood properties is presented in Table 3 and Figure 3. Average wood densities are in the range of 0.39–0.52 g·cm-3 and correspond to values attributed to Norway spruce (Figure 3a and b). The samples from Estonia (➋) and Finland (➊) possess the highest density values, which confirms the hypothesis of Zobel and van Buijtenen (1989) that growth rate and density of conifers are negatively correlated. The lowest densities were measured on the Italian wood originated from the Dolomite Mountains. It is a typical characteristic of resonance (tone) wood. Such wood, besides having superior acoustical characteristics, often possesses a fairly steady narrow or narrowing growth, with an average ring width of ∼1 to 2 mm. Other characteristic of tone wood is its low density associated with stiffness across the grain. Low ambient temperature and short grooving season negatively affect LW formation (Splechtna et al. 2000). It follows the supposition that the wood of trees growing at higher elevations has lower density (and LW width) compared to that of low altitudes. As a consequence, Norway spruce from the Paneveggio forest ➏ has a particular microstructure (low density and high stiffness at the same time) determining its superb acoustic properties (Nocetti and Romagnoli 2008).

Wood density (a), X-ray measured wood density (b), average ring width (c), and late wood ratio (d) of different provenances of Picea abies.
Average ring width, latewood (LW) ratio, and density of Picea abies wood from different origins (±the standard error of mean).
| Site | Source of variation | ||
|---|---|---|---|
| Avg. ring width (mm) | LW ratio | Density (g·cm-3) | |
| Poland 1 | 2.135±0.192 | 0.204±0.017 | 0.457±0.012 |
| Poland 2 | 1.836±0.074 | 0.245±0.013 | 0.471±0.005 |
| Poland 3 | 2.419±0.086 | 0.162±0.010 | 0.430±0.009 |
| Estonia | 1.841±0.091 | 0.283±0.015 | 0.515±0.016 |
| Finland | 0.898±0.037 | 0.379±0.009 | 0.518±0.006 |
| Italy | 1.444±0.039 | 0.216±0.008 | 0.393±0.006 |
| P in F test | 0.003 | 0.059 | 0.721 |
| P for tree age | 0.170 | 0.019 | 0.170 |
| P for site* and tree age | 0.000 | 0.006 | 0.432 |
The X-ray radiograms and density profiles, as presented in Figure 4, demonstrated slightly different density patterns for each location. Relatively low values of density are noticed for samples from Italy ➏, Poland ➎, and Poland ➌. Accordingly, the reaction wood was most frequent in the samples originated from mountainous areas (Italy ➏ and Poland ➎). The zone of juvenile wood had relatively high density in most samples. A tendency to a gradual increase of density with the age of tree can also be noticed on several density profiles.

Examples of x-ray radiograms and density profiles for trees of different provenances: Finland ➊ (a), Estonia ➋ (b), Poland ➌ (c), Poland ➍ (d), Poland ➎ (e) and Italy ➏ (f). (Note: arrows indicate locations of the reaction wood.)
The size of logs (log radius) was not correlated with the age. The wood samples from the north of Poland ➌ were the youngest and had the highest standard deviation of the ring width. The moderately young trees from southern Poland ➎ were relatively large in diameter. On the contrary, Finnish samples with the smallest diameter were extracted from the oldest trees. The small annual ring widths in both, Scandinavia and high mountainous areas, were caused by a short vegetation period and severe climate, as well as presumably soil fertility and silviculture. In the case of samples from southern Poland ➎, the mean width of annual rings was more than twice as great in comparison to that from Finland. It was also noticed that even if two locations in Southern Poland (➍ and ➎) were close to each other (the distance of ∼5 km), relatively large differences between the physical characteristics were noticed. The wood in ➍ was taken from a steep mountain slope at the level of ∼800 masl. Samples of ➎ were collected from the flat land (∼500 masl) at the foot of the mountain. Narrower rings in wood from ➍ can be explained, therefore, by more severe climatic conditions and natural environment (steep slope – up to 30% – and less fertile soil-bonitation III).
Wood from Finland ➊ had the highest share of LW (Figure 3d). It is due to the short vegetation season and a more severe climate. Analogical observations were made for spruce wood from nearby Estonia ➋, Italy ➏, and Poland ➍. Splechtna et al. (2000) reported, however, the decline in the percentage of LW and the mean ring density with increasing elevation. In this context, contradictory information is published by different authors. Zobel and van Buijtenen (1989) reported that LW genesis is dependent on the water availability. Irrigated trees have a higher percentage of LW. This statement might be particularly valid for spruce form Italy where the precipitation was the highest (1260 mm annually). The wood from Poland ➌ and ➎ had the lowest LW ratio. A clear tendency to increase the share of EW with the increase of the ring width was observed. An analogous remark was reported for spruce by Zobel and van Buijtenen (1989), among others.
Robust discriminant analyses were performed based on density, LW ratio, and average ring width. The summary of results is presented in Figure 5 and shows a great range of differentiation in terms of site of origin. The first two canonical scores enabled a clear separation of samples from Italy ➏, Finland ➊, and the other provenances. The analysis of variance on the physical properties of samples, as shown in Table 3, evidenced a strong influence of the site on the average ring width (P=0.003), whereas both density and LW ratio were less correlated to the site location. It was also found that the age of trees affected the wood properties, especially the LW ratio (P=0.019).

Canonical scores plot resulting from the robust discriminant analyses of density, late wood ratio, and ring width.
The “taxonomic” distances (a cluster analysis) due to the physical wood characteristics are shown in Figure 2b. Three clusters can be defined here, with Poland ➌ being the most distant from other locations. It was found that wood from Finland ➊ and Italy ➏ had relatively similar characteristics.
Wood density and LW ratio were correlated to the geographical position of the sampling. It was found that 83% of the variation in wood density were explained by differences in the latitude (regression P=0.010), whereas 66% by the altitude above the sea level (P=0.048). Wood density increased at higher latitudes (r=0.913) and was inversely correlated to the altitude (r=-0.815). The regression between LW ratio and latitude was statistically significant (P=0.035), while latitude explained 71% of the total variation. LW ratio was directly correlated with the increase in latitude (r=0.842). On the contrary, the effect of altitude on this propriety was lower (r=-0.363) and indicated the decrease in the LW ratio with the increase in the altitude.
Both geographical latitude and site altitude strongly affect climatic conditions and the tree growth environment, even if they have influenced wood density and LW ratio differently. Regulation of tree growth is controlled genetically, in response to environmental cues, such as day length, light quality, and/or ambient temperature. Heide (1974) showed that formation of the LW tracheids possessing thick walls and narrow lumens took place upon exposure to a short-day photoperiod. The photoperiod control can in some cases be omitted; the growth cessation can be induced even in long photoperiods through a combination of high day and low night temperature. Light and temperature are important environmental factors affecting all physiological processes as the annual growth of the tree is a continuum. These responses involve environmentally-dependent modulations of the expression of specific genes and enzyme activities (Asante et al. 2011). The opposite trends observed for latitude and altitude can therefore, be explained by the different modulation imposed on the physiological processes from day length-light-temperature variables.
Only 2% and 25% of the total variance, for altitude and latitude, respectively, explained the variation of average ring width. Ring width was only moderately correlated (negatively) to both latitude (r=-0.496) and altitude (r=-0.136). It can be assumed, therefore, that genetics (besides silviculture, stand density, soil fertility, age, among others) may affect the ring width within the six populations investigated. The influence of genetic differentiation was analyzed, therefore, in relation to the ring width, but considering also other wood properties of interest.
The SIMINT procedure of NTSYSpc was used for grouping the studied populations by physical characteristics, in an analogy to the chemical analysis discussed before. The resulting dendrogram is shown in Figure 2b. It is clear that the clustering differs significantly from that obtained by the analysis of chemical components (Figure 2a). The two-way Mantel test (Mantel 1967) was used for the statistical comparison of matrices used for clustering. The results showed very poor fit (r=-0.011, t=-0.044, P=0.516), indicating that differentiation of the six populations studied were related to other (than physical properties) factors. Moreover, such differentiations were related to chemical and physical properties independently.
Genetic variables
The number of alleles N, gene diversity GD, and fixation index FIS were calculated for each locus and population (Table 4). The number of alleles per locus obtained in this research is lower than those described by other authors for P. abies. Acheré et al. (2005) found alleles per locus for the 25 microsatellites studied in the range of 5–55 (25 in average). Maghuly et al. (2006) detected 27 (in average) alleles within five loci. Allelic richness, total number of alleles in a population, is also reported in Table 4. The values ranged from 31 (Poland ➌) to 54 (Estonia ➋ and Italy ➏). The slightly lower number of scored alleles within this study could be explained by the dimension of the experimental matrix (plants/number of loci). The possibility of detecting new alleles increases with increasing number of analysis and the polymorphism of each locus.
Number of alleles N, estimated null allele frequency NA gene diversity GD fixation index FIS calculated for each locus and provenance, and overall allelic richness AR.
| Origin | Locus EAC1D10 | Locus EAC1G05 | Locus UAPCA24 | Locus SpAC1B8 | Overall | |||||||||||||
|---|---|---|---|---|---|---|---|---|---|---|---|---|---|---|---|---|---|---|
| N | NA | GD | FIS | N | NA | GD | FIS | N | NA | GD | FIS | N | NA | GD | FIS | AR | FIS | |
| ➊ Finland | 14 | 0.239 | 0.936 | 0.525 | 14 | 0.246 | 0.948 | 0.531 | 12 | 0.203 | 0.851 | 0.478 | 5 | 0.140 | 0.498 | 0.410 | 45 | 0.497 |
| ➋ Estonia | 14 | 0.326 | 0.938 | 0.704 | 15 | 0.359 | 0.946 | 0.706 | 15 | 0.262 | 0.918 | 0.577 | 10 | 0.191 | 0.565 | 0.509 | 54 | 0.637 |
| ➌ Poland 1 | 13 | 0.379 | 0.926 | 0.820 | 12 | 0.236 | 0.922 | 0.518 | 9 | 0.327 | 0.835 | 0.734 | 9 | 0.306 | 0.858 | 0.611 | 43 | 0.671 |
| ➍ Poland 2 | 13 | 0.201 | 0.943 | 0.470 | 11 | 0.316 | 0.978 | 0.693 | 8 | 0.404 | 0.886 | 0.906 | 8 | 0.171 | 0.705 | 0.409 | 40 | 0.630 |
| ➎ Poland 3 | 13 | 0.212 | 0.939 | 0.468 | 12 | 0.326 | 0.964 | 0.717 | 9 | 0.266 | 0.875 | 0.619 | 7 | 0.257 | 0.754 | 0.668 | 31 | 0.616 |
| ➏ Italy | 15 | 0.150 | 0.920 | 0.275 | 14 | 0.287 | 0.962 | 0.629 | 19 | 0.327 | 0.963 | 0.634 | 6 | 0.364 | 0.731 | 0.895 | 54 | 0.593 |
FIS index is a coefficient of consanguinity due to not-usual mating. The high values at each locus indicate a significant excess of intrapopulation homozygosity. Some differences in alleles among population were present in both locus UAPCA24 and SpAC1B8. Finland ➊ and Estonia ➋ show lower values in gene diversity and FIS for these loci. Italy ➏, however, had the lowest values of FIS at locus EAC1D10. For Finland ➊, the lowest value was found for overall genetic diversity (FIS=0.497).
According to Maghuly et al. (2006), populations of P. abies from high elevation exhibit more genetic variation than samples from middle and low elevations. This was not confirmed in the present research as the stands located at the lowest (Estonia ➋) and highest (Italy ➏) elevations possessed 54 alleles.
The values of pairwise differentiation FST among populations, as summarized in Table 5, were very low especially in the case of Italy ➏ vs. Poland ➍ and ➎, as well as for Finland ➊ vs. Estonia ➋. It was also confirmed by UPGMA cluster analysis from genetic distances among populations. The UPGMA dendrogram shows clustering of populations independently from the country of provenance (Figure 6). Poland ➌ population is the most divergent from the others. Two other clusters can also be distinguished, the first, grouping the northern populations of Estonia ➋ and Finland ➊, the second, grouping Poland ➎ and ➍ and Italy ➏. The fact of clustering three out of six populations in a single cluster (Italy ➏, Poland ➍ and ➎) indicates a moderate level of genetic separation due to geographical provenance.
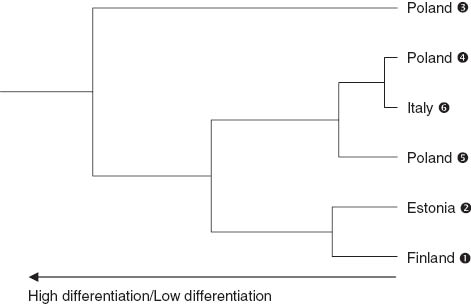
UPGMA cluster plot of the genetic distances among six populations calculated from SSR data.
FST-pairwise differentiation values for each population pair.
| Region | ➊ Finland | ➋ Estonia | ➌ Poland 1 | ➍ Poland 2 | ➎ Poland 3 |
|---|---|---|---|---|---|
| ➋ Estonia | 0.0082 | – | – | – | – |
| ➌ Poland 1 | 0.0460 | 0.0445 | – | – | – |
| ➍ Poland 2 | 0.0242 | 0.0054 | 0.0470 | – | – |
| ➎ Poland 3 | 0.0452 | 0.0391 | 0.0132 | 0.0120 | – |
| ➏ Italy | 0.0203 | 0.0246 | 0.0408 | 0.0016 | 0.0027 |
The above clustering reflects the statistical differentiation of the studied populations. The P values resulting from the exact G-test are summarized in Table 6, where all the population pairs are compared at the genotypic level (number of shared genotypes). Each pair differs statistically when P≤0.05, assuming 95% level of confidence. Only Poland ➌ differed from all the other regions. Estonia ➋ was dissimilar from Finland ➊, as well as Italy ➏ was statistically different from Poland ➍ and ➎. No significant difference was noticed between the genotypic structures of samples from Estonia ➋ and Poland ➍. The set of the above observations is a corroboration of the five populations grouping within the same cluster as presented in Figure 6.
Genotypic differentiation for each population pair (exact G-test) and P-value (Fisher’s method).
| Origin | ➊ Finland | ➋ Estonia | ➌ Poland 1 | ➍ Poland 2 | ➎ Poland 3 | |||||
|---|---|---|---|---|---|---|---|---|---|---|
| χ2 | P-value | χ2 | P-value | χ2 | P-value | χ2 | P-value | χ2 | P-value | |
| ➋ Estonia | 14.00 | 0.081 | – | – | – | – | – | – | – | – |
| ➌ Poland 1 | 43.80 | 0.000 | 31.16 | 0.000 | – | – | – | – | – | – |
| ➍ Poland 2 | 22.51 | 0.004 | 10.73 | 0.217 | 35.28 | 0.000 | – | – | – | – |
| ➎ Poland 3 | 30.79 | 0.000 | 20.68 | 0.008 | 16.33 | 0.038 | 8.19 | 0.414 | – | – |
| ➏ Italy | 24.10 | 0.002 | 25.20 | 0.001 | 38.73 | 0.000 | 7.23 | 0.512 | 6.48 | 0.594 |
The existence of geographical trends of genetic variation over the European Norway spruce natural range was observed by classical statistical methods (Borghetti et al. 1988; Lagercrantz and Ryman 1990). Investigations carried out by the genetic markers revealed differentiation between southern and central European populations (Vendramin et al. 2000) and identified 16 genetic zones (Bucci and Vendramin 2000). Other studies focused more specifically on the area between the northern and southern natural ranges, defined as European disjunction or “spruceless zone” (Nowakowska 2009). The zone covers the Middle Polish Plains where P. abies has a recently sparse distribution. Dering and Lewandowski (2009) described this area as a hybrid for Norway spruce originating from Carpathian and Russian Weichselian refuges. The results reported here show that trees from Poland ➌ belong to a genetic group of spruce well separated from all the others. This has been confirmed by the findings of other researches stating that Baltic area of Norway spruce in Poland is a part of the Scandinavian area. The southern part of Poland, however, belongs to the Hercyno-Carpathic zone, even if there are stands with Norway spruce trees being introduced by German and/or Austrian foresters before the 1st World War.
The result of comparing the matrices of genetic similarity with the average ring width by a two-way Mantel test reveals that both sets of data are poorly correlated (r=-0.007, t=-0.023, P=0.491). No statistical correlation was also found between the matrices of genetic similarity and chemical contents (r=0.208) as well as physical properties (r=0.323). Thus, it was not possible to identify any marker, depending on provenance and associable to wood properties. The presence of alleles shared among all the provenances can be deduced as well from the Lynch’s similarity analysis dendrogram (Figure 7). All the cases, each representing a single analyzed tree, are not clustered in relation to the tree provenance. Individual samples from each of the six locations are dispersed throughout the entire dendrogram because of the large intrapopulation variability. Several studies have shown that genetic variation is relatively high and that the majority is partitioned within (rather than between) populations (Cottrell et al. 2003; Acheré et al. 2005). Maghuly et al. (2006) analyzed genetic diversity in different subpopulations of Norway spruce in Austria by nuclear SSRs finding more genetic variation and heterozygosity within populations than among populations. The geographical differentiation of genes is relatively low due to both the mating system and the high migration rate (Taberlet et al. 1998).

UPGMA dendrogram of the single plants from the six origins, produced by Lynch’s similarity coefficient.
Adaptive traits in forest trees have often both evolutionary and agronomic relevance with practical importance in lumber and pulp production (Peter and Neale 2004). Molecular approaches to genetically dissecting wood properties (and other adaptive traits in forest trees) have focused on quantitative trait locus (QTL) mapping (Casasoli et al. 2006). Although given the large genetic-to-physical distance in most conifers, identification of specific genes responsible for phenotypic variation in these species is unlikely via QTL mapping. Association genetics has become a favored genetic approach for studying quantitative traits in many organisms. It is taking advantage of historical recombination to identify trait-marker relationships on the basis of linkage. The essence of applying genetic approach is the identification of statistical associations between variation in relevant phenotypic traits and allelic polymorphism in known genes, although it is generally difficult to demonstrate that a particular allelic variant is, indeed, causally related to a phenotype (Weigel and Nordborg 2005). Association genetics has been recently applied in several studies on trees (González-Martínez et al. 2007; Denis et al. 2013; Guerra et al. 2013). The present study is based on only four microsatellites and low number of markers. Nevertheless, these were sufficient to discriminate plants among and within the studied populations. Only two couples had the same fingerprinting as visible in Figure 7.
Authors are aware that genetic variability of traits can be best studied in planned experiments where several genotypes are grown in the same site and climatic conditions, with an adapted experimental design. Our study cannot be used for direct association between molecular and morphological features also because molecular approaches based on neutral genetic diversity as microsatellites are not directly connected to selection. These markers can be used (in combination with others) for quantitative mapping of trait loci. Moreover, it is generally recognized that any information about variation at the population level would help in assessing the importance of evolutionary processes. Such knowledge (genetic parameters based on molecular markers for each genetic zone) might also be of great commercial potential for selection and breeding activities, as well as for forest certification.
Conclusions
It was demonstrated here that some physical properties, such as wood density or LW ratio, are correlated to the environmental variables. On the other hand, it was shown that trees from geographically distinct provenance present some genetic diversity. It was also observed that some trees were not sharing their genetic profile with other plants from the same location, due to high intrapopulation variability. The samples from Finland ➊ possessed the lowest level of internal differentiation, while a set of samples from Rynków in Poland ➌ was the most divergent from the others.
The growth conditions of Picea abies trees from various sites investigated in this research differed significantly. As a consequence, several adaptations were observed in samples from varying environments. The adaptation mechanisms include the variation to annual rings morphology (ring width and EW ratio) as well as wood properties (such as density). The variation in the chemical structure was perceptible but only with a small variation. Discriminant analysis on wood properties allowed accurate separation of investigated wood lots and the recognition of wood lot sources. Molecular analysis of tree populations allowed separation among the provenances, even if the geographic differentiation was low. It was not possible to correlate any potential commercial and adaptive traits to investigated microsatellite loci due to the high intrapopulation diversity. Both tree age and provenance were most influential on the wood properties of the studied P. abies samples.
Acknowledgments
Part of this work has been conducted within the framework of the project SWORFISH (team 2009 incoming (CALL 2) and Trentino – PCOFUND-GA-2008-226070) co-financed by Provincia Autonoma di Trento and project SLOPE receiving funding from the European Union’s Seventh Framework Programme for research, technological development, and demonstration under the NMP.2013.3.0-2 (Grant number 604129). Our thanks to foresters and scientists providing experimental samples (Paolo Kovatsch, Dorota Piechowska, Dariusz Gajda, Henrik Heräjärvi, Jüri Järvis). Our gratitude to Włodzimierz Prądzyński, Magdalena Zborowska, and Agnieszka Spek-Dźwigała for assistance in chemical analysis of wood and to Katarzyna Gacka for English revision of the manuscript.
References
Acheré, V., Favre, J.M., Besnard, G., Jeandroz, S. (2005) Genomic organization of molecular differentiation in Norway spruce (Picea abies). Mol. Ecol. 14:3191–3201.Search in Google Scholar
Andreassen, K., Solberg, S., Tveito, O.E., Lystad, S.L. (2006) Regional differences in climatic responses of Norway spruce (Picea abies L. Karst) growth in Norway. Forest Ecol. Manag. 222:211–221.Search in Google Scholar
Asante, D.K.A., Yakovlev, I.A., Fossdal, C.G., Holefors, A., Opseth, L., Olsen, J.E., Junttila O., Øystein, J. (2011) Gene expression changes during short day induced terminal bud formation in Norway spruce. Plant Cell Environ. 34:332–346.10.1111/j.1365-3040.2010.02247.xSearch in Google Scholar PubMed
Bernabei, M., Bontadi, J. (2011) Determining the resonance wood provenance of stringed instruments from the Cherubini Conservatory Collection in Florence, Italy. J. Cult. Herit. 12:196–204.Search in Google Scholar
Boerjan, W. (2005) Biotechnology and the domestication of forest trees. Curr. Opin. Biotechnol. 16:159–166.Search in Google Scholar
Borghetti, M., Giannini, R., Menozzi, P. (1988) Geographic variation in cones of Norway spruce [Picea abies (L.) Karst.]. Silvae Genet. 37:178–184.Search in Google Scholar
Browning, B.L. (1967) Methods of Wood Chemistry: Volume I. Interscience (Wiley), New York. pp. 384.Search in Google Scholar
Bucci, G., Vendramin, G.G. (2000) Delineation of genetic zones in the European Norway spruce natural range: preliminary evidence. Mol. Ecol. 9:923–934.10.1046/j.1365-294x.2000.00946.xSearch in Google Scholar PubMed
Cao, T., Valsta, L., Harkonen, S., Saranpaa, P., Makela, A. (2008) Effects of thinning and fertilization on wood properties and economic returns for Norway spruce. Forest Ecol. Manag. 256:1280–1289.Search in Google Scholar
Caron, A., Altaner, C.M., Gardiner, B., Jarvis, M.C. (2013) Distribution of extractives in Sitka spruce (Picea sitchensis) grown in the northern UK. Eur. J. Wood Prod. 71:697–704.10.1007/s00107-013-0728-xSearch in Google Scholar
Casasoli, M., Derory, J., Morera-Dutrey, C., Brendel, O., Porth, I., Guehl, J.M., Villani, F., Kremer, A. (2006) Comparison of quantitative trait loci for adaptive traits between oak and chestnut based on an expressed sequence tag consensus map. Genetics 172:533–546.10.1534/genetics.105.048439Search in Google Scholar PubMed PubMed Central
Cornelius, J. (1994). Heritabilities and additive genetic coefficients of variation in forest trees. Can. J. Forest Res. 24:372–379.Search in Google Scholar
Cottrell, J.E., Munro, R.C., Tabbener, H.E., Milner, A.D., Forrest, G.I., Lowe, A.J. (2003) Comparison of fine-scale genetic structure using nuclear microsatellites within two British oakwoods differing in population history. Forest Ecol. Manag. 176:287–303.Search in Google Scholar
Dempster, A.P., Laird, N.M., Rubin, D.B. (1977) Maximum likelihood from incomplete data via the EM algorithm (with discussion). J. R. Stat. Soc. B 39:1–38.Search in Google Scholar
Denis, M., Favreau, B., Ueno, S., Camus-Kulandaivelu, L., Chaix, G., Gion, J.M., Nourrisier-Mountou, S., Polidori, J., Bouvet, J.M. (2013) Genetic variation of wood chemical traits and association with underlying genes in Eucalyptus urophylla. Tree Genet. Genomes 9:927–942.Search in Google Scholar
Dering, M., Lewandowski, A. (2009) Finding the meeting zone: where have the northern and southern ranges of Norway spruce overlapped? Forest Ecol. Manag. 259:229–235.10.1016/j.foreco.2009.10.018Search in Google Scholar
Driscoll, C.A., Menotti-Raymond, M., Nelson, G., Goldstein, D., O’Brien, S.J. (2002) Genomic microsatellites as evolutionary chronometers: a test in wild cats. Genome Res. 12:414–423.10.1101/gr.185702Search in Google Scholar PubMed PubMed Central
Franceschini, T., Lundqvist, S.O., Bontemps, J.D., Grahn, T., Olsson, L., Evans, R., Leban, J.M. (2012) Empirical models for radial and tangential fibre width in tree rings of Norway spruce in north-western Europe. Holzforschung 66:219–230.10.1515/HF.2011.150Search in Google Scholar
Gindl, W., Grabner, M., Wimmer, R. (2001) Effects of altitude on tracheid differentiation and lignification of Norway spruce. Can. J. Botany 79:815–821.10.1139/cjb-79-7-815Search in Google Scholar
Goncharenko, G., Kurm, M., Birgelis, J., Maaten, T., Tamm, U., Shevchenko, L. (2005) Isoenzymes’ structure of Norway Spruce (Picea abies (L.) Karst.) in Natural Populations in Estonia, Latvia and Byelorussia. Balt. For. 11:9–19.Search in Google Scholar
González-Martínez, S.C., Wheeler, N.C., Ersoz, E., Nelson, C.D., Neale, D.B. (2007) Association genetics in Pinus taeda L. I. Wood property traits. Genetics 175:399–409.10.1534/genetics.106.061127Search in Google Scholar PubMed PubMed Central
Goudet, J. (2002) FSTAT, a program to estimate and test gene diversities and fixation indices (version 2.9.3).Search in Google Scholar
Guerra, F.P., Wegrzyn, J.L., Sykes, R., Davis, M.F., Stanton, B.J., Neale, D.B. (2013). Association genetics of chemical wood properties in black poplar (Populus nigra). New Phytol. 197:162–176.Search in Google Scholar
Hakkila, P. (1968) Geographical variation of some properties of pine and spruce pulpwood in Finland. Commun. Inst. For. Fenn. 66:1–60.Search in Google Scholar
Haussmann, B.I.G., Parzies, H.K., Presterl, T., Susĭč, Z., Miedaner, T. (2004) Plant genetic resources in crop improvement. Plant Genet. Resour. 2:3–21.Search in Google Scholar
Heide, O.M. (1974) Growth and dormancy in Norway Spruce Ecotypes (Picea abies) I. Interaction of photoperiod and temperature. Physiol. Plantarum 30:1–12.10.1111/j.1399-3054.1974.tb04983.xSearch in Google Scholar
Hodgetts, R.B., Aleksiuk, M.A., Brown, A., Clarke, C., Macdonald, E., Nadeem, S., Khasa, D. (2001) Development of microsatellite markers for white spruce (Picea glauca) and related species. Theor. Appl. Genet. 102:1252–1258.Search in Google Scholar
Hoelzel, A.R., Fleischer, R.C., Campagna, C., Le Boeuf, B.J., Alvord, G. (2002) Impact of a population bottleneck on symmetry and genetic diversity in the northern elephant seal. J. Evol. Biol. 15:567–575.Search in Google Scholar
Höltken, A.M., Schröder, H., Wischniewski. N., Degen, B., Magel, E., Fladung, M. (2012) Development of DNA-based methods to identify CITES-protected timber species: a case study in the Meliaceae family. Holzforshung 66:97–104.Search in Google Scholar
Ivković, M., Gapare, W., Wu, H., Espinoza, S., Rozenberg, P. (2013) Influence of cambial age and climate on ring width and wood density in Pinus radiata families, Ann. For. Sci. 70:525–534.Search in Google Scholar
Jaakkola, T., Makinen, H., Saranpaa, P. (2006) Wood density of Norway spruce: responses to timing and intensity of first commercial thinning and fertilization. Forest Ecol. Manag. 237:513–521.Search in Google Scholar
Jaakkola, T., Mäkinen, H., Saranpää, P. (2007) Effects of thinning and fertilisation on tracheid dimensions and lignin content of Norway spruce. Holzforschung 61:301–310.10.1515/HF.2007.059Search in Google Scholar
Jyske, T., Kaakinen, S., Nilsson, U., Saranpää, P., Vapaavuori, E. (2010) Effects of timing and intensity of thinning on wood structure and chemistry in Norway spruce. Holzforschung 64:81–91.10.1515/hf.2010.013Search in Google Scholar
La Porta, N., Muccinelli, I., Passerotti, S. Valgimigli, M., Melnikova, M.N. (2007) Monitoring the genetic variability in Norway spruce populations in Europe. In: Proceedings of the Monitoring the Effectiveness of Biological Conservation. Eds. Innes, J.L., Timko J.A, Richmond. pp. 379–388.Search in Google Scholar
Lagercrantz, U., Ryman, N. (1990) Genetic structure of Norway spruce (Picea abies Karst.): concordance of morphological and allozymic variation. Evolution 44:38–53.Search in Google Scholar
Legendre, L., Legendre, P. (1983) Numerical Ecology. Elsevier, New York. pp. 419.Search in Google Scholar
Maghuly, F., Pinsker, W., Praznik, W., Fluch, S. (2006) Genetic diversity in managed subpopulations of Norway spruce [Picea abies (L.) Karst.]. Forest Ecol. Manag. 222:266–271.Search in Google Scholar
Mäkinen, H., Saranpää, P., Linder, S. (2002) Effect of growth rate on fibre characteristics in Norway spruce (Picea abies (L.) Karst.). Holzforschung 56:449–460.10.1515/HF.2002.070Search in Google Scholar
Manetti, M.C., Cutini, A. (2006) Tree-ring growth of Silver fir (Abies alba Mill.) in two stands under different silvicultural systems in central Italy. Dendrochronologia 23:145–150.10.1016/j.dendro.2005.11.002Search in Google Scholar
Mantel, N. (1967) The detection of disease clustering and a generalized regression approach. Cancer Res. 27:209–220.Search in Google Scholar
Miina, J. (2000) Dependence of tree-ring, earlywood and latewood indices of Scots pine and Norway spruce on climatic factors in eastern Finland. Ecol. Model. 132:259–273.10.1016/S0304-3800(00)00296-9Search in Google Scholar
Moore, J.R., Lyon, A.J., Searles, G.J. Vihermaa, L.E. (2009) The effects of site and stand factors on the tree and wood quality of Sitka spruce growing in the United Kingdom. Silva Fenn. 43:383–396.10.14214/sf.195Search in Google Scholar
Nei, M. (1973) Analysis of gene diversity in subdivided populations. Proc. Natl. Acad. Sci. USA 70:3321–3323.10.1073/pnas.70.12.3321Search in Google Scholar PubMed PubMed Central
Nei, M. (1978) Estimation of average heterozygosity and genetic distance from a small number of individuals. Genetics 76:379–390.10.1093/genetics/76.2.379Search in Google Scholar PubMed PubMed Central
Nei, M. (1987) Molecular Evolutionary Genetics. Columbia University Press, New York. pp. 512.10.7312/nei-92038Search in Google Scholar
Nocetti, M., Romagnoli, M. (2008) Seasonal cambial activity of spruce (Picea abies Karst.) with indented rings in the Paneveggio Forest (Trento, Italy). Acta Biol. Cracov. 50:27–34.Search in Google Scholar
Nowakowska, J.A. (2009) Mitochondrial and nuclear DNA differentiation of Picea abies populations in Poland. Dendrobiology 61:119–129.Search in Google Scholar
Nowakowska, J.A. (2011) Application of DNA markers against illegal logging as a new tool for the Forest Guard Service. FFP. series A, 53:142–149.Search in Google Scholar
Oleksyn, J., Prus-Glowacki, W., Giertych, M., Reich, P.B. (1994) Relation between genetic diversity and pollution impact in a 1912 experiment with East European Pinus sylvestris provenances. Can. J. Forest Res. 24:2390–2394.Search in Google Scholar
Park, Y.I., Spicker, H. (2005) Variation in the tree-ring structure of Norway spruce (Picea abies) under contrasting climates. Dendrochronologia 23:93–104.10.1016/j.dendro.2005.09.002Search in Google Scholar
Peter, G., Neale, D.B. (2004) Molecular basis for the evolution of xylem lignification. Curr. Opin. Plant Biol. 7:737–742.Search in Google Scholar
Pfeiffer, A., Olivieri, A.M., Morgante, M. (1997) Identification and characterization of microsatellites in Norway spruce (Picea abies K.). Genome 40:411–419.10.1139/g97-055Search in Google Scholar PubMed
Pielou, E.C. (1984) The Interpretation of Ecological Data. Wiley, New York. pp. 263.Search in Google Scholar
Pliura, A., Zhang, S.Y., MacKay, J., Bousquet, J. (2007) Genotypic variation in wood density and growth traits of poplar hybrids at four clonal trials. Forest Ecol. Manag. 238:92–106.Search in Google Scholar
Pokorný, R., Rajsnerová, P., Kubásek, J., Marková, I., Tomášková, I. (2012) Effect of early to latewood proportion on Norway spruce biomass. Acta Univ. Agric. et Silvic. Mendel. Brun. 37:287–292.Search in Google Scholar
Rachmayanti, Y., Leinemann, L., Gailing, O., Finkeldey, R. (2006) Extraction, amplification and characterization of wood DNA from Dipterocarpaceae Plant Mol. Biol. Rep. 24:45–55.Search in Google Scholar
Ramachandran, S., Deshpande, O., Roseman, C.C., Rosenberg, N.A., Feldman, M.W., Cavalli-Sforza, L.L. (2005) Support from the relationship of genetic and geographic distance in human populations for a serial founder effect originating in Africa. Proc. Natl. Acad. Sci. USA 102:15942–15947.10.1073/pnas.0507611102Search in Google Scholar PubMed PubMed Central
Rousset, F. (2008) Genepop’007: a complete reimplementation of the Genepop software for Windows and Linux. Mol. Ecol. Res. 8:103–106.Search in Google Scholar
Sandak, A., Sandak, J., Negri, M. (2011) Relationship between near-infrared (NIR) spectra and the geographical provenance of timber. Wood Sci. Techn. 45:35–48.Search in Google Scholar
Scotti, I., Magni, F., Fink, R., Powell, W., Binelli, G., Hedley, P.E. (2000) Microsatellite repeats are not randomly distributed within Norway spruce (Picea abies K.) expressed sequences. Genome 43:41–46.10.1139/g99-095Search in Google Scholar
Scotti, I., Magni, F., Paglia, G.P., Morgante, M. (2002) Trinucleotide microsatellites in Norway spruce (Picea abies): their features and the development of molecular markers. Theor. Appl. Genet. 106:40–50.10.1007/s00122-002-0986-1Search in Google Scholar PubMed
Scotti, I., Paglia, G., Magni, F., Morgante, M. (2006) Population genetics of Norway spruce (Picea abies Karst.) at regional scale: sensitivity of different microsatellite motif classes in detecting differentiation. Ann. For. Sci. 63:485–491.Search in Google Scholar
Skrøppa, T., Hylen, G., Dietrichson, J. (1999) Relationship between wood density components and juvenile height growth and growth rhythm trials for Norway spruce provenances and families. Silvae Genet. 48:235–239.Search in Google Scholar
Sneath, P.H.A., Sokal R.R. (1973) Numerical Taxonomy. Freeman, San Francisco. pp. 573.Search in Google Scholar
Sokal, R.R., Sneath P.H.A. (1963) Principles of Numerical Taxonomy. Freeman, San Francisco. pp. 359.Search in Google Scholar
Splechtna, B.E., Dobrý, J., Klinka, K. (2000) Tree-ring characteristics of subalpine fir (Abies lasiocarpa (Hook.) Nutt.) in relation to elevation and climatic fluctuations. Ann. For. Sci. 57:89–100.Search in Google Scholar
Taberlet, P., Fumagalli, L., Wust-Saucy, A.G., Cosson, J.F. (1998) Comparative phylogeography and postglacial colonization routes in Europe. Mol. Col. 10:257–263.Search in Google Scholar
Tappi standard (2006) T 222 om-06, Acid insoluble lignin in wood and pulp.Search in Google Scholar
Tappi standard (2007a) T 204 cm-07, Solvent extractives of wood and pulp.Search in Google Scholar
Tappi standard (2007b) T 211 om-07, Ash in wood, pulp, paper and paperboard: combustion at 525°C.Search in Google Scholar
Tappi standard (2007c) T 212 om-07, One percent sodium hydroxide solubility of wood and pulp.Search in Google Scholar
Tappi standard (2008) T 207 cm-08, Water solubility of wood and pulp.Search in Google Scholar
Tjoelker, M.G., Boratyński, A., Bugała, W. Eds. (1998) Biology and Ecology of Norway Spruce. Bogucki Wydawnictwo Naukowe, Poznan, Poland. pp. 469.Search in Google Scholar
Vendramin, G.G., Anizdei, M., Magadhiele, A., Sperisen, C., Bucci, G. (2000) Chloroplast microsatellite analysis reveals the presence of population subdivision in Norway spruce (Picea abies K.). Genome 43:68–78.10.1139/g99-093Search in Google Scholar
Weigel, D., Nordborg, M. (2005) Natural variation in Arabidopsis. How do we find the causal genes? Plant Physiol. 138:567–568.Search in Google Scholar
Weir, B.S. (1996) Genetic data analysis II. Sunderland, MA: Sinauer. pp. 44.Search in Google Scholar
Zahnen, J. (2014) Forensic methods used to verify the declared species and origin of wood. WWF Information, http://www.forestlegality.org/ accessed 08.09.2014.Search in Google Scholar
Zobel, B.J., van Buijtenen, J. (1989) Wood variation. Its causes and control. Springer-Verlag, Berlin Heidelberg, Germany. pp. 363.10.1007/978-3-642-74069-5Search in Google Scholar
Zobel, B.J., Jett, J.B. (1995) Genetics of Wood Production. Springer-Verlag, Berlin Heidelberg, Germany. pp. 337.10.1007/978-3-642-79514-5Search in Google Scholar
©2015 by De Gruyter
Articles in the same Issue
- Frontmatter
- Review Articles
- A large-scale test set-up for measuring VOC emissions from wood products under laboratory conditions in simulated real rooms
- Industrial waste water for biotechnological reduction of aldehyde emissions from wood products
- Original Articles
- Light scattering characterization of lignosulfonate structure in saline solutions
- Differences in wood properties of Picea abies L. Karst. in relation to site of provenance and population genetics
- Rapid determination of biomass and polypropylene in three types of wood plastic composites (WPCs) using FTIR spectroscopy and partial least squares regression (PLSR)
- Thermal modification of Southern pine combined with wax emulsion preimpregnation: effect on hydrophobicity and dimensional stability
- Mixed-mode fracture toughness of bond lines of PRF and PUR adhesives in European beech wood
- Effect of specimen dimension and pre-heating temperature on supercritical CO2 dewatering of radiata pine sapwood
- Sound absorption of wood-based materials
- Threshold for ion movements in wood cell walls below fiber saturation observed by X-ray fluorescence microscopy (XFM)
- Oxygen plasma treatment of bamboo fibers (BF) and its effects on the static and dynamic mechanical properties of BF-unsaturated polyester composites
- A combined view on composition, molecular structure, and micromechanics of fungal degraded softwood
- Morphological changes induced in wood samples by aqueous NaOH treatment and their effects on the conversion of cellulose I to cellulose II
- Young’s modulus and shear modulus of solid wood measured by the flexural vibration test of specimens with large height/length ratios
- Effects of cell wall ultrastructure on the transverse shrinkage anisotropy of Scots pine wood
- Short Note
- Reacted copper(II) concentrations in earlywood and latewood of micronized copper-treated Canadian softwood species