Activated carbon derived from spherical hydrochar functionalized with triethylenetetramine: synthesis, characterizations, and adsorption application
-
Hai Nguyen Tran
Hai Nguyen Tran is currently a PhD student at the Environmental Engineering Department, Chung Yuan Christian University, Taiwan. His recent publications focused on (1) the removal of cadmium from aqueous solutions using orange peel-derived biochar produced from different pyrolysis temperatures and times, (2) comparison of the calculation results of the thermodynamic parameters in the adsorption study by different methods, (3) preparation and characterization of various adsorbents (i.e. biosorbent, hydrochar, biochar, spherical carbon, activated carbon, surfactant modified zeolite, and Mg-Al LDHs intercalated with phenylalanine, tyrosine, and serine) for the removal of organic and inorganic contaminants from aqueous solutions, (4) preparation of activated carbon from a new chemical activation method.
https://www.researchgate.net/profile/Hai_Tran16 .Fu-Chuang Huang completed his PhD in Environmental Engineering at National Central University, Chung-Li, Taiwan. Currently, he is a faculty member at Nanya Institute of Technology, Chung-Li, Taiwan. His research interests are in soil pollution remediation, adsorption, wastewater treatment, and environmental education.
Chung-Kung Lee completed his PhD in Chemical Engineering at National Central University, Chung-Li, Taiwan. He has published more than 65 research articles as first and co-author in SCI journals. He received his BSc in Chemical Engineering from Taipei Institute of Technology, Taipei, Taiwan and his MSc in Chemical Engineering from National Central University, Chung-Li, Taiwan. Currently, he is a faculty member at University of Vanung, Chung-Li, Taiwan. His research interests are in fractal and chaos analysis, adsorption, catalysis and wastewater treatment.
https://www.researchgate.net/profile/Chung_Kung_Lee .Huan-Ping Chao completed his PhD in Graduate Institute of Environmental Engineering, National Central University, Chung-Li, Taiwan. He has published more than 35 research articles as first and co-author in SCI journals. Currently, he is a faculty member at Department of Environmental Engineering, Chung Yuan Christian University, Chung-Li, Taiwan. His research interests are in volatilization of organic compounds from water, and development of new adsorbents to remove contaminants in wastewater.
https://www.researchgate.net/profile/Huan-Ping_Chao .

Abstract
This study investigated the adsorption capacities of various contaminants on glucose-derived hydrochar (GH) and glucose-activated carbon (GAC) functionalized with triethylenetetramine (TETA). The two-stage synthesis process consisted of (1) hydrothermal carbonization using various TETA concentrations (1%–5%) to create TETA-functionalized GHs, and (2) chemical activation with NaOH to produce TETA-GACs. The basic properties of the adsorbents were examined using Brunauer-Emmett-Teller (BET) surface area analysis, Fourier transform infrared (FTIR) spectrometry, scanning electron microscopy (SEM), and energy dispersive X-ray (EDX) spectroscopy. The adsorption characteristics of the GH and GAC samples toward two heavy metal ions (Pb2+ and Cu2+), phenol, methylene green (MG5), and acid red 1 (AR1) were also examined. The results indicated that GAC1% and GH1% exhibited excellent adsorption capacities. Specifically, the maximum adsorption capacities of GAC1% and GH1% reached 370 mg/g and 128 mg/g for Pb2+, 208 mg/g and 84 mg/g for Cu2+, 196 mg/g and 137 mg/g for phenol, 175 mg/g and 67 mg/g for MG5, and 156 mg/g and 21 mg/g for AR1, respectively. In conclusion, amine functionalization on the surface of GHs and GACs efficiently enhances the removal capacities of various contaminants in water.
1. Introduction
Activated carbon (AC), with its exceptionally large specific surface area, high pore volume, well-developed internal porous structure, and abundant surface functional groups (polar characters), has been widely applied in various industrial processes. In water treatment, ACs are considered effective adsorbents for the removal of various organic contaminants. According to an industry market research report [1], the global demand for AC is estimated to increase 8.1% per year, and be up to 2.1 million metric tons by 2018. Nevertheless, the high cost of commercial ACs restricts their large-scale use in industries.
Notably, the morphology of AC plays a key role in its application; various conformations comprise powdered and granular AC, AC fibers, carbon monoliths, carbon hollow spheres, carbon nanotubes, and, carbon spheres [2]. Spherical carbon can be obtained through hydrothermal carbonization of diverse organic materials (polyvinylpyrrolidone, sucrose, xylose, fructose, furfural, glucose, starch, saccharose, and cellulose) in a controlled temperature autoclave (150–350°C) for 2–48 h at a specific pressure for producing hydrochar spherical microparticles [3], [4], [5], [6]. Hydrochars have been commonly tailored for manufacturing ACs with desired characteristics because of the unique attributions of hydrochar – namely a high density of oxygenated functional groups and a low degree of condensation and impurity [3]. Compared with other ACs, spherical ACs exhibit several enhanced characteristics such as high wear resistance, high mechanical strength, superior adsorption, high purity, low ash content, smooth surface, low pressure drop, high bulk density, high micropore volume, and controllable pore size distribution [2], [3].
d-glucose (a simple carbohydrate) is the most abundant sugar unit in biomass, and it is the major product of lignocellulosic biomass acid hydrolysis. Therefore, d-glucose is the most used precursor to produce hydrothermal carbonization [4]. A review of the extant literature revealed that the adsorption capacity of glucose-derived carbon spheres is enhanced by modifying their surfaces with various surfactants. For example, Demir-Cakan and others [7] prepared carbonaceous materials (hydrochar) through the hydrothermal carbonization of glucose in the presence of acrylic acid, and they concluded that carboxylate-rich absorbents were successfully employed for the removal of Cd2+ and Pb2+ from water. Wang and coworkers [8] reported on a one-step hydrothermal preparation of amino-functionalized carbon spheres (hydrochar) by mixing a glucose–ammonia solution at low temperature to improve their adsorption performance toward Cr(VI).
Various nitrogen sources, derived from nitrogen gas, ammonia, ammonia gas, amines, urea, pyridine, acetonitrile, melamine, dimethylformamide, 2-amino-4,6-dichloro-s-triazine, benzylamine, triethylenetetramine (TETA), ethylenediamine, and polyazomethineamide, have been used for synthesizing nitrogen-doped porous carbons [8], [9], [10], [11], [12], [13]. Of these, TETA has been widely applied as an effective cationic surfactant to modify an adsorbent’s surface; for example the effective adsorption of Cu2+, Cd2+, and Pb2+ from aqueous solutions by both succinylated twice-mercerized sugarcane bagasse and succinylated mercerized cellulose modified with TETA has been proposed by [12], [13]. Karnitz and colleagues [10] also compared the adsorption capacities of Cu2+, Cd2+, and Pb2+ from aqueous systems by sugarcane bagasse chemically modified with the polyamines ethylenediamine and TETA. In addition, Barsanescu and colleagues [14] investigated the effectiveness of using acrylic copolymer prepared from organic matrices with distinct crosslinking degrees, followed by ethylenediamine and TETA functionalization on the surface to remove Zn2+ ions. However, the characterizations of TETA-modified spherical and activated carbons derived from glucose and the efficiency of these adsorbents toward the removal of organic and inorganic contaminants have not been examined and reported elsewhere.
The current study synthesized a TETA-modified adsorbent to determine the adsorption of inorganic and organic compounds from aqueous solutions. Glucose-derived hydrochar (GH) samples, functionalized with various TETA concentrations (1%–5%), were prepared through hydrothermal carbonization of the glucose-TETA mixture, and they were subsequently used as the precursors to produce glucose-AC (GACs). The GAC samples with nitrogen groups on their surface were synthesized through a NaOH chemical activation of the GH samples; GH and GAC samples without TETA modification were also simultaneously prepared. In addition, the basic properties of the adsorbents were examined using several techniques (i.e. Brunauer-Emmett-Teller [BET] surface area, Fourier transform infrared [FTIR], and scanning electron microcopy-energy dispersive X-ray [SEM-EDX] analyses). Furthermore, the adsorption behaviors of GHs and GACs with and without a TETA-functionalized surface for two heavy metals (Pb2+ and Cu2+), phenol, a basic dye (methylene green 5 [MG5]), and an acid dye (acid red 1 [AR1]) were conducted in batch experiments.
2. Materials and methods
2.1. Preparation of adsorbents
The synthesis processes of carbonaceous adsorbents with and without surface modification are illustrated in Figure 1. First, a mixture of glucose and TETA powders (purchased from Merck) was completely dissolved in 150 ml of distilled water and then transferred into a 200-ml Teflon-lined autoclave. Mass ratios of glucose and TETA ranging from 1% to 5% were used for the modification. After a 48-h hydrothermal process at 190°C, the remaining brown precipitate (hydrochar) particles were separated using vacuum filtration, washed repeatedly with a 95% alcohol solution, and then washed in the distilled water until the pH of the filtrate reached approximately 7.0. The hydrochar samples were then collected and dried in an oven at 105°C for 24 h. For convenience, the GH samples modified with TETA were labeled GH5%, GH4%, GH3%, GH2%, and GH1%, according to the ratio of TETA to glucose. A GH sample without TETA (GH0%) was synthesized under the same conditions.
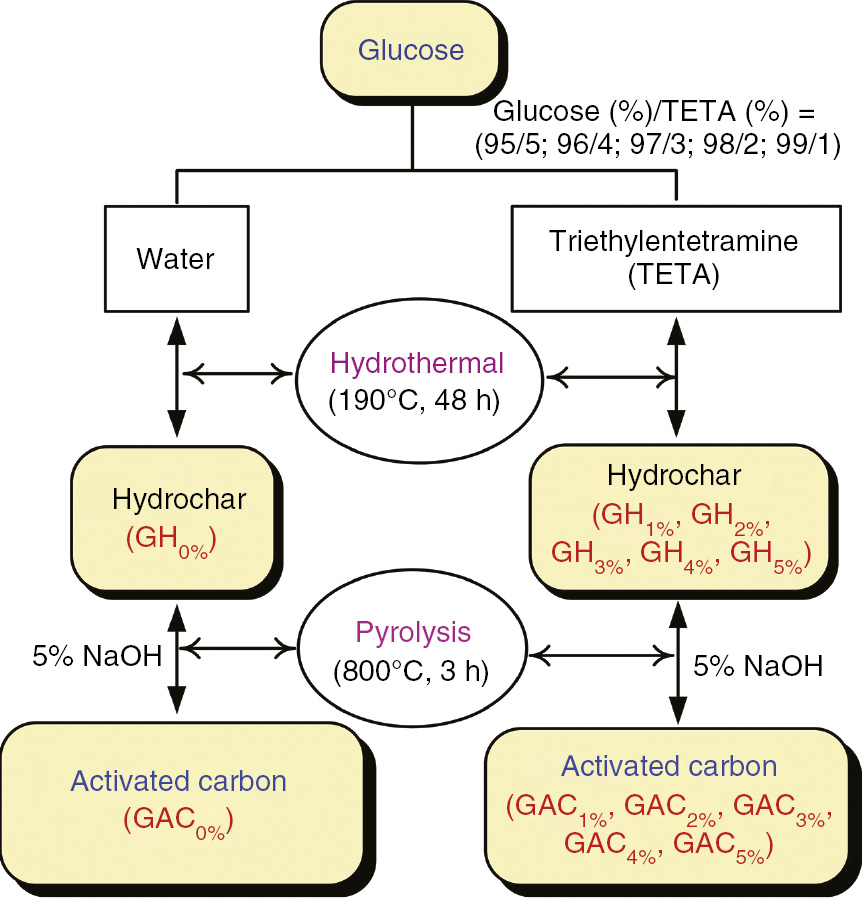
Schematic illustration of the preparation procedure for the adsorbents.
The AC was prepared by first impregnating approximately 10 g of the hydrochar sample with 100 ml of NaOH solution (5%). Next, the mixture of hydrochar and NaOH was dried in an oven at 105°C until the solution completely evaporated. The pyrolysis process was conducted in a column-type stainless steel tube in an inert atmosphere; subsequently, the tube was heated to 800°C at a heating rate of 5°C/min and the temperature was maintained for 3 h under a N2 flow rate of 100 ml/min. The GACs were washed with alcohol and the distilled water until the pH of the filtrate was approximately 7.0, and then they were dried in an oven at 105°C for 24 h. The final GAC samples were labeled according to their precursors (i.e. GAC5%, GAC4%, GAC3%, GAC2%, GAC1%, and GAC0%).
2.2. Adsorbent characterization
The textural properties of the GACs were obtained from a conventional analysis of nitrogen adsorption–desorption isotherms, which were measured at 77 K by a sorptometer (Micromeritics ASAP 2020). FTIR spectroscopy (FT/IR-6600 Jasco) was then performed to detect the functional groups present on the adsorbent surface, and the adsorbent particles mixed with KBr were subsequently pelleted. Finally, the morphology and element composition of the adsorbents were examined using SEM (S-3000N, Hitachi) at 10 kV and EDX spectroscopy (EDX), respectively.
2.3. Adsorptive isotherm experiment
Two metal ions (Pb2+ and Cu2+) and three organic compounds (phenol, AR1, and MG5) were selected as typical adsorbates to determine the adsorption characteristics of the GH and GAC samples. The chemical structures and basic properties of phenol, MG5, and AR1 are represented in Figure S1, and the basic and ionic properties of Cu2+ and Pb2+ are summarized in Table S1.
To avoid the precipitation of ionic salts and effect of dissociation on the selected organic solutes at high pH values, the initial pH values of the solutions were adjusted to 5.0±0.1. Approximately 0.2 g of the adsorbent was subsequently added to 50 ml of aqueous adsorbate solution in a Teflon centrifuge tube. To prevent adsorption competition, only a single adsorbate was added in the centrifuge tube. The centrifuge tubes were then placed in a reciprocating shaker with 180 rpm and equilibrated for 48 h at 30°C. After the completion of the adsorption process, each solution was centrifuged for 30 min and strained through a 0.2-μm filter. The concentrations of phenol, MG5, and AR1 were determined using ultraviolent-visible spectrophotometry (Genesys 10 UV-Vis; Thermo Scientific) at maximum wavelengths of 265 nm, 655 nm, and 530 nm, respectively. Atomic absorption spectrometry (Avanta, GBC) was used to determine the concentration of Pb2+ and Cu2+ ions.
Each experiment was performed in duplicate, and blank samples without the adsorbent were also conducted simultaneously. If the bias of the repeated experiment exceeded 15%, a triplicate run was performed. All chemicals used in this study were of analytical reagent grade.
3. Results and discussion
3.1. Characterization of adsorbents
3.1.1. Textural properties
Figure S2 depicts the variation of N2 adsorption-desorption isotherms for GACs synthesized with various glucose-TETA ratios, clearly indicating that the adsorption isotherms of all the GACs generated hysteresis loops. Isotherms are typically characterized by mesopores and macropores, with a small external surface area [15]; moreover, a wide-knee hysteresis loop was present in both the adsorption and desorption isotherms, appearing in the multilayer range of physical adsorption isotherms. According to the nomenclature of the International Union of Pure and Applied Chemistry, porous carbon materials exhibit an H4-type hysteresis loop, which is associated with narrow, slit-like pores. In addition, the AC sample without TETA (GAC0%) exhibits a relatively higher non-micropore volume (0.167 cm3/g) than the ACs samples modified with TETA (GAC1%−5%; 0.033–0.108 cm3/g). The reason is ascribed to TETA fills in the pores. The addition of TETA can alter the surface properties of GAC1%−5%.
Table 1 provides a summary of the corresponding textural parameters of the GACs. Increasing the TETA ratios resulted in a decreased surface area (SBET), non-micropore volume, and total pore volume, but an increase of the micropore volume. Furthermore, the average pore width decreased as the ratio of TETA increased, indicating that the GAC pore size was determined by the amount of TETA in the sample. As expected, the average pore size of GACs was a function of the proportion of the non-micropore (mesopore and macropore) volume.
Textural parameters of the glucose activated carbon (ACs) and commercial AC.
| GAC5% | GAC4% | GAC3% | GAC2% | GAC1% | GAC0% | CACa | |
|---|---|---|---|---|---|---|---|
| BET surface area (m2/g) | 260 | 313 | 256 | 288 | 233 | 335 | 768 |
| Langmuir surface area (m2/g) | 311 | 402 | 327 | 364 | 295 | 418 | – |
| External surface area (m2/g) | 69 | 113 | 115 | 135 | 151 | 195 | – |
| Micropore surface area (m2/g) | 191 | 200 | 141 | 153 | 82 | 140 | – |
| Total pore volume (cm3/g) | 0.110 | 0.144 | 0.149 | 0.169 | 0.137 | 0.217 | 0.43 |
| Micropore volume (cm3/g) | 0.077 | 0.088 | 0.058 | 0.061 | 0.029 | 0.050 | 0.21 |
| Non-micropore volume (cm3/g) | 0.033 | 0.056 | 0.091 | 0.108 | 0.108 | 0.167 | 0.22 |
| Micropore/total pore volume (%) | 70.27 | 60.88 | 38.78 | 36.25 | 20.98 | 22.98 | 48.84 |
| Average pore width (nm) | 1.692 | 1.843 | 2.332 | 2.343 | 2.354 | 2.588 | 1.63 |
Total pore volume=sum of micropore volume and non-micropore volume. aThe experimental data were published in [16]. BET, Brunauer-Emmett-Teller; CAC, commercial activated carbon ; GAC, glucose-activated carbon.
3.1.2. Morphological properties
The morphologies of GH0% and GAC0% are portrayed in Figure 2. The SEM images of both GH0% and GAC0% reveal interconnected spheres with relatively uniform sizes, smooth outer surfaces, and regular spherical shapes. According to a study by Sevilla and Fuertes [17], the formation of a carbon-rich solid through the hydrothermal carbonization of glucose is attributed to dehydration, condensation, or polymerization and aromatization reactions. In short, the carbon-rich hydrochar particle consists of two parts: a hydrophobic core comprising a highly aromatic nucleus, and a hydrophilic shell comprising a high concentration of reactive oxygen functional groups such as hydroxyl-phenolic, carbonyl, or carboxyl [17], [18].

Scanning electron microcopy-energy dispersive X-ray (SEM-EDX) spectra of the (A) glucose-derived hydrochar (GH)0% and (B) glucose-activated carbon (GAC)0% samples.
Figure 2 also indicates that GH0%exhibited a higher average diameter (0.82–0.92 μm) than that of GAC0% (0.38–0.43 μm), suggesting that the size of carbon spheres is narrowly affected by the chemical activation process; the SEM results also revealed that the spherical morphology of GAC0% possesses a similar particle size. This means that the regular shape of carbon spheres was still maintained after chemical activation. Interconnected particle properties of GH0%and GAC0% afforded more facile adsorbent separation from aqueous solutions (i.e. filtration with a microfilter) because of the overall increase in particle size [19].
As displayed in Figure 3, there were substantial changes to the surface morphology of the samples following TETA modification. The samples initially possessed extremely rough surfaces, and the results demonstrated that TETA was successfully grafted onto the surface of GAC during our experiment. Moreover, the morphologies of GH1% and GAC1% were nearly identical, again confirming that chemical activation with NaOH did not cause noticeable alterations to the morphology of GACs. Therefore, NaOH activation only modified the surface of GACs, without affecting the morphology and the bulk carbon core. This conclusion is consistent with findings in the extant literature [20].
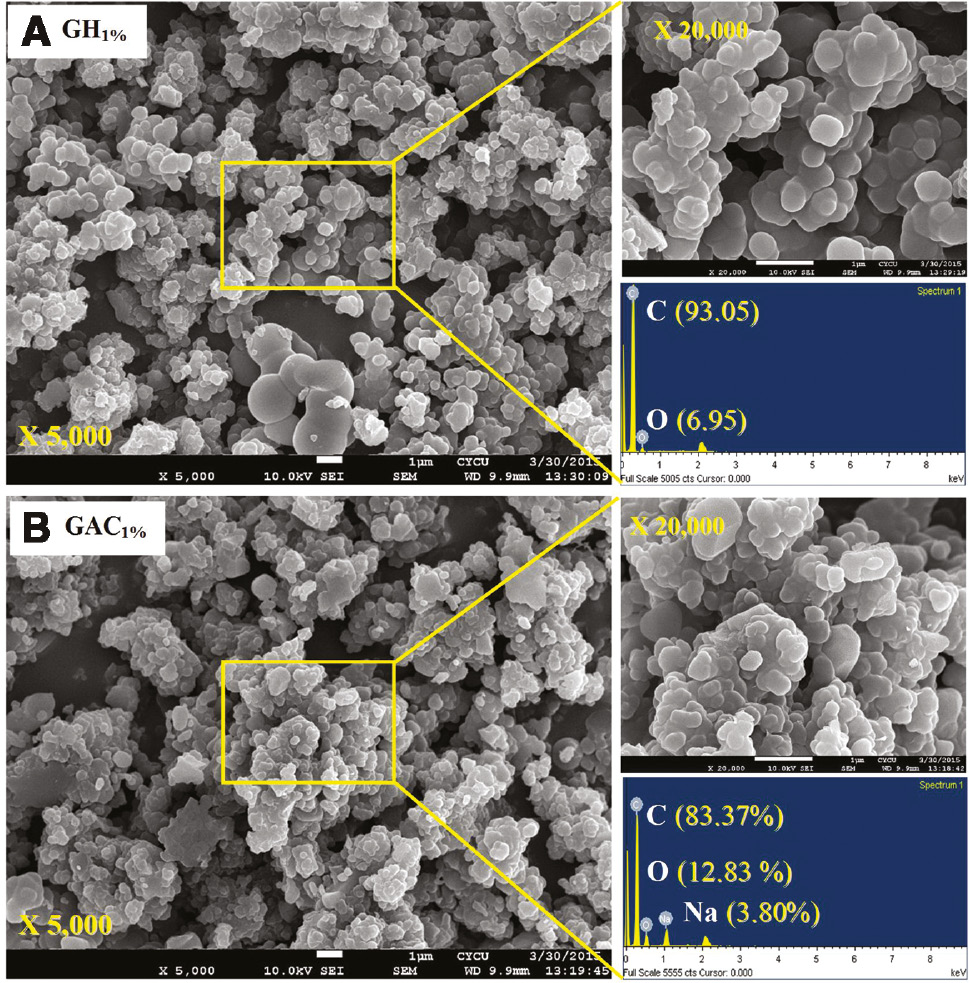
Scanning electron microcopy-energy dispersive X-ray (SEM-EDX) spectra of the (A) glucose-derived hydrochar (GH)1% and (B) glucose-activated carbon (GAC)1% samples.
The EDX spectra displayed in Figures 2 and 3 reveal that elements containing C and O are primary elements; for example, hydochar is a carbon-rich solid that is approximately 93–96% carbon. The higher percentage of Na in the GAC samples indicated that the presence of neither the functional hydrolyzed-carboxylic acid group (–COO–Na+ or –COO− under aqueous conditions) nor the functional hydrolyzed-phenolic group (–O–Na+ or –O− under aqueous conditions) was strongly correlated with the high cationic affinity of the GAC samples [19]. The presence of carboxylic and phenolic groups on the surface of GHs and GACs was additionally confirmed by the FTIR analysis results (Figure 4). Moreover, the higher percentage of oxygen in the GAC samples suggests that the GAC samples had more acidic functional groups than the GH samples. Noticeably, the percentage of N element is lower than the detection limitation because of low impregnation of TETA (only 1%); therefore it cannot be identified in EDX analysis.
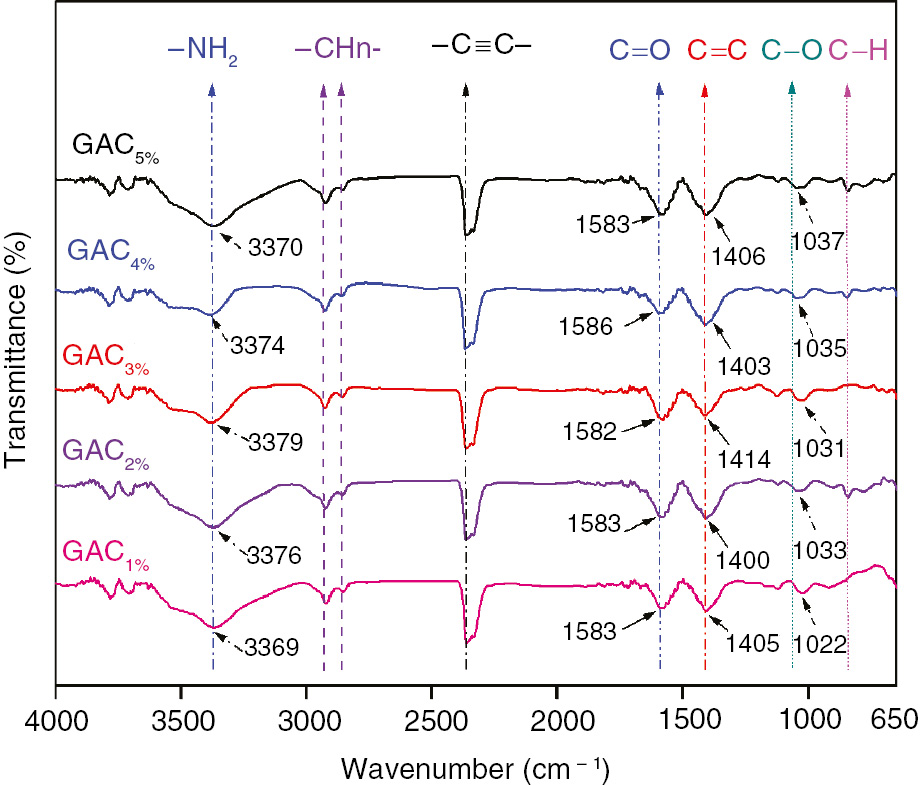
Fourier transform infrared (FTIR) spectra of the glucose activated carbon (AC) samples at various triethylenetetramine (TETA) impregnation ratios.
3.1.2. Functional group characterizations
The functional groups of GAC0% and its precursor (GH0%) were identified using FTIR (Figure S3). For the GH0% sample, two peaks identified at 1965 cm−1 and 1200 cm−1 were involved in the stretching of the C=O and C–O bonds in “pristine” carboxyl groups, respectively (Figure S3). Furthermore, the band at 1600 cm−1 is related to the aromatic C=C ring stretching motion, and the band at 3400 cm−1 confirms the presence of oxygen in hydrochar in the form of –OH. The presence of aromatic C–H out-of-plane bending vibrations is evident by the peak at 798 cm−1 (including aldol condensation and dehydration) [7]. As researchers have previously noted, the appearance of C=O groups on the surface of glucose hydrochar is due to the dehydration of equatorial hydroxyl groups [3], [17].
The FTIR spectrum of GAC0%(Figure S3) revealed similar peaks to those of GH0% (i.e. C=O, C=C, C–O, –OH, and C–H). New vibration bands at 2919 cm−1 and 2850 cm−1 corresponded to asymmetrical and symmetrical C–H, respectively. The peaks related to the carboxyl groups in GAC0% noticeably shifted toward lower wavelengths after the sample underwent chemical activation with NaOH, compared with the peaks in GH0% groups; specifically, the C=O and C–O peaks decreased from 1659 cm−1 to 1590 cm−1 and from 1200 cm−1 to 1030 cm−1, respectively. In addition, the marked increase in band intensity at 3390 cm−1 indicated that new –OH groups can form during chemical activation.
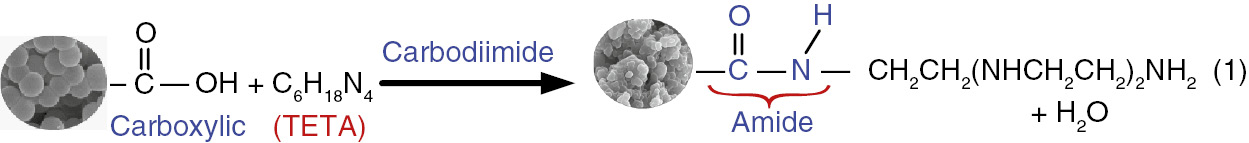
Qualitative information on the functional groups present on the TETA-modified GACx% surfaces and their spectroscopic assignments is displayed in Figure 4. The bands observed at approximately 3370 cm−1 are attributed to the stretching vibrations of the primary amine (–NH2) group overlapped with the stretching band in the hydroxyl groups (O–H) centered at 3400–3500 cm−1 [21]. The bands found in the 2800–3000 cm−1 range belong to asymmetrical and symmetrical C–H stretching vibrations of the methyl (–CH3–) and methylene (–CH2–) groups. The presence of a carbon-carbon triple bone (C≡C) in disubstituted alkynes can also be inferred from the bands in the range of 2250–2400 cm−1. The sharp peaks recognized between 1500 cm−1 and 1690 cm−1 are attributed to the stretching vibration of C=O in the secondary amide group [22] or –NH2 scissor frequencies [21], [23]. The C=O bond in the carboxyl group clearly shifted to lower wavelengths (i.e. deformation vibrations) after reaction with TETA. Specifically, the C=O bond in the pristine carboxyl group peaked at 1590 cm−1 (Figure S3), but after TETA modification, the peak decreased to approximately 1580 cm−1 (Figure 4). The bands observed at around 1400 cm−1 also reveal the aromatization (C=C) of the GACx% samples. Finally, the bands located between 960 cm−1 and 1130 cm−1 are characteristic of stretching C–O groups; the low intensity in these bands confirms the existence of strong reactions between pristine carboxyl groups and TETA. The reaction between the carboxyl groups and TETA, which converts the C=O in carboxyl groups into C=O in the amide groups, was introduced by Brady and Duncan [24] and occurs as follows:
3.2. Adsorption isotherms
In this study, the Langmuir model [Eq. (2)] and Freundlich model [Eq. (3)] were applied to describe the adsorptive behavior of the contaminants on the synthesized adsorbents:
where qe(mg/g) is the amount of adsorbate uptake at equilibrium (which was calculated from the mass balance equation), Ce (mg/l) is the adsorbate concentration at equilibrium, Qomax (mg/g) is the maximum saturated monolayer adsorption capacity of the adsorbent, KL (l/mg) is the Langmuir constant related to the affinity between an adsorbent and adsorbate, KF (mg/g)/(mg/l)1/n is the Freundlich constant (which characterizes adsorption strength), and 1/n (dimensionless; 0<n<10) is a Freundlich intensity parameter (which indicates the magnitude of the adsorption driving force or surface heterogeneity).
The coefficient of determination (R2) of the nonlinear optimization method was computed using the following equation:
where qe, exp(mg/g) is the amount of adsorbate adsorbed at equilibrium obtained from the experiment; qe, cal(mg/g) is the amount of adsorbate uptake determined from the model after using the Solver add-in, and qe, mean(mg/g) is the mean value of qe, exp [25].
The Langmuir and Freundlich parameters are described in Tables S2–S6. Notably, the determination coefficients (R2) of the Langmuir model were higher than those of the Freundlich in most of the cases, indicating that the adsorption characteristics of the contaminants in the GH and GAC samples were adequately described by the Langmuir model.
3.2.1. Adsorption isotherms for lead and copper
Figures 5 and 6 show the adsorption isotherms of Pb2+ and Cu2+ ions on the hydrochars and ACs at various impregnation ratios of TETA and glucose. After the surfaces of the GH samples were modified with TETA, the Qomax values of Pb2+ and Cu2+ increased by 29%–114% and 15%–245%, respectively. This result indicates that the TETA surfactant effectively bonds metal ions. The maximum adsorptive amounts of the Pb2+ions were ordered as follows: GH1%>GH3%>GH2%>GH4%>GH5%>GH0%. Conversely, the ordering of Cu2+adsorption was GH5%>GH1%≈GH3%>GH2%>GH0%. If the oxygen-containing groups on the surface of GH0% (–COOH and –OH) are assumed to take primary responsibility for binding Cu2+ and Pb2+ ions, the enhanced adsorption capacities of the metal cations for GH1%−5%are mainly attributable to the complex reactions between Cu2+ and Pb2+ ions with the amino groups (–NH2); other scholars have confirmed this finding [26], [27]. As expected, the GH samples exhibited higher adsorption capacities of Pb2+ and Cu2+ than the commercial AC did (Table 2).
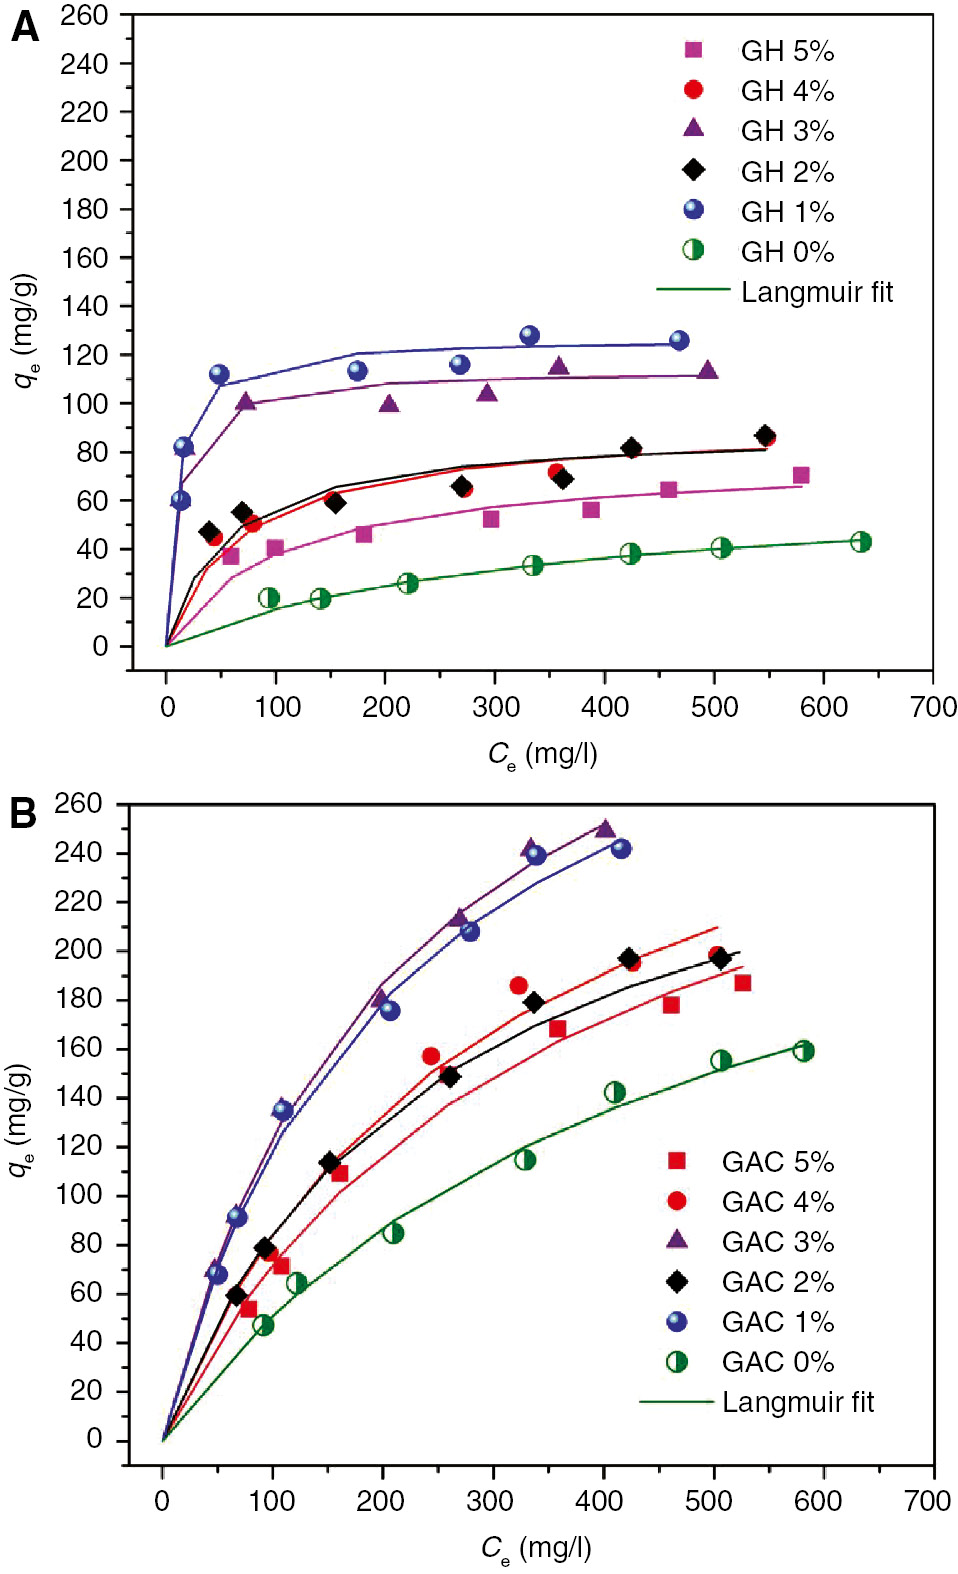
Adsorption isotherms of Pb2+ ions by various (A) glucose hydrochar and (B) activated carbon (AC) samples.
Adsorption isotherms of Cu2+ ions by various (A) glucose hydrochar and (B) activated carbon (AC) samples.
Maximum monolayer adsorption capacities (Qomax; mg/g) of the glucose-derived hydrochar (GH), glucose-activated carbon (GAC) and CAC samples toward Pb2+, Cu2+, phenol, methylene green 5 (MG5), and acid red 1 (AR1).
| Adsorbents | Pb(II) | Cu(II) | Phenol | MG5 | AR1 |
|---|---|---|---|---|---|
| GH5% | 77.5 (0.374) | 89.3 (1.405) | 38.2 (0.406) | 27.5 (0.064) | 17.0 (0.033) |
| GH4% | 93.5 (0.451) | 29.8 (0.468) | 63.3 (0.673) | 55.9 (0.129) | 30.2 (0.059) |
| GH3% | 115 (0.555) | 82.0 (1.290) | 74.6 (0.793) | 53.5 (0.124) | 17.6 (0.035) |
| GH2% | 90.9 (0.439) | 35.7 (0.562) | 104 (1.107) | 58.8 (0.136) | 33.1 (0.065) |
| GH1% | 128 (0.619) | 84.7 (1.334) | 137 (1.456) | 67.6 (0.156) | 36.1 (0.071) |
| GH0% | 59.9 (0.289) | 25.9 (0.408) | 11.4 (0.121) | 13.9 (0.032) | 21.2 (0.042) |
| GAC5% | 323 (1.557) | 250 (3.934) | 85.5 (0.908) | 27.4 (0.063) | 78.1 (0.153) |
| GAC 4% | 333 (1.609) | 244 (3.838) | 101 (1.073) | 52.9 (0.122) | 83.3 (0.164) |
| GAC 3% | 385 (1.856) | 213 (3.348) | 92.6 (0.984) | 59.2 (0.137) | 49.8 (0.098) |
| GAC 2% | 313 (1.508) | 244 (3.838) | 139 (1.476) | 86.2 (0.199) | 96.2 (0.189) |
| GAC 1% | 370 (1.788) | 227 (3.576) | 196 (2.084) | 101 (0.233) | 145 (0.284) |
| GAC 0% | 294 (1.420) | 208 (3.278) | 122 (1.296) | 175 (0.405) | 156 (0.307) |
| CACa | 25.1 (0.121) | 20.9 (0.252) | 219 (2.334) | 178 (0.411) | 129 (0.250) |
Values in parentheses are presented in mmol/g. aThe experimental data were published in [16] with the same operation conditions. AR1, acid red 1; CAC, commercial activated carbon; GAC, glucose-activated carbon; GH, glucose-derived hydrochar; MG5, methylene green 5.
The GAC1%−5% samples with TETA-modified surfaces possessed higher adsorption capacities toward heavy metals compared with their precursors (GH1%−5%), with increasing ratios of approximately 189–316% for Pb2+ and 160–720% for Cu2+ (Table 2). Notably, the adsorption capacity of GAC0% for Pb2+ and Cu2+ was greatly enhanced, compared with that of GH0%, increasing to 391% and 704%, respectively. The result demonstrates that chemical activation with NaOH can effectively increase the cation exchange capacity. Furthermore, other adsorption mechanisms – complex reactions with oxygen functional groups (–COOH and –OH) and pore filling – might improve the binding capacities for GACx% samples.
The Qomaxvalues of GACs modified with TETA are slightly higher than those without TETA, appropriately 6%–31% for Pb2+and 2%–20% for Cu2+. Therefore, we can conclude that neither amine groups had minor contributions in the adsorption mechanisms of the surface modified GACs samples nor several amine groups might be destroyed during the carbonization at 800°C. The maximum diminished theoretical adsorption capacities for Pb2+were ordered as follows: GAC3%>GAC1%>GAC4%>GAC5%>GAC2%>GAC0%; by contrast, the ordering of Cu2+ was GAC5%>GAC4%=GAC2%>GAC1%> GAC3%>GAC0%.
Generally, the adsorption efficiencies (Qomax; mmol/g) of Cu2+ were remarkably higher than those of Pb2+, in both GHx% and GACx% (Table 2). The adsorption amount order can be explained by the chemical properties of the ions (i.e. hydrated ionic radius, ionic potential, electronegativity, charge density, first hydrolysis equilibrium constant, and ionic radius) [28], which are summarized in Table S1.
As expected, most of the GH and GAC samples that were functionalized with TETA in this study provided greater adsorption capacities for Cu2+ and Pb2+ compared with commercial AC (Table 2) under the same experimental conditions, indicating that TETA is efficient in binding metal cations in the solutions.
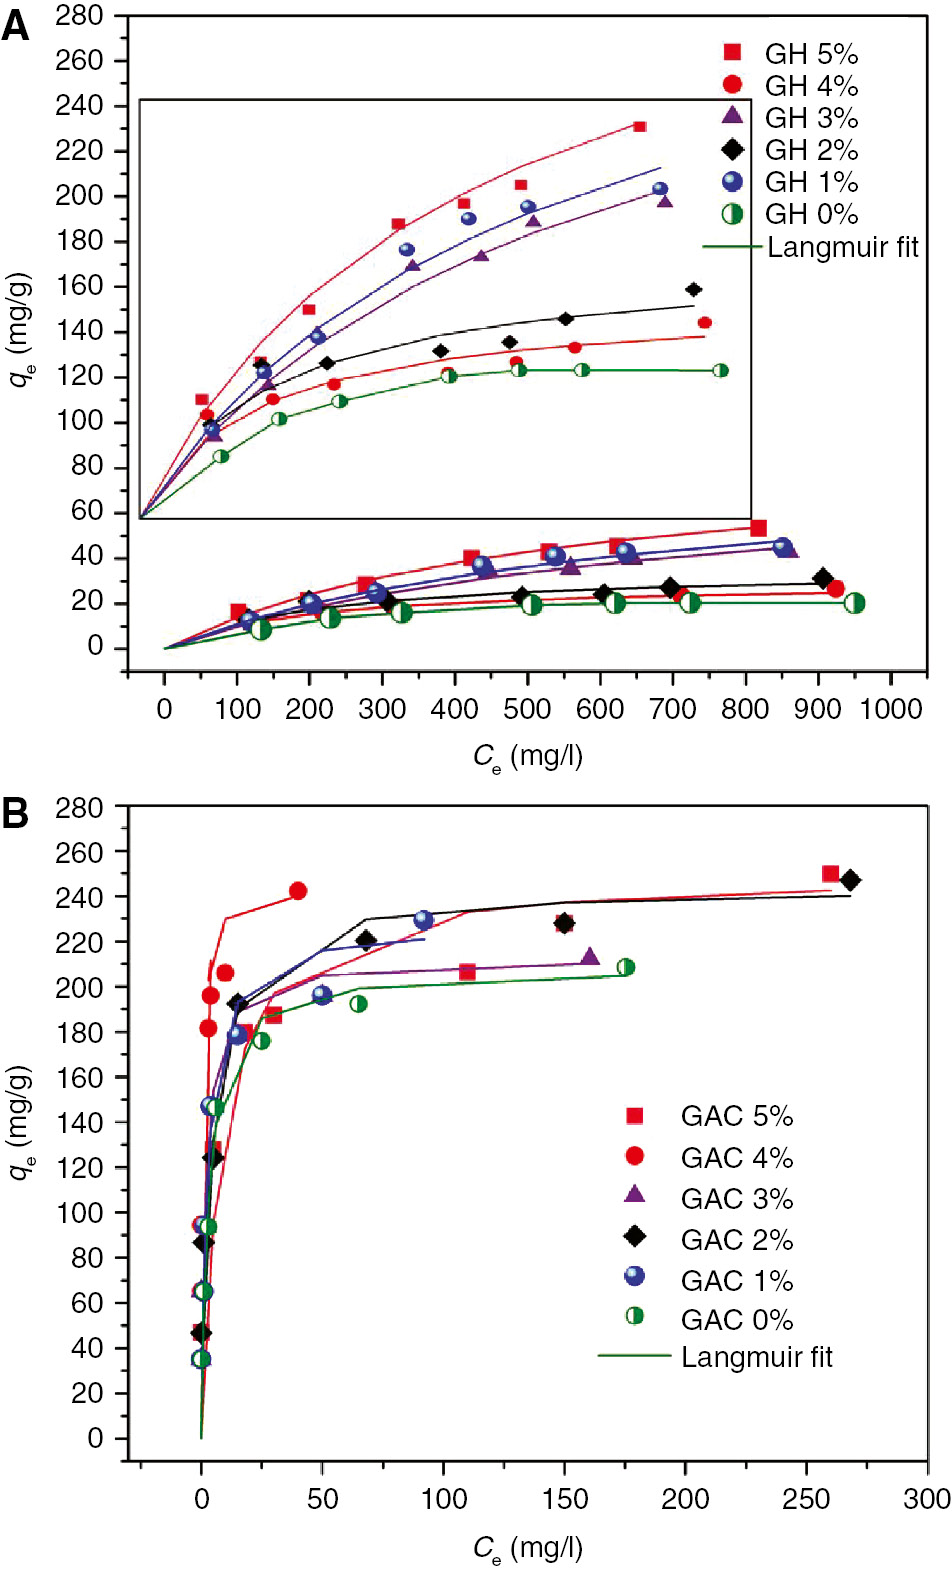
3.2.2. Adsorption isotherms for phenol, MG5, and AR1
The adsorption isotherms of phenol, MG5, and AR1 on the GH and GAC samples are depicted in Figures 7–9. For the samples modified with TETA (GH1%−5% and GAC1%−5%), their adsorption capacities toward phenol, MG5, and AR1 were inversely proportional to the glucose-TETA mass ratios (Table 2). The adsorption capacities of TETA-modified GACs decreased in the following order: GAC1%>GAC2%> GAC4%>GAC3%>GAC5% for phenol, GAC1%>GAC2%>GAC4%> GAC5%>GAC3% for AR1, and GAC1%>GAC2%>GAC3%>GAC4%>GAC5%for MG5. A similar decreasing tendency was found in the TETA-modified GH samples.

Adsorption isotherms of phenol by various (A) glucose hydrochar and (B) activated carbon (AC) samples.
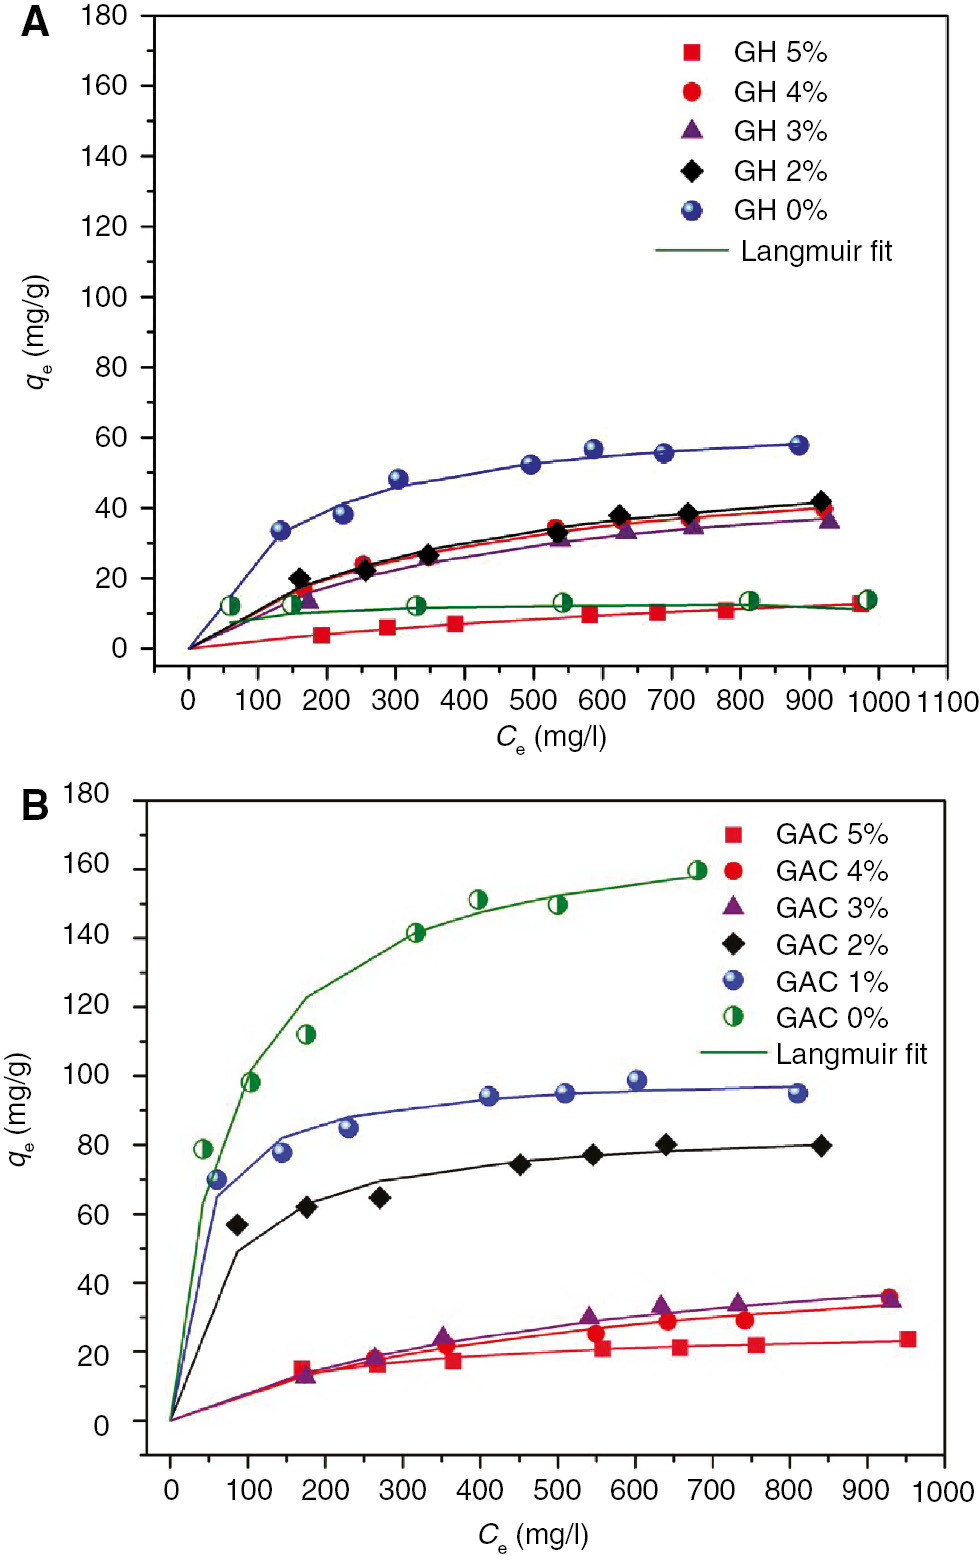
Adsorption isotherms of methylene green 5 (MG5) by various (A) glucose hydrochar and (B) activated carbon (AC) samples.
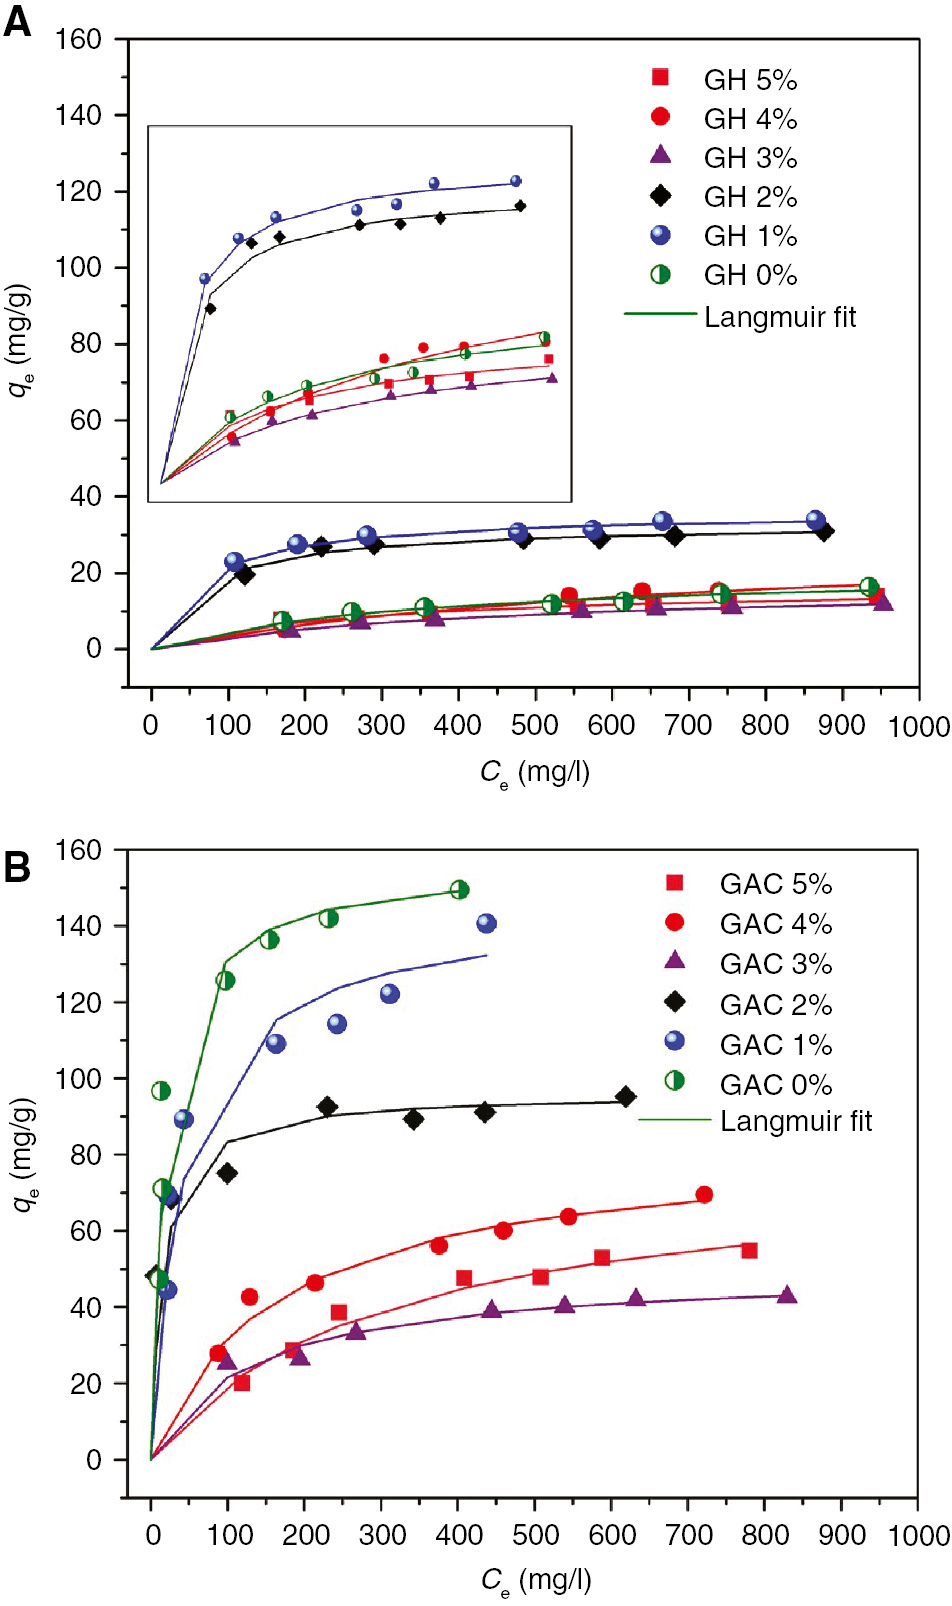
Adsorption isotherms of acid red 1 (AR1) by various (A) glucose hydrochar and (B) activated carbon (AC) samples.
Several possible mechanisms of the phenol compound adsorption have been postulated in the literature [29], [30], [31]: (1) electrostatic attractions, (2) π–π dispersion interactions, (3) hydrogen bonding, and (4) pore filling.
The mechanisms of electrostatic attractions between the positive protonated amine groups (–NH3+) on the surface of adsorbents and phenolate anions (C6H5O−) are not relevant to this study, and thus are not discussed. This is because the amine groups on the surface of adsorbents can be protonated to –NH3+ under an acidic condition (solution pH controlled at approximately 5.0), but the phenol, a very weak acid, exists primarily in a nondissociated form in water because its pKais approximately 9.89.
Dispersion interactions between the π-electron in phenol and the π-electron in carbon can be the dominant mechanism of adsorption in aromatic inorganic compounds. However, the π–π interaction is greatly affected by the π-electron density in the basal plane of the carbonous materials. The abundance of oxygen- and nitrogen-containing functional groups (i.e. the electron-withdrawing groups) on the surface of carbonous materials can result in a drop in π-electron density and adsorption sites in the basal planes (graphene layers) because of π-electron localization and withdrawal [31]. This explanation is valid for the GH0% sample, which has rich oxygen-bearing groups on its surface and possesses the lowest adsorption capacity (approximately 11 mg/g), and is consistent with the findings of other researchers [31], [32], [33]. Furthermore, increasing TETA ratios reduces adsorption capacities (Table 2 and Figure 7) because of an overabundance of amino groups linked to a smaller surface, which can weaken the π–π interactions between the aromatic rings of the adsorbate and the adsorbent matrix [34].
For hydrogen-bonding interactions (i.e. physical adsorption), it is necessary to classify the types of H-bonding formation. First, hydrogen bonding occurs between hydrogen from the hydroxyl group of phenol, and the oxygen complex on the surface of the adsorbent. Lorenc-Grabowska and colleagues [29] proposed that if hydrogen bond formation is the mechanism of phenol adsorption, a strong competition between water and phenol molecules at low phenol concentration leads to reduced adsorption capacity [30]; thus, water molecules are much more competitive in adsorbing on these groups compared with the hydrophobic phenol molecules [35]. However, concave downward adsorption isotherms were obtained for all the GH and GAC samples (Figure 7), indicating only a weak competition between phenol and water adsorption. Therefore, the hydrogen bond interaction in this study is negligible, evidenced in particular by the low adsorption capacity of GH0% (approximately 11 mg/g). Second, hydrogen bonding occurs between the nitrogen groups on the adsorbent surface and the hydroxyl group of the phenol; similar results are available in the literature [34]. Additionally, amine groups have a dominant role in the adsorption of phenolic compounds onto amine-modified hyper-crosslinked polymeric resin through hydrogen bonding. This mechanism can explain why the adsorption capacities of GH1%−2%and GAC1%−2%were higher than GH0% and GAC0%(Table 2 and Figure 7), respectively.
The phenol adsorption capacity of GAC0% (approximately 122 mg/g) was extremely higher than that of GH0% because of the pore filling mechanism, indicating that the micropore filling was the other central mechanism of phenol adsorption onto GAC0%. Phenol adsorption mainly occurs in micropores smaller than 1.4 nm, and the average pore width of the GAC0% sample in this study was 2.58 nm (Table 1); an analogous result has been noted in prior studies [16], [29]. Furthermore, nitrogenation introduces nitrogen-containing functional groups onto the carbon surface, such as –NH2, pyridinic, pyrrolic, and quaternary nitrogen groups [14], which enhance the basicity of the carbon surface [36]. Phenols are more strongly removed from a solution by a basic carbon than an acidic carbon [37]; therefore, the samples functionalized with TETA always exhibited higher adsorption capacities than did those without TETA (Table 2 and Figure 7).
The adsorption capacity of MG5 onto GAC0% (approximately 157 mg/g) was higher than that of GAC1%−5%(approximately 27.4–101 mg/g), which might be attributed to the higher cation exchange of GAC0% than GAC1%−5%; this coincides with the higher Na content on the GAC0% (5.61%) than GAC1% (3.80%) surfaces. As Romero and others [19] reported, ion exchange plays a critical role in the adsorption of MG1 onto NaOH-AC spheres with abundant surface-grafted functional groups.
The adsorption capacity of GAC0% (175 mg/g) for MG5 was nearly the same as that of commercial AC (178 mg/g) under the same experimental conditions; as Figure S5 illustrates, this study similarly found an excellent relationship between the maximum adsorption capacity (Qomax) of MG5 by GACs and non-micropore surface area (R2=0.97) and nonmicropore volume (R2=0.96). These correlated values demonstrate that the adsorption of MG5 by GACs was governed by non-micropore filling.
The maximum adsorption capacities of the TETA-modified hydrochar samples were nearly equal to those of the AC samples with TETA: GH5% (27.5 mg/g)≈GAC5% (27.4 mg/g), GH4% (55.9 mg/g)≈GAC4% (52.9 mg/g), and GH3% (53.5 mg/g)≈GAC2% (59.2 mg/g). This result indicates that TETA has a positive effect on the adsorption enhancement of MG5.
Clearly, the affinities of the GH samples toward AR1 were lower than those toward phenol and MG5, because the negative charge for AR1 can generate the repulsion forces of the functional groups (i.e. –COO−) on the hydrochar surface. If the amine groups (–NH2) on the hydrochar samples with TETA are completely protonated to –NH3+ under an acidic condition (pH=approximately 5.0), then the adsorption capacity of the hydrochar samples with TETA are enhanced because of electrostatic attraction. In this study, however, the amine groups (–NH2) on the TETA-modified hydrochar samples were not protonated to –NH3+ in the solution; therefore, the adsorption mechanisms of AR1 onto the hydrochar sample with TETA did not involve the amine groups through an anion exchange process, and the hydrogen bonding interactions between the nitrogen- and oxygen-containing functional groups on the dye molecule and the adsorbents’ surface might be responsible for the adsorption mechanisms [38], [39]. Similar to the adsorption of MG5, GAC0% (approximately 156 mg/g) also exhibited a higher affinity toward AR1 than GAC1%−5%(approximately 49–145 mg/g); moreover, the adsorption of AR1 by the GAC0% (156 mg/g) and GAC1% (145 mg/g) samples was higher than that of commercial AC (129 mg/g), indicating that GAC1% became an excellent adsorbent.
4. Conclusions
Synthesizing hydrochar and AC with a TETA-glucose mixture substantially changes the morphology of the modified hydrochar samples. Specifically, increasing TETA concentrations leads to a diminished surface area (SBET), non-micropore volume, and total pore volume in glucose ACs, and an increased micropore volume.
The adsorption capacities of the GH samples toward inorganic and organic compounds were considerably enhanced with TETA modification. Specifically, increasing TETA concentrations resulted in decreased adsorption capacities for the compound contaminants, with the GH1%sample exhibiting the highest affinity toward the contaminants. The maximum adsorption capacities (Qomax) of GH1%were ordered as follows: phenol (1.456 mmol/g)>Cu2+ (1.334 mmol/g)>Pb2+ (0.619 mmol/g)>MG1 (0.156 mmol/g)>AR1 (0.071 mmol/g).
The GAC samples exhibited even higher adsorption capacities than did their GH precursors and the commercial AC, with GAC1% reaching the highest adsorption capacity for most of the contaminants. The Qomax values of GAC1% for the contaminants were ordered as follows: Cu2+ (3.576 mmol/g)>phenol (2.084 mmol/g)>Pb2+ (1.788 mmol/g)>AR1 (0.284 mmol/g)>MG1 (0.233 mmol/g). These values are notably higher than the corresponding values of commercial AC.
About the authors

Hai Nguyen Tran is currently a PhD student at the Environmental Engineering Department, Chung Yuan Christian University, Taiwan. His recent publications focused on (1) the removal of cadmium from aqueous solutions using orange peel-derived biochar produced from different pyrolysis temperatures and times, (2) comparison of the calculation results of the thermodynamic parameters in the adsorption study by different methods, (3) preparation and characterization of various adsorbents (i.e. biosorbent, hydrochar, biochar, spherical carbon, activated carbon, surfactant modified zeolite, and Mg-Al LDHs intercalated with phenylalanine, tyrosine, and serine) for the removal of organic and inorganic contaminants from aqueous solutions, (4) preparation of activated carbon from a new chemical activation method. https://www.researchgate.net/profile/Hai_Tran16.
Fu-Chuang Huang completed his PhD in Environmental Engineering at National Central University, Chung-Li, Taiwan. Currently, he is a faculty member at Nanya Institute of Technology, Chung-Li, Taiwan. His research interests are in soil pollution remediation, adsorption, wastewater treatment, and environmental education.
Chung-Kung Lee completed his PhD in Chemical Engineering at National Central University, Chung-Li, Taiwan. He has published more than 65 research articles as first and co-author in SCI journals. He received his BSc in Chemical Engineering from Taipei Institute of Technology, Taipei, Taiwan and his MSc in Chemical Engineering from National Central University, Chung-Li, Taiwan. Currently, he is a faculty member at University of Vanung, Chung-Li, Taiwan. His research interests are in fractal and chaos analysis, adsorption, catalysis and wastewater treatment. https://www.researchgate.net/profile/Chung_Kung_Lee.

Huan-Ping Chao completed his PhD in Graduate Institute of Environmental Engineering, National Central University, Chung-Li, Taiwan. He has published more than 35 research articles as first and co-author in SCI journals. Currently, he is a faculty member at Department of Environmental Engineering, Chung Yuan Christian University, Chung-Li, Taiwan. His research interests are in volatilization of organic compounds from water, and development of new adsorbents to remove contaminants in wastewater. https://www.researchgate.net/profile/Huan-Ping_Chao.
Acknowledgments
This work was financially supported by Chung Yuan Christian University (CYCU), Taiwan. The first author would like to thank CYCU for the Distinguished International Graduate Students (DIGS) scholarship to pursue his doctoral studies.
Conflict of interest statement: The authors declare that no competing financial or other conflicts exist.
References
[1] Freedonia, World activated carbon - industry market research, market share, market size, sales, demand forecast, market leaders, company profiles, industry trends. Industry Studies and Freedonia Focus Report, 2014.Suche in Google Scholar
[2] Romero-Anaya AJ, Ouzzine M, Lillo-Ródenas MA, Linares-Solano A. Carbon 2014, 68, 296–307.10.1016/j.carbon.2013.11.006Suche in Google Scholar
[3] Jain A, Balasubramanian R, Srinivasan MP. Chem. Eng. J. 2016, 283, 789–805.10.1016/j.cej.2015.08.014Suche in Google Scholar
[4] Titirici MM, White RJ, Falco C, Sevilla M. Energy. Environ. Sci. 2012, 5, 6796–6822.10.1039/c2ee21166aSuche in Google Scholar
[5] Bedin KC, Martins AC, Cazetta AL, Pezoti O, Almeida VC. Chem. Eng. J. 2016, 286, 476–484.10.1016/j.cej.2015.10.099Suche in Google Scholar
[6] Mwenya T, Fan H, Dai H, Li M. Int. J. Photoenergy 2016, 2016, 1–5.10.1155/2016/9057418Suche in Google Scholar
[7] Demir-Cakan R, Baccile N, Antonietti M, Titirici M-M. Chem. Mater. 2009, 21, 484–490.10.1021/cm802141hSuche in Google Scholar
[8] Wang X, Liu J, Xu W. Colloids Surf. A 2012, 415, 288–294.10.1016/j.colsurfa.2012.09.035Suche in Google Scholar
[9] Chizari K, Vena A, Laurentius L, Sundararaj U. Carbon 2014, 68, 369–379.10.1016/j.carbon.2013.11.013Suche in Google Scholar
[10] Karnitz Jr O, Gurgel LV, de Melo JC, Botaro VR, Melo TM, de Freitas Gil RP, Gil LF. Bioresour. Technol. 2007, 98, 1291–1297.10.1016/j.biortech.2006.05.013Suche in Google Scholar PubMed
[11] Niasar HS, Li H, Kasanneni TVR, Ray MB, Xu C. Chem. Eng. J. 2016, 293, 189–199.10.1016/j.cej.2016.02.062Suche in Google Scholar
[12] Gurgel LVA, Gil LF. Water Res. 2009, 43, 4479–4488.10.1016/j.watres.2009.07.017Suche in Google Scholar PubMed
[13] Gurgel LVA, Gil LF. Carbohydr. Polym. 2009, 77, 142–149.10.1016/j.carbpol.2008.12.014Suche in Google Scholar
[14] Barsanescu A, Buhaceanu R, Dulman V, Bunia I, Neagu V. J. Appl. Polym. Sci. 2004, 93, 803–808.10.1002/app.20518Suche in Google Scholar
[15] Sing KS. Pure Appl. Chem. 1985, 57, 603–619.10.1351/pac198557040603Suche in Google Scholar
[16] Huang FC, Lee C-K, Han Y-L, Chao W-C, Chao H-P. J. Taiwan Inst. Chem. Eng. 2014, 45, 2805–2812.10.1016/j.jtice.2014.08.004Suche in Google Scholar
[17] Sevilla M, Fuertes AB. Chem. Eur. J. 2009, 15, 4195–4203.10.1002/chem.200802097Suche in Google Scholar PubMed
[18] Sevilla M, Fuertes AB. Carbon 2009, 47, 2281–2289.10.1016/j.carbon.2009.04.026Suche in Google Scholar
[19] Romero VJM, Tsai JF, Doma Jr, BT, Chao HP. Sustain. Environ. Res. 2014, 24, 339–347.Suche in Google Scholar
[20] Song X, Gunawan P, Jiang R, Leong SS, Wang K, Xu R. J. Hazard. Mater. 2011, 194, 162–168.10.1016/j.jhazmat.2011.07.076Suche in Google Scholar PubMed
[21] Lai L, Huang G, Wang X, Weng J. Carbon 2010, 48, 3145–3156.10.1016/j.carbon.2010.04.053Suche in Google Scholar
[22] Salehi E, Madaeni SS, Rajabi L, Vatanpour V, Derakhshan AA, Zinadini S, Ghorabi S, Ahmadi Monfared H. Sep. Purif. Technol. 2012, 89, 309–319.10.1016/j.seppur.2012.02.002Suche in Google Scholar
[23] Zhu J, Yang J, Deng B. J. Hazard. Mater. 2009, 166, 866–872.10.1016/j.jhazmat.2008.11.095Suche in Google Scholar
[24] Brady D, Duncan JR. Enzyme Microb. Technol. 1994, 16, 633–638.10.1016/0141-0229(94)90131-7Suche in Google Scholar
[25] Tran HN, You SJ, Chao HP. Waste Manage. Res. 2016, 34, 129–138.10.1177/0734242X15615698Suche in Google Scholar
[26] Chand P, Shil AK, Sharma M, Pakade YB. Int. Biodeterior. Biodegrad. 2014, 90, 8–16.10.1016/j.ibiod.2013.10.028Suche in Google Scholar
[27] Xiao B, Thomas KM. Langmuir 2005, 21, 3892–3902.10.1021/la047135tSuche in Google Scholar
[28] Petrov N, Budinova T, Khavesov I. Carbon 1992, 30, 135–139.10.1016/0008-6223(92)90072-5Suche in Google Scholar
[29] Lorenc-Grabowska E, Gryglewicz G, Diez MA. Fuel 2013, 114, 235–243.10.1016/j.fuel.2012.11.056Suche in Google Scholar
[30] Moreno-Castilla C. Carbon 2004, 42, 83–94.10.1016/j.carbon.2003.09.022Suche in Google Scholar
[31] Radovic LR, Baker FS. Carbon 1997, 35, 1339–1348.10.1016/S0008-6223(97)00072-9Suche in Google Scholar
[32] Mahajan OP, Moreno-castilla C, Walker PL. Sep. Sci. Technol. 1980, 15, 1733–1752.10.1080/01496398008055619Suche in Google Scholar
[33] Salame II, Bandosz TJ. J. Colloid Interface Sci. 2003, 264, 307–312.10.1016/S0021-9797(03)00420-XSuche in Google Scholar
[34] Li A, Zhang Q, Wu H, Zhai Z, Liu F, Fei Z, Long C, Zhu Z, Chen J. Adsorp. Sci. Technol. 2004, 22, 807–819.10.1260/0263617053499005Suche in Google Scholar
[35] Franz M, Arafat HA, Pinto NG. Carbon 2000, 38, 1807–1819.10.1016/S0008-6223(00)00012-9Suche in Google Scholar
[36] Yang G, Chen H, Qin H, Feng Y. Appl. Surf. Sci. 2014, 293, 299–305.10.1016/j.apsusc.2013.12.155Suche in Google Scholar
[37] Terzyk AP. J. Colloid Interface Sci. 2003, 268, 301–329.10.1016/S0021-9797(03)00690-8Suche in Google Scholar
[38] Li M, Wang H, Wu S, Li F, Zhi P. RSC Adv 2012, 2, 900–907.10.1039/C1RA00546DSuche in Google Scholar
[39] Ahmad R, Kumar R. J. Chem. Eng. Data 2010, 55, 3489–3493.10.1021/je1001686Suche in Google Scholar
Supplemental Material:
The online version of this article offers supplementary material (DOI: https://doi.org/10.1515/gps-2016-0178).
©2017 Walter de Gruyter GmbH, Berlin/Boston
This article is distributed under the terms of the Creative Commons Attribution Non-Commercial License, which permits unrestricted non-commercial use, distribution, and reproduction in any medium, provided the original work is properly cited.
Artikel in diesem Heft
- Frontmatter
- In this issue
- Cobalt supported on alumina as green catalyst for Biginelli reaction in mild conditions: effect of catalyst preparation method
- Carboxylation of phenol and its derivatives with sodium ethyl carbonate
- Green synthesis of MnO2 nanorods using Phyllanthus amarus plant extract and their fluorescence studies
- Isothermal green microwave-assisted extraction of caffeine from guarana: a kinetic study
- Activated carbon derived from spherical hydrochar functionalized with triethylenetetramine: synthesis, characterizations, and adsorption application
- Improving the efficiency of CaO-based sorbent by SrCO3 for high-temperature sulfur removal during coal combustion