Synthesis of Cu-BTC, from Cu and benzene-1,3,5-tricarboxylic acid (H3BTC), by a green electrochemical method
-
Nguyen Thu Phuong
Nguyen Thu Phuong received her Bachelor’s degree in Chemistry from Hanoi University of Education (HNUE) in 2008 and her Master of Science degree in Theoretical and Physical Chemistry from HNUE in 2010. Since 2010, she is a researcher at the Department of Corrosion and Protection of Metals, Institute for Tropical Technology (ITT), Vietnam Academy of Science and Technology (VAST). She has been a PhD student since 2013 and published more than 30 articles. Her present research concerns metal organic frameworks and biomedical materials.
Claudine Buess-Herman is director of the Analytical Chemistry and Interfacial Chemistry Laboratory, Faculty of Sciences, Université libre de Bruxelles. She has published 98 articles related to surface and interfacial chemistry, electrochemistry and surface analysis. She was President of The Belgian “Société Royale de Chimie” for the period 2014–2015. She is presently member of the editorial board of the European Journal
ChemElectroChem .Nguyen Thi Thom received her Bachelor’s degree in Chemistry from Hanoi University of Education in 2011 and her Master of Science degree in Theoretical and Physical Chemistry from the same university in 2013. Since 2014, she is a researcher at the Department of Corrosion and Protection of Metals, ITT, VAST. She has been a PhD student since 2015. Her present research is the synthesis of HAp/CNT nanocomposite coatings on biomedical alloys.
Pham Thi Nam works as a researcher at ITT, VAST since 2010. She has published more than 20 articles and reports in national and international journals, proceedings of national and international scientific conferences and workshops related to PbO2 and hydroxyapatite (HAp). In the past 5 years, she has done a PhD in the field of electrochemical depositing of HAp coating which is applied in the biomedical field.
Tran Dai Lam received his PhD in Physical Chemistry (Surface-Interface) from the University of Paris VII, Paris, France, in 2003. From 1998 to 2008, he was a research lecturer at Hanoi University of Technology. Since 2009, he is an associate professor at IMS. His current research interests include nanofabrications, characterizations and applications of nanobiomaterials in drug delivery systems and biosensors.
Dinh Thi Mai Thanh received her PhD from the University of Paris 6, France, in 2003. Beginning in 1994, she was an assistant researcher at the Department of Corrosion and Protection of Metals, ITT, VAST. Since 2010, she is an associate professor at ITT. Her current research interests include nanofabrication, characterization and application in bone implants.


Abstract
A metal organic framework (MOF) material based on Cu-BTC, which is formed from Cu and benzene-1,3,5-tricarboxylic acid (H3BTC), with 1D and 3D structures was synthesized under potential control. Cu-BTC 3D was electrodeposited at an applied potential of 5 V using tetrabutylammonium tetrafluoroborate (TBATFB) as electrolyte during 10–60 min. Hydration showed that the phase structure of Cu-BTC 3D did not change after a short time of immersing in water and that the specific surface area increased from 48 m2/g to 371 m2/g. In contrast, with a long time of hydration (more than 4 h), Cu-BTC was destroyed and a dehydration process could not recover the Cu-BTC structure.
1 Introduction
Metal organic frameworks (MOF) are a new materials with many remarkable advantages such as being porous, having a low density, high adsorption ability and high specific surface area, leading to many applications in gas storage, gas separation, gas purification, catalysis, supercapacitors, and electrode materials for batteries [1], [2], [3], [4], [5], [6], [7]. There are hundreds of types of MOF which have been synthesized by many different methods such as the mechanochemical method, solvothermal method, microwave method, chemical method and electrochemical method [1], [6], [8], [9], [10], [11], [12], [13], [14]. Cu-BTC, which is formed from Cu and benzene-1,3,5-tricarboxylic acid (H3BTC) is well known and is one of the MOF materials which has been studied by many scientists. We chose to synthesize MOF based on Cu-BTC, by an electrochemical method, since Cu is a common and cheap metal and this method is environmentally friendly, with no use of toxic solvent and a large amount of pure material can be obtained in a short time. Cu-BTC has many applications, namely in gas storage (hydrogen [1], methane, carbon dioxide [15]), gas separation [15], supercapicitors [2], catalysis [4], [5] and sensors [13]. Electrochemical methods, namely with applied current, applied potential or scanning potential processes, can be used to synthesize MOF. The morphology, structure and properties of MOF are affected by many factors in the synthesis process such as the organic ligand, the nature of metal ion, the solvent, temperature, pH, synthesis time, electrolyte and Cu-BTC treatment process such as a hydration process [12], [15]. Some research has shown that synthesized Cu-BTC has a small specific surface area or is unstable in water and that a hydration step can increase the Brunauer, Emmett and Teller (BET) specific surface area. This paper presents results obtained by the investigation of the effects of the electrolyte, the synthesis time, the hydration process and dehydration process on the morphology, structure, specific surface area and stability in water of MOF based on Cu-BTC synthesized by applying a controlled potential.
2 Materials and methods
Cu-BTC material was synthesized by applying a potential of 5 V/saturated calomel reference electrode (SCE) in a three electrode electrochemical cell containing 80 ml of a solution with a composition as follows:
with H3BTC (C9H6O6, M=210.14 g/mol, Merk (Hohenbrunn, Germany), 95% purity and TBATFB: tetrabutylammonium tetrafluoroborate (CH3CH2CH2CH2)4N(BF4), M=329.28 g/mol, 99% purity, Sigma-Aldrich). Methanol and NaNO3 are pure chemicals of China.
The cell includes an SCE, a working electrode (limited area: 10 cm2) and counter electrode both in Cu 99.61% with 20 mm×50 mm×3 mm in size. The chemical composition is shown in Table 1. The Cu electrode was mechanically polished by abrasive paper 400, 800, 1200 (Japan), rinsed by distilled water and solvent. The electrochemical experiments were conducted with Autolab equipment (AUT71290, Netherland).
Component of elements in Cu.
| Element | Cu | Zn | Pb | Sn | Mn | Fe | Ni | Si | Mg |
| % m | 99.61 | 0.251 | <0.01 | <0.03 | 0.0315 | 0.0119 | <0.005 | 0.0069 | <0.005 |
| Element | Cr | Al | As | Be | Ag | Co | Bi | Cd | |
| % m | <0.002 | 0.0232 | <0.0098 | <0.002 | <0.002 | 0.0363 | <0.02 | <0.005 |
The characteristic groups of Cu-BTC were identified by Fourier transform infrared spectroscopy in the range of wave numbers from 400 cm−1 to 3000 cm−1 with a NEXUS 6700 (Nicolet) equipment (USA), and the morphology was studied by SEM S4800 (Hitachi, Japan). The specific surface area of Cu-BTC was determined by the BET method using a Micromeritics TriStar 3000 V6.07A (USA). The thermal property of Cu-BTC was analyzed by the thermogravimetric analysis (TGA) method (DTG-60H, USA). From the X-ray diffraction pattern (Siemens D5000 Bruker, Germany), the phase structure of Cu-BTC and the distance between crystal planes d is determined. Cu-BTC 1D has a monoclinic structure [16], Cu-BTC 3D has a faced-centered cubic structure [6], [17] with a=b=c and α=β=γ=90°, and from the Miller index (hkl) of Cu-BTC 3D, we can determine the lattice parameter a following Eq. (1):
3 Results and discussion
3.1 Electrodeposition of Cu-BTC
Figure 1 presents the current intensity as a function of time during the synthesis process of Cu-BTC at 5 V/SCE in solution containing methanol+H3BTC 0.05 M+TBATFB 0.05 M (DD2). At the beginning, the current increases quickly due to the formation of copper ions on the electrode surface; after that, the current reaches a stable value at 0.420 A corresponding to the synthesis process of Cu-BTC.
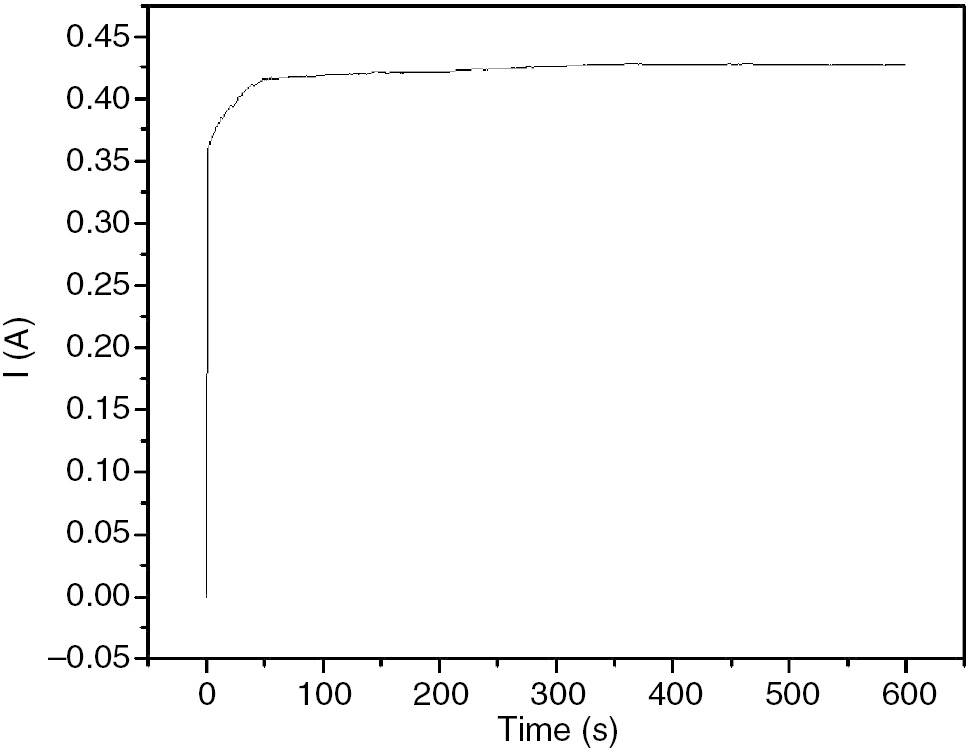
Current as a function of time during the synthesis process of Cu-BTC, formed from Cu and benzene-1,3,5-tricarboxylic acid (H3BTC), at E=5 V/saturated calomel reference electrode (SCE).
The IR spectrum of H3BTC (Figure 2) shows the appearance of the peaks at 1720 cm−1, 1180 cm−1 and 1270 cm−1 corresponding to stretching vibration of νC=O, νC-O and bending vibration of O-H, indicating the presence of an acid carboxylic group. The symmetric and antisymmetric stretching vibrations of O-C=O groups were in the range of 1400–1620 cm−1 [8] (Table 2). With Cu-BTC, the peaks in the range 1380–1630 cm−1 characterized for vibration of carboxylate groups. However, there are the appearance of peaks at 1710 cm−1, 1180 cm−1 and 1240 cm−1 corresponding to the vibrations of C=O, C-O and O-H groups with low intensity.

IR spectra of (A) benzene-1,3,5-tricarboxylic acid (H3BTC) and (B) Cu-BTC, formed from Cu and H3BTC.
The vibration group of CuBTC, formed from Cu and benzene-1,3,5-tricarboxylic acid (H3BTC).
| ν (cm−1) | H3BTC | Cu-BTC [8] | Cu-BTC |
|---|---|---|---|
| νC=O | 1720 | 1710 | 1710 |
| νC-O | 1180 | 1193 | 1180 |
| νO-H | 1270 | 1232 | 1240 |
| νO-C=O | 1400–1620 | 1300–1600 | 1380–1630 |
Phase structure analysis results (Figure 3) show that synthesized Cu-BTC has a 3D structure which is identified at 2θ: 6.7°, 9.5°, 11.6°, and 13.5°. To form the 3D structure, H3BTC needs to be deprotonated totally and the formed Cu2+ions to react with all of the three carboxylate groups. Thus, when dissolving in methanol, TBATFB, H3BTC was fully deprotonated. The IR spectrum of Cu-BTC shows a peak at 1240 cm−1 characteristic for the vibration of O-H groups. So, we can conclude that the obtained Cu-BTC still has impurities. In details, C3H5CuO2 was observed in the X-ray diffraction pattern at 2θ=24.1°. However, the content of impurities is little, as shown by the low intensity of the diffraction peak corresponding with C3H5CuO2. From the X-ray diffraction pattern, lattice parameter a=26.486 Ǻ was calculated [16].

X-ray diffraction pattern of Cu-BTC, formed from Cu and benzene-1,3,5-tricarboxylic acid (2-Cu-BTC 3D; 3-C3H5CuO2).
3.2 Influence of electrolyte
Solutions to synthesize Cu-BTC have a small conductivity and an electrolyte has to be added. In this part, we examine the influence of electrolyte NaNO3 and TBATFB on the morphology and phase structure of Cu-BTC synthesized in methanol at an applied potential of 5 V. Figure 4A presents IR spectra of Cu-BTC synthesized in a solution containing NaNO3 or TBATFB. The results show characteristic peaks for the vibration of groups in Cu-BTC (Table 2). The X-ray diffraction patterns (Figure 4B) indicate that, when using NaNO3, the obtained Cu-BTC has a 1D structure corresponding to 2θ=9.3°, 10°, 11°, and 11.31°. With TBATFB, the synthesized Cu-BTC has a 3D structure with formula Cu3(BTC)2 and characteristic values 2θ=6.6°, 9.4°, 11.6°, and 13.2° shown in Table 3 [11]. The deprotonation of H3BTC in solution was caused by the OH− group of methanol. In addition, the two electrolytes NaNO3 and TBATFB are soluble in methanol and generate two anions: NO3− and BF4−, respectively. These ions do not only increase the conductivity of solution but also have a nucleophilic property and an H3BTC deprotonation ability. Due to the stronger nucleophilic property of BF4− compared to NO3−, H3BTC was fully deprotonated in solution containing TBATFB, so that Cu2+ ions can react with 3 carboxyl groups of H3BTC to form Cu-BTC 3D. Meanwhile, H3BTC was only partly deprotonated in solution containing NaNO3 leading to Cu-BTC with a 1D structure.

(A) IR spectra and (B) X-ray diffraction pattern of Cu-BTC, formed from Cu and benzene-1,3,5-tricarboxylic acid, synthesized with different electrolytes (1-CuBTC 1D; 2-Cu-BTC 3D; 3-C3H5CuO2).
2θ, (hkl), distance between crystal plane d and lattice parameter a of Cu-BTC, formed from Cu and benzene-1,3,5-tricarboxylic acid, synthesized with electrolyte tetrabutylammonium tetrafluoroborate (TBATFB).
| 2 θ (°) [11] | 2 θ (°) synthesized Cu-BTC | (hkl) | d (Ǻ) | a (Ǻ) |
|---|---|---|---|---|
| 6.60 | 6.64 | 200 | 13.390 | 26.78 |
| 9.40 | 9.43 | 220 | 9.398 | 26.58 |
| 11.60 | 11.58 | 222 | 7.566 | 26.53 |
| 13.20 | 13.43 | 400 | 6.625 | 26.50 |
| 14.60 | 14.53 | 331 | 6.084 | 26.52 |
| 15.10 | 15.02 | 420 | 5.917 | 26.46 |
| 16.40 | 16.37 | 422 | 5.409 | 26.50 |
| 17.40 | 17.42 | 333 | 5.097 | 26.48 |
| 19.16 | 19.02 | 440 | 4.674 | 26.44 |
| 20.30 | 20.19 | 600 | 4.410 | 26.46 |
| 21.20 | 21.18 | 620 | 4.180 | 26.44 |
| a average | 26.52 | |||
From the X-ray diffraction pattern, the lattice parameter (a) of Cu-BTC 3D can be determined following Eq. (1), and the data are shown in Table 3. The lattice parameter (a) varies in the range 26.44–26.78 Ǻ, suitable with the result of Wojciech et al. [17] (26.346 Ǻ).
Figure 5 presents scanning electron microscopy images of Cu-BTC synthesized at 5 V with TBATFB or NaNO3. Cu-BTC has a nonuniform block shape with size from 50 nm to 900 nm when synthesized in solution containing TBATFB (Figure 5A). In the presence of NaNO3, the obtained Cu-BTC has a plate shape with large sizes from 100 nm to 3 µm (Figure 5B).

Scanning electron microscopy (SEM) images of Cu-BTC, formed from Cu and benzene-1,3,5-tricarboxylic acid, synthesized with (A) tetrabutylammonium tetrafluoroborate (TBATFB) and (B) NaNO3.
3.3 Influence of electrodeposition time
Electrodeposition time can affect the morphology and phase structure of Cu-BTC. Long synthesis time is advantageous for the growth of single crystals. Figure 6 presents X-ray diffraction patterns of Cu-BTC synthesized in DD2 during different times. All the characteristic peaks of Cu-BTC 3D structure can be observed (Table 4). This result shows that the electrodeposition time does not affect the phase structure of Cu-BTC 3D.

X-ray diffraction patterns of Cu-BTC, formed from Cu and benzene-1,3,5-tricarboxylic acid, synthesized in DD2 with different times: 10 min (A), 15 min (B), 25 min (C) and 60 min (D) (2-Cu-BTC 3D, 3-C3H5CuO2).
2θ values of Cu-BTC, formed from Cu and benzene-1,3,5-tricarboxylic acid, synthesized with different times.
| CuBTC 3D [11] | 6.60 | 9.40 | 11.60 | 13.20 | 14.60 | 15.10 | 16.40 | 17.40 | 19.16 | 20.30 | 21.20 |
| Synthesis time (min) | |||||||||||
| 10 | 6.64 | 9.41 | 11.52 | 13.41 | 14.56 | 14.93 | 16.40 | 17.36 | 18.99 | 20.14 | 21.24 |
| 15 | 6.63 | 9.39 | 11.65 | 13.36 | 14.62 | 14.99 | 16.64 | 17.43 | 19.01 | 20.16 | 21.24 |
| 25 | 6.67 | 9.45 | 11.61 | 13.41 | 14.54 | 14.99 | 16.44 | 17.47 | 19.07 | 20.23 | 21.26 |
| 60 | 6.67 | 9.42 | 11.53 | 13.39 | 14.60 | 14.95 | 16.40 | 17.39 | 18.95 | 20.14 | 21.24 |
From the X-ray diffraction pattern, the lattice parameter (a) of Cu-BTC with different synthesis times can be calculated (Table 5). When the reaction time increases, the lattice parameter (a) increases slightly and the size of crystal rises.
(hkl), distance between crystal planes d and lattice parameter (a) of Cu-BTC, formed from Cu and benzene-1,3,5-tricarboxylic acid, synthesized with different electrodeposition times.
| (hkl) | d (Ǻ) | a (Ǻ) | ||||||
|---|---|---|---|---|---|---|---|---|
| 10 min | 15 min | 25 min | 60 min | 10 min | 15 min | 25 min | 60 min | |
| 200 | 13.12 | 13.250 | 13.33 | 13.37 | 26.24 | 26.50 | 26.66 | 26.74 |
| 220 | 9.319 | 9.374 | 9.399 | 9.402 | 26.36 | 26.51 | 26.58 | 26.59 |
| 222 | 7.608 | 7.640 | 7.651 | 7.663 | 26.35 | 26.47 | 26.50 | 26.55 |
| 400 | 6.593 | 6.601 | 6.628 | 6.631 | 26.37 | 26.40 | 26.51 | 26.52 |
| 331 | 6.043 | 6.605 | – | 6.081 | 26.34 | 26.44 | – | 26.51 |
| 420 | 5.894 | 5.908 | 5.922 | 5.933 | 26.36 | 26.42 | 26.48 | 26.53 |
| 422 | 5.385 | 5.388 | 5.394 | 5.405 | 26.38 | 26.40 | 26.43 | 26.48 |
| 333 | 5.080 | 5.079 | 5.089 | 5.097 | 26.40 | 26.39 | 26.44 | 26.48 |
| 440 | 4.665 | 4.671 | 4.672 | 4.684 | 26.40 | 26.42 | 26.43 | 26.50 |
| 600 | 4.398 | 4.403 | 4.404 | 4.580 | 26.39 | 26.42 | 26.42 | 26.59 |
| 620 | 4.173 | 4.172 | 4.197 | 4.410 | 26.39 | 26.41 | 26.43 | 26.55 |
| a average | 26.36 | 26.43 | 26.49 | 26.55 | ||||
To study the effect of the reaction time on the formation of Cu-BTC 1D, we electrodeposited Cu-BTC in DD1 with an applied potential of 5 V/SCE during 10 min and 60 min. The X-ray diffraction patterns of Cu-BTC synthesized in DD1 with different times are shown in Figure 7.

X-ray diffraction patterns of Cu-BTC, formed from Cu and benzene-1,3,5-tricarboxylic acid, synthesized in DD1 with an applied potential of 5 V/saturated calomel reference electrode (SCE) during (A) 10 min and (B) 60 min (1-Cu-BTC 1D, 3-C3H5CuO2, 4-C8H4CuO4·3H20, 5-C6H5Cu, 6-C4H4CuO4·2H2O).
When the electrodeposition time was 10 min, Cu-BTC 1D was obtained with characteristic peaks at 2θ=9.23°, 9.9°, 10.9°, and 13.5°; in addition, there were peaks of C3H5CuO2. However, for a long synthesis time (60 min), the product is not Cu-BTC, but a mixture of other compounds of copper: C8H4CuO4·3H2O, C6H5Cu, C4H4CuO4·2H20. This can be explained that when the synthesis time is long, there is a reaction of H2O that destroys the structure of Cu-BTC-1D [16].
3.4 Influence of hydration process on Cu-BTC 3D
Cu-BTC 3D which was synthesized in methanol+H3BTC 0.05 M+TBATFB 0.05 M during 10 min at a potential of 5 V/SCE, was rinsed with methanol. After that one part was dried at 40°C (1) and other parts were immersed in water during different times: 0 min (2), 20 min (3), 30 min (4), 4 h (5), 13 h (6), 18 h (7) and 24 h (8). Thereafter, the samples were put in a vacuum for drying at room temperature, and pressure 250 mBar during 24 h. We observed that: Cu-BTC expands after immersing in water. The hydration step can increase the specific surface area, the size and the volume of the pores of Cu-BTC, but it can lead to a reaction of water with open copper sites and change the phase structure of Cu-BTC when the hydration time is long enough [18]. Figure 8 presents IR spectra of Cu-BTC with different hydration times. In general, IR spectra have similar shapes, with the appearance of characteristic peaks for the vibrations in molecular Cu-BTC as shown in Table 2.
![Figure 8: IR spectra of Cu-BTC, formed from Cu and benzene-1,3,5-tricarboxylic acid, under the effect of hydrate process [dry at 40°C (1), immersion 0 min (2), 20 min (3), 30 min (4), 4 h (5), 13 h (6), 18 h (7) and 24 h (8)].](/document/doi/10.1515/gps-2016-0096/asset/graphic/j_gps-2016-0096_fig_008.jpg)
IR spectra of Cu-BTC, formed from Cu and benzene-1,3,5-tricarboxylic acid, under the effect of hydrate process [dry at 40°C (1), immersion 0 min (2), 20 min (3), 30 min (4), 4 h (5), 13 h (6), 18 h (7) and 24 h (8)].
X-ray diffraction patterns of Cu-BTC immersed in water (Figure 9) show that the hydration process affects the phase structure of Cu-BTC. Cu-BTC after filtering, rinsing, drying at 40°C (1) or immersing in water during short times [0 min (2), 20 min (3), 30 min (4)] still present a 3D structure with characteristic 2θ values. From the X-ray diffraction pattern d values at 2θ values corresponding to different (hkl) planes, the lattice parameter (a) of Cu-BTC 3D can be calculated (Table 6). These values are in agreement with the lattice parameter value 26.346 Ǻ of Wojciech et al. [17]. However, when the product is immersed in water during longer times: 4 h, 13 h, 18 h and 24 h, the phase structure of Cu-BTC was changed. In X-ray diffraction patterns, the characteristic peaks of Cu-BTC 3D do not appear. These peaks characterized for C8H4CuO4.3H20, C6H5Cu and C4H4CuO4·2H2O at 2θ values: 7.81°, 9.07°, 11.36°, and 12.03° (Table 7) were, however, observed.
![Figure 9: X-ray diffraction patterns of hydrated Cu-BTC, formed from Cu and benzene-1,3,5-tricarboxylic acid, [dry at 40°C (A), immersion during 0 min (B), 20 min (C), 30 min (D), 4 h (E), 13 h (F), 18 h (G) and 24 h (H)] (2-Cu-BTC 3D; 3-C3H5CuO2; 4-C8H4CuO4·3H2O; 5-C6H5Cu; 6-C4H4CuO4·2H2O).](/document/doi/10.1515/gps-2016-0096/asset/graphic/j_gps-2016-0096_fig_009.jpg)
X-ray diffraction patterns of hydrated Cu-BTC, formed from Cu and benzene-1,3,5-tricarboxylic acid, [dry at 40°C (A), immersion during 0 min (B), 20 min (C), 30 min (D), 4 h (E), 13 h (F), 18 h (G) and 24 h (H)] (2-Cu-BTC 3D; 3-C3H5CuO2; 4-C8H4CuO4·3H2O; 5-C6H5Cu; 6-C4H4CuO4·2H2O).
2θ value, (hkl), distance between crystal plane d and lattice parameter a of Cu-BTC 3D, formed from Cu and benzene-1,3,5-tricarboxylic acid, dry at 40°C (A), immersion 0 h (B), 20 min (C) and 30 min (D).
| 2 θ [11] | (hkl) | d (Ǻ) | a (Ǻ) | ||||||
|---|---|---|---|---|---|---|---|---|---|
| (A) | (B) | (C) | (D) | (B) | (C) | (D) | |||
| 6.60 | 200 | 13.140 | 13.250 | 13.120 | 13.33 | 26.280 | 26.500 | 26.240 | 26.660 |
| 9.40 | 220 | 9.313 | 9.374 | 9.319 | 9.399 | 26.340 | 26.514 | 26.358 | 26.580 |
| 11.60 | 222 | 7.589 | 7.640 | 7.608 | 7.651 | 26.290 | 26.466 | 26.355 | 26.504 |
| 13.20 | 400 | 6.575 | 6.601 | 6.593 | 6.628 | 26.300 | 26.404 | 26.372 | 26.512 |
| 14.60 | 331 | 6.037 | 6.065 | 6.043 | – | 26.315 | 26.437 | 26.341 | – |
| 15.10 | 420 | 5.880 | 5.908 | 5.894 | 5.922 | 26.296 | 26.420 | 26.359 | 26.484 |
| 16.40 | 422 | 5.374 | 5.388 | 5.385 | 5.394 | 26.330 | 26.396 | 26.381 | 26.425 |
| 17.40 | 333 | 5.072 | 5.079 | 5.080 | 5.089 | 26.355 | 26.390 | 26.96 | 26.443 |
| 19.16 | 440 | 4.655 | 4.671 | 4.665 | 4.672 | 26.333 | 26.420 | 26.89 | 26.430 |
| 20.30 | 600 | 4.393 | 4.403 | 4.398 | 4.404 | 26.358 | 26.418 | 26.388 | 26.424 |
| 21.20 | 620 | 4.164 | 4.172 | 4.173 | 4.179 | 26.335 | 26.405 | 26.392 | 26.430 |
| a average | 26.321 | 26.336 | 26.352 | 26.489 | |||||
2θ value of Cu-BTC, formed from Cu and benzene-1,3,5-tricarboxylic acid, hydrate with long time: 4 h (E), 13 h (F), 18 h (G) and 24 h (H).
| Cu-BTC | 2θ (°) | ||||||||||
|---|---|---|---|---|---|---|---|---|---|---|---|
| (E) | 7.7 | 9.0 | 12.0 | 15.8 | 16.3 | 18.1 | 18.8 | 19.4 | 21.2 | 22.8 | 24.2 |
| (F) | 7.8 | 9.1 | 12.1 | 15.8 | 16.3 | 18.2 | 18.8 | 19.4 | 21.2 | 22.9 | 24.3 |
| (G) | 7.9 | 9.1 | 12.0 | 15.9 | 16.3 | 18.2 | 18.7 | 19.4 | 21.3 | 22.9 | 24.3 |
| (H) | 7.7 | 9.0 | 12.1 | 15.8 | 16.4 | 18.1 | 18.7 | 19.5 | 21.3 | 22.8 | 24.2 |
To confirm the effect of the hydration process on the specific surface area, Cu-BTC 3D and Cu-BTC 3D synthesized at applied potential 5 V/SCE during 10 min were hydrated during 20 min and their specific surface area was determined by the adsorption of nitrogen (N2).
Figure 10A and B present the N2 adsorption isotherm curves of Cu-BTC 3D and Cu-BTC 3D hydrated during 20 min. The adsorption and desorption curves nearly match, therefore Cu-BTC may be considered as a type of microcapillary material. The specific surface area was determined from BET curves in the relative pressure range from 0.05 to 0.21 (Figure 10C and D). Cu-BTC 3D hydrated during 20 min has a specific surface area of 371 m2/g, 7.6 times higher than Cu-BTC without hydration treatment.

The BET adsorption isotherm curves (A, B) and the BET curves (C, D) of Cu-BTC, formed from Cu and benzene-1,3,5-tricarboxylic acid, (A, C) and Cu-BTC immersed in water during 20 min (B, D) synthesized by the applied potential method.
Cu-BTC 3D synthesized in DD2 at an applied potential of 5 V/SCE during 10 min and immersed in water during 20 min shows a good thermal stability as shown by a TGA measurement performed in a range of temperature from 25°C to 600°C in atmosphere with a rate of 5°C/min (Figure 11).

TGA, derivative thermogravimetry analysis (DrTGA), differential thermal analysis (DTA) plots of Cu-BTC, formed from Cu and benzene-1,3,5-tricarboxylic acid, synthesized in DD2, hydrated during 20 min.
These plots show three different parts:
Part 1: a first mass decrease (9.4%) between 50°C and 90°C, an exothermal process that shows the loss of physical water.
Part 2: between 100°C and 200°C, an exothermal process corresponding to the water lost in the structure of MOF with mass decrease of 11.3%.
Part 3: above 200°C, the MOF structure starts to be destroyed (52.8%). The mass loss is completed at 350°C, with an endothermic process corresponding to the phase transition to Cu2O and CuO. After that, the sample is stable until 600°C and the remaining part is 26.57% [8], slightly higher than the value of 24% for Cu2+ in molecular Cu-BTC 3D [7].
3.5 Influence of dehydration process
The hydration process of Cu-BTC 3D can increase the specific surface area and the volume of pores. However, it can also change the phase structure of Cu-BTC as shown in part 3.4. Therefore, we investigated if the dehydration step was able to recover the initial phase structure of Cu-BTC. After hydration step of 4 h, the Cu-BTC 3D sample was dehydrated by drying at 110°C during 24 h. The X-ray diffraction pattern of the dehydrated Cu-BTC is shown in Figure 12. The pattern shows that the phase structure of Cu-BTC 3D cannot be recovered by the drying process. This result is agreement with literature.

X-ray diffraction pattern of dehydrated Cu-BTC, formed from Cu and benzene-1,3,5-tricarboxylic acid, (4-C4C8H4CuO4·3H2O, 5-C6H5Cu, 6-C4H4CuO4·2H2O).
4 Conclusion
Cu-BTC 1D and 3D were successfully synthesized potentiostatically by applying a controlled potential of 5 V/SCE. The 1D structure was obtained with NaNO3 as the electrolyte and a block 3D structure was electrodeposited in solution containing TBATFB. Cu-BTC 1D is unstable; its structure was destroyed after 60 min reaction. In contrast, Cu-BTC 3D was not destroyed during 60 min electrodeposition. Cu-BTC is not stable in aqueous media and specific surface area is not high. Therefore, for applications of Cu-BTC, research to improve the stability and specific surface area of Cu-BTC needs to be continued.
About the authors
Nguyen Thu Phuong received her Bachelor’s degree in Chemistry from Hanoi University of Education (HNUE) in 2008 and her Master of Science degree in Theoretical and Physical Chemistry from HNUE in 2010. Since 2010, she is a researcher at the Department of Corrosion and Protection of Metals, Institute for Tropical Technology (ITT), Vietnam Academy of Science and Technology (VAST). She has been a PhD student since 2013 and published more than 30 articles. Her present research concerns metal organic frameworks and biomedical materials.

Claudine Buess-Herman is director of the Analytical Chemistry and Interfacial Chemistry Laboratory, Faculty of Sciences, Université libre de Bruxelles. She has published 98 articles related to surface and interfacial chemistry, electrochemistry and surface analysis. She was President of The Belgian “Société Royale de Chimie” for the period 2014–2015. She is presently member of the editorial board of the European Journal ChemElectroChem.
Nguyen Thi Thom received her Bachelor’s degree in Chemistry from Hanoi University of Education in 2011 and her Master of Science degree in Theoretical and Physical Chemistry from the same university in 2013. Since 2014, she is a researcher at the Department of Corrosion and Protection of Metals, ITT, VAST. She has been a PhD student since 2015. Her present research is the synthesis of HAp/CNT nanocomposite coatings on biomedical alloys.

Pham Thi Nam works as a researcher at ITT, VAST since 2010. She has published more than 20 articles and reports in national and international journals, proceedings of national and international scientific conferences and workshops related to PbO2 and hydroxyapatite (HAp). In the past 5 years, she has done a PhD in the field of electrochemical depositing of HAp coating which is applied in the biomedical field.

Tran Dai Lam received his PhD in Physical Chemistry (Surface-Interface) from the University of Paris VII, Paris, France, in 2003. From 1998 to 2008, he was a research lecturer at Hanoi University of Technology. Since 2009, he is an associate professor at IMS. His current research interests include nanofabrications, characterizations and applications of nanobiomaterials in drug delivery systems and biosensors.

Dinh Thi Mai Thanh received her PhD from the University of Paris 6, France, in 2003. Beginning in 1994, she was an assistant researcher at the Department of Corrosion and Protection of Metals, ITT, VAST. Since 2010, she is an associate professor at ITT. Her current research interests include nanofabrication, characterization and application in bone implants.
Acknowledgments
The authors gratefully acknowledge the CUD for financial support through the bilateral project Vietnam–Belgium.
References
[1] Hongwei Y, Samuel O, Andrew G. Microporous Mesoporous Mater. 2011, 143, 37–45.10.1016/j.micromeso.2011.02.003Search in Google Scholar
[2] Bo L, Hiroshi S, Hailong J, Xinbo Z, Qiang X. Carbon 2010, 48, 456–463.10.1016/j.carbon.2009.09.061Search in Google Scholar
[3] Bo L, Xinbo Z, Hiroshi S, Takashi M, Tetsuo S, Qiang X. J. Power Sources 2010, 195, 857–861.10.1016/j.jpowsour.2009.08.058Search in Google Scholar
[4] Stefan M, Wolfgang K, Alfons B. J. Catal. 2011, 281, 76–87.10.1016/j.jcat.2011.04.004Search in Google Scholar
[5] Dipendu S, Shuguang D, Zhiguan Y. J. Porous Mater. 2009, 16, 141–149.10.1007/s10934-007-9178-3Search in Google Scholar
[6] Senthil RK, Senthil SK, Anbu MK. Electrochem. Commun. 2012, 25, 70–73.10.1016/j.elecom.2012.09.018Search in Google Scholar
[7] Nam PTS, Anh PNQ, Ky LKA, Trang PTM. J. Chem. 2011, 49 (2ABC), 489–496.Search in Google Scholar
[8] You-Kyong S, Geeta H, In TJ, Young KH, Chul-Ho J, Jong-San C. Microporous Mesoporous Mater. 2009, 119, 331–337.10.1016/j.micromeso.2008.10.035Search in Google Scholar
[9] Sam K, Sneha B, Kasper M, Eric B, Christine EAK, Johan AM. Thin Solid Films 2011, 519, 5437–5440.10.1016/j.tsf.2011.03.012Search in Google Scholar
[10] David JT, Joseph RH, Omar MY. Tetrahedron 2008, 64, 8553–8557.10.1016/j.tet.2008.06.036Search in Google Scholar
[11] Jorge G, Sonia A, Freek K. Microporous Mesoporous Mater. 2008, 113, 132–138.10.1016/j.micromeso.2007.11.014Search in Google Scholar
[12] Alberto MJ, Jana JA, Pablo SC, Freek K, Jorge G. Cryst. Growth Des. 2012, 12, 3489−3498.10.1021/cg300552wSearch in Google Scholar
[13] Rob A, Linda S, Jan F, Luc A, Bert FS, Dirk EDV. Chem. Mater. 2009, 21, 2580–2582.10.1021/cm900069fSearch in Google Scholar
[14] Tom RCVA, Gert D, Rob A, Dirk EDV, Herman T, Joeri FMD. Microporous Mesoporous Mater. 2012, 158, 209–213.10.1016/j.micromeso.2012.03.029Search in Google Scholar
[15] Fang Q, Sculley J, Zhou HCJ, Zhu G. Compr. Nanosci. Technol. ISBN: 978-0-12-374396-1.Search in Google Scholar
[16] Pech R, Pickardt J. Acta Cryst. C 1988, 44, 992–994.10.1107/S0108270188002902Search in Google Scholar
[17] Wojciech S, Bożena S, Krzysztof Ł, Jan M, Andrzej P, Lech W, Marek B. Nukleonika 2012, 57, 581−583.Search in Google Scholar
[18] Hailing G, Guangshan Z, Ian JH, Shilun Q. J. Am. Chem. Soc. 2009, 131, 1646–1647.10.1021/ja8074874Search in Google Scholar PubMed
©2016 Walter de Gruyter GmbH, Berlin/Boston
This article is distributed under the terms of the Creative Commons Attribution Non-Commercial License, which permits unrestricted non-commercial use, distribution, and reproduction in any medium, provided the original work is properly cited.
Articles in the same Issue
- Frontmatter
- In this issue
- Green processing of thermosensitive nanocurcumin-encapsulated chitosan hydrogel towards biomedical application
- Supramolecular chemistry at interfaces: host-guest interactions for attaching PEG and 5-fluorouracil to the surface of porous nanosilica
- Study of ATO nanoparticles by the solvothermal method for thermal insulated coated glass: a green energy application
- Synthesis of Cu-BTC, from Cu and benzene-1,3,5-tricarboxylic acid (H3BTC), by a green electrochemical method
- Improving the electrochemical behavior of sustainable polyaniline titanium dioxide composite by intercalation of carbon nanotubes
- Sustainable composite materials based on ethylene-vinylacetate copolymer and organo-modified silica
- Conference announcement
- 7th International Conference of the Flow Chemistry Society (Cambridge, UK, February 7–8, 2017)