Isotherms and kinetic studies on adsorption of Hg(II) ions onto Ziziphus spina-christi L. from aqueous solutions
-
Ali Hashem
Ali Hashem obtained his BS degree in Chemistry from the Faculty of Science, Assiut University, in 1983 and his MS degree in Organic Chemistry from the Faculty of Science, Zagazig University, Egypt, in 1989. He obtained his PhD in Organic Chemistry from the Faculty of Science, Cairo University, Cairo, Egypt, in 1993. He was then appointed as a researcher in the Department of Pretreatment and Finishing of Cellulose Based Textiles, Textile Research Division, National Research Centre, Egypt. He was promoted to Associate Professor in the same department in 2001, and then promoted to Full Professor in 2006. He worked in the Textile Engineering Department, Mehran University, Pakistan, for 1 year in 2008 as a Foreign Professor. Currently he is working as Professor of Organic Chemistry at Shaqra University, Saudi Arabia. His main research interests are cellulose and carbohydrate chemistry, adsorption chemistry and wastewater treatment, polymer chemistry and color chemistry. He is author or co-author of about 60 peer-reviewed publications.
 ,
Alaauddin Al-Anwar
,
Alaauddin Al-Anwar
Alaauddin Al-Anwar obtained his BS degree in Chemistry from the Faculty of Science, Assiut University, Egypt, in 1983 and his MS degree in Organic Chemistry from the Faculty of Science, Banha University, Egypt, in 2010. Currently, he is finalizing his PhD in the Faculty of Science, Alazhar University. His experience is in examination and analysis of toxic substances and drugs in blood, urine, body fluids and tissues in different media.

Abstract
Ziziphus spina-christi L. (ZscL) is a plant residue that has been used as adsorbent for the removal of Hg(II) ions from an aqueous solution. The ability of ZscL to adsorb Hg(II) ions was investigated by using the batch adsorption procedure. It was characterized by Fourier transform infrared spectroscopy (FTIR) and scanning electron microscopy (SEM) to support the adsorption of Hg(II) ions. The effects of various parameters on the adsorption process, such as contact time, adsorbent concentration, solution pH and initial concentrations of metal ions were studied to optimize the conditions for maximum adsorption. Experimental equilibrium data were fitted to the Freundlich, Langmuir, Dubinin-Radushkevich, Halsey and Temkin (two parameter models), Redlich-Peterson, Sips, Khan, Hill, Radke-Prausnitz, Langmuir-Freundlich and Toth (three parameter models), Fritz-Schlunder and Baudu (four parameter models) and Fritz-Schlunder (five parameter model) at 30°C by using nonlinear regression analysis. The examination of error analysis methods showed that the Halsey model provides the best fit for experimental data compared with the other isotherms. Various kinetic models have been applied to the experimental data to predict the adsorption kinetics. It was found that pseudo-second-order rate was better obeyed than pseudo-first-order reaction, supporting that the chemisorption process was involved. The obtained results show that ZscL can be used as an effective and natural low-cost adsorbent for the removal of Hg(II) ions from aqueous solutions.
1 Introduction
Heavy metal contamination of wastewater is an important environmental problem due to their toxicity, persistence and non-biodegradability. Heavy metals such as mercury, lead, copper, nickel, chromium, cadmium and zinc are common pollutants widely found in industrial wastewaters from many industrial activities, including electroplating, mining, battery manufacturing, chemical manufacturing, metallurgical processes, pigments, leather industries, fertilizer and pesticides industry, etc. The presence of heavy metals in the environment can be harmful to human health because of accumulation via the food chain [1].
Mercury can be found in significant amounts in wastes from chlor-alkali manufacturing plants, electrical and electronics manufacturing, and sulfide ore roasting operations. Mercury is the most harmful to humans, plants and animals. Exposure to mercury can have toxic effects on reproduction, the central nervous system, liver and kidney, and cause sensory and psychological impairments [2]. Therefore, all countries have taken measures to reduce mercury exposure through comprehensive prevention strategies including environmental standards that require removal of mercury from industrial effluents. Conventional methods for removing metals from industrial effluents include chemical precipitation, electrolysis, membrane separation, ion exchange and adsorption by activated carbon. Most of these methods suffer from some drawback, such as the high capital or high operational cost or the disposal of the resulting sludge [3].
The adsorption process [4] is one of the most effective methods used to remove heavy metals from aqueous solution. Activated carbon is the most widely used adsorbent for this purpose because of its extended surface area, microporous structure, high adsorption capacity and high degree of surface reactivity. Therefore, commercially activated carbons are very expensive [5]. This led to search for a cheaper adsorbent for heavy metal removal. Agricultural byproducts, mainly composed of cellulose and lignin, are available in large quantities and constitute one of the most abundant renewable resources in the world. Lignin has polar functional groups, which include alcohols, aldehydes, ketones, carboxylic, phenolic and ether groups [6]. These groups have the ability, to some extent, to bind heavy metals by donation of an electron pair from these groups to form complexes with the metal ions in solution. Recently, numerous low-cost alternative adsorbents have been examined for the removal of Hg(II) ions from contaminated water [7–13]. The abundance and availability of Ziziphus spina-christi L. (ZscL) residues makes them a good candidate for incorporation as adsorbent of heavy metals from wastewater.
The aim of the present work is to explore the possibility of utilizing ZscL for the adsorption of Hg(II) ions from aqueous solutions. The effect of such factors as pH, adsorbent dose, adsorbate concentration, contact time and initial concentration was investigated. Experimental equilibrium data were fitted to various types of two, three, four and five parameter models. Error analysis was carried out to test the adequacy and the accuracy of the isotherm models. The kinetics of Hg(II) ions adsorption on ZscL were analyzed by fitting various kinetic models.
2 Materials and methods
2.1 Materials
2.1.1 Adsorbent:
ZscL plant is widely spread in Libya and was obtained from Sebha (Libya). The roots were separated from the stems and leaves, and washed with distilled water several times until the filtrate was colorless, to remove the surface adhered particles and water soluble particles. The roots were dried in an electric oven at 105°C for 3 h, then finally ground using a mixer, and sieved to pass through a 50–150 μm. The roots were chosen because they contain the highest percentage of the cellulose content.
2.1.2 Reagents:
Mercuric acetate, EDTA, sodium hydroxide, nitric acid were all used as laboratory grade chemicals supplied by Merck Company, Germany.
2.2 Characterization of adsorbent
The Fourier transform infrared spectrometer (FTIR) analysis was used to identify the different functional groups present in ZscL and Hg(II) ions loaded ZscL. The IR spectra were recorded on a Nicolet I S 10 spectrophotometer over 4000–400 cm-1 using the KBr disk technique.
Scanning electron microscopy (SEM), using a JXA-840A scanning electron microscope, was used to obtain the surface morphology of ZscL residues before Hg(II) ions adsorption.
2.3 Methods
2.3.1 Adsorption studies:
A known volume (100 ml) of a Hg(II) ions solution with a concentration in the range 100–1000 mg·l-1 was placed in a 125 ml Erlenmeyer flask. An accurately weighed sample of ZscL adsorbent (0.05 g) with a particle size in the range 50–150 μm was then added to the solution. A series of such flasks was prepared, the pH values of the contents adjusted by the addition of 0.1 M HNO3 or 0.1 M NaOH and then shaken at a constant speed of 150 rpm in a shaking water bath at 30°C for a known time length. At the end of the agitation time, the metal ion solutions were separated by filtration. Blank experiments were carried out simultaneously without the addition of the ZscL adsorbent. The extent of metal ion adsorption onto adsorbent was calculated mathematically by measuring the metal ion concentration before and after the adsorption through direct titration against the standard EDTA solution. The amount of Hg(II) ions adsorbed on ZscL at equilibrium, qe (mg·g-1) and percent removal of mercury were calculated according to the following relationships:
where Co and Ce are the initial and final concentrations of Hg(II) ions, mg·l-1, V is the volume of adsorbate (l) and W is the weight of ZscL adsorbent (g). All experiments were carried out in duplicate and the mean values of qe were reported.
2.4 Error analysis
In the single-component isotherm studies, the optimization procedure requires an error function to be defined to evaluate the fit of the isotherm to the experimental equilibrium data. The common error functions for determining the optimum isotherm parameters were, average relative error (ARE), sum of the squares of the errors (ERRSQ), hybrid fractional error function (Hybrid), Marquardt’s percent standard deviation (MPSD) and sum of absolute errors (EABS) [14] (Table 1). In the present study, all error functions were used to determine the best fit in the isotherm model.
Lists of error functions [14].
| Error function | Equation |
|---|---|
| Average relative error (ARE) | |
| Average percentage error (APE) | |
| The sum of the squares of the error (ERRSQ) | |
| Hybrid fraction error function (Hybrid) | |
| Marquardt’s percent standard deviation (MPSD) | |
| The sum of absolute error (EABS) |
3 Results and discussion
3.1 Characterization of adsorbent
3.1.1 FTIR studies
The FTIR absorption spectra of ZscL and Hg(II) ions loaded ZscL were present in Figure 1A and B to confirm the presence of different functional groups in adsorbent.
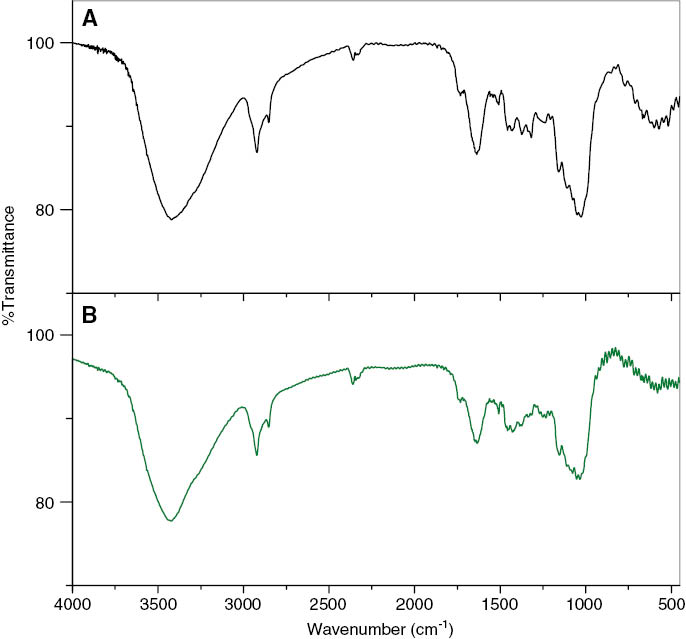
Fourier transform infrared spectroscopy (FTIR) of Ziziphus spina-christi L. (ZscL) (A) and Hg(II) ions-loaded ZscL(B).
The FTIR absorption spectra of ZscL biomass (Figure 1A) show a broadband at 3420 cm-1 which indicates the presence of hydrogen-bonded -OH stretching from alcohol and phenols and is also dominated by -NH stretching. The bands at 2921 cm-1 and 2851 cm-1 in IR spectra of ZscL biomass may be due to the C-H stretching vibrations. The peak at 2358 cm-1 represents stretching vibrations of -NH2+, -NH+ groups of ZscL biomass. The bands appearing at 1636.04 cm-1 and 1373 cm-1 are attributed to the formation of oxygen functional groups like highly conjugated C=O stretching in carboxylic groups. The peak which appeared at 1026.94 cm-1 has been assigned to C-O stretching in ethers. The peak at 599 cm-1 is caused by C-N-C.
The small shift was obtained in the absorbance peak in loaded Hg(II) ions onto ZscL biomass compared with that in ZscL (Figure 1A and B). The broadband observed at 3420 cm-1 was shifted to 3422 cm-1. The peaks at 2921 cm-1 and 2851 cm-1 were shifted to 2922 cm-1 and 2852.63 cm-1, respectively. The peaks observed at 1636 cm-1 and1430 cm-1 were shifted to 1635 cm-1 and 1428 cm-1, respectively. The peak at 1026 cm-1 was changed to 1034 cm-1. The peak at 599 cm-1 was also shifted to 600 cm-1.
It should also be noted that the FTIR results did not provide any quantitative analysis as well as the information about the level of affinity to metal of the functional groups presented in the adsorbents. They only presented the possibility of the coupling between the metal species and the functional group of the adsorbents.
3.1.2 SEM studies
The surface morphology of the ZscL and Hg(II) ions-loaded ZscL was analyzed by SEM by using the JXA-840A model which is shown in Figure 2. The SEM micrograph of ZscL reveals the irregular nature of biomass particles, which is rough and heterogeneous with a considerable amount of voids and many ups and downs.
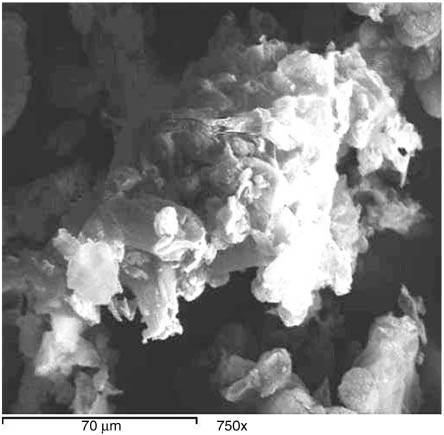
Scanning electron microscopy (SEM) of Ziziphus spina-christi L. (ZscL).
3.2 Factors affecting adsorption of Hg(II) ions onto ZscL
The adsorption process of heavy metals is influenced by several factors, such as pH, adsorbent dose, contact time and adsorbate concentration. The effects of these parameters were investigated in this section.
3.2.1 Effect of pH on Hg(II) ions adsorption
The pH of the aqueous solution is an important controlling parameter in the adsorption process [15]. Figure 3 shows the adsorption capacity of Hg(II) ions onto ZscL as a function of pH (2–6) at fixed adsorbent concentration, fixed agitation time and fixed adsorbate concentration at 30°C. It is clear from this figure that the adsorption capacity of Hg(II) ions onto ZscL increases by increasing the pH from 2 to 6. Under highly acidic conditions (pH 2) the adsorption of Hg(II) ions on ZscL is the lowest, because metal binding sites on the adsorbent were closely associated with H+ and restrict the approach of metal cations as a result of the repulsion forces. However, adsorption capacity increased with increasing the pH of solution, since the adsorbent surface could be exposed with negative charge with subsequent attraction with positive charge occurring onto the adsorbate. At a pH value higher than 6, the adsorption experiment could not be carried out due to precipitation of Hg(II) ions as Hg (OH)2.
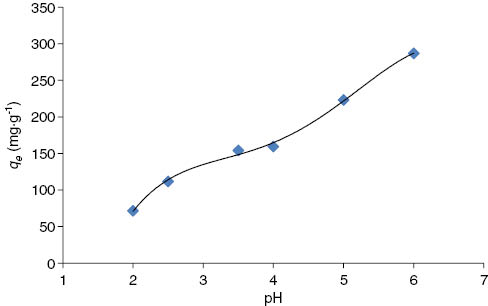
Effect of pH on adsorption capacity of Hg(II) ions onto Ziziphus spina-christi L. (ZscL) at 30°C.
3.2.2 Effect of adsorbent concentration
The adsorbent concentration is another important parameter, which influences the extent of metal uptake from the solution. The effects of adsorbent concentration on both adsorption capacity and percent removal of mercury on ZscL are shown in Figure 4. It is clear from this figure that the percent removal of mercury increased from 28.2% to 91.2% by increasing the concentration of adsorbent from 0.3 g·l-1 to 8 g·l-1 and then remained at approximately the same level at higher adsorbent concentration. The increase in percent removal of Hg(II) ions with increasing adsorbent concentration in the first range could be attributed to the greater availability of the exchangeable sites of the adsorbent. The leveling of the percent removal at higher adsorbent concentrations could be attributed to the blocking of the available active sites on the adsorbent surface. By contrast, the adsorption capacity (qe), or the amount of Hg(II) ions adsorbed per unit mass of adsorbent (mg·g-1), decreased by increasing the concentration of adsorbent (Figure 4). The decrease in adsorption capacity with increase in adsorbent concentration is mainly due to overlapping of the adsorption sites as a result of overcrowding of the adsorbent particles and is also due to the competition among Hg(II) ions for the surface sites [16].
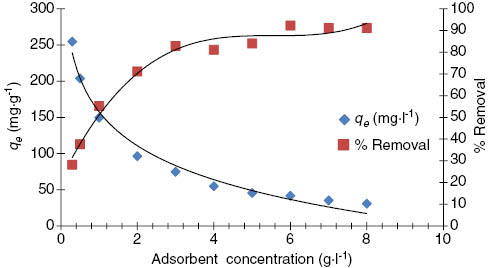
Effect of adsorbent concentration on both adsorption capacity and % removal of Hg(II) ions onto Ziziphus spina-christi L. (ZscL) at 30°C.
3.2.3 Effect of contact time
Figure 5 shows the effect of agitation time at two different adsorbate concentrations (274 mg·l-1 and 446 mg·l-1) on the adsorption capacity of ZscL towards Hg(II) ions. This was achieved by varying the contact time from 5 min to 180 min in separate experimental runs. As expected, the amount of Hg(II) ions adsorbed into ZscL increases with time, and at some point, reaches a constant value beyond which no more is removed from solution. At this point, the amount of the Hg(II) ions desorbing from the adsorbent is in a state of dynamic equilibrium with the amount being absorbed by the adsorbent. The time required to attain this state of equilibrium is termed the equilibrium time, and the amount of ion adsorbed at the equilibrium time reflects the adsorption capacity of the adsorbent under those operating conditions.
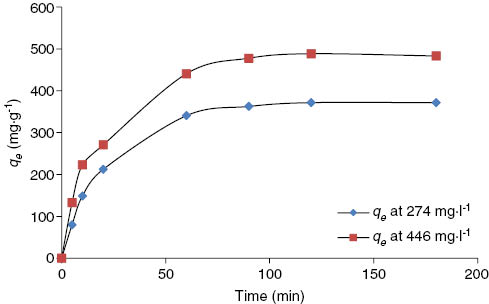
Effect of agitation time on adsorption capacity of Hg(II) ions onto Ziziphus spina-christi L. (ZscL) at 30°C.
The time necessary to achieve equilibrium increased with increasing adsorbate concentration, and was 60 min and 90 min for adsorbate concentrations of 274 mg·l-1 and 446 mg·l-1, respectively. This contact time, which is one of the main parameters for economical wastewater treatment plant operations, is quite small.
This can be explained by the fact that initially, the rate of ion uptake was higher because all sites on the adsorbent were vacant and Hg(II) ions concentration was high, but decrease of adsorption sites reduced the uptake rate.
3.2.3.1 Adsorption kinetics
Two main types of adsorption kinetic models, namely, reaction-based and diffusion-based models, were examined to fit the experimental data. These models also describe the solute uptake rate, and evidently, this rate controls the time of Hg(II) ions at the ZscL interface. Five kinetic models, namely, pseudo-first-order, pseudo-second-order, and interparticle diffusion, Bangham model and Elovich equation were utilized to describe the adsorption rate of Hg(II) ions onto ZscL and expressed as follows. The pseudo-first-order model [17] is represented as:
The pseudo-second-order model [18] is represented as:
The intraparticle diffusion model [19] can be expressed by the following equation:
where k is the pseudo-first-order rate constant (mg·g-1·min-1), k2 is the pseudo-second-order rate constant (g·mg-1·min-1), kP is the intraparticle diffusion rate constant (mg·g-1·min-1/2), C is the thickness of the boundary layer (mm) and qe is the amount of adsorbate adsorbed at equilibrium (mg·g-1), while qt is the amount of adsorbate adsorbed at time t (mg·g-1) before reaching equilibrium.
Bangham’s equation [20] was employed for applicability of adsorption of Hg(II) ions onto ZscL. Bangham’s equation was used to evaluate whether the adsorption is pore diffusion controlled:
where, Co is the initial concentration of the adsorbate (mg·l-1), V is the volume of the adsorbate (ml), m is the weight of adsorbent (g·l-1), q (mg·g-1) is the amount of adsorbate retained at time t and α (<1) and k are the constants.
The Elovich model equation [21] is generally expressed as:
where α (mg·g-1.min-1) is the initial adsorption rate and the parameter β (g·mg-1·1) is related to the extent of surface coverage and activation energy for chemisorption.
The slopes and intercepts of plots of log (qe-qt) versus t for concentrations of 274 mg·l-1 and 446 mg·l-1 were used to determine the pseudo-first-order constant and equilibrium adsorption density, qe. However, the experimental data deviated considerably from the theoretical data. A comparison of the results with the correlation coefficients is shown in Table 2. The correlation coefficients for the pseudo-first-order kinetic model obtained for concentrations of 274 mg·l-1 and 446 mg·l-1 were low (figure not shown). Also the theoretical qe values found from the pseudo-first-order kinetic model did not give reasonable values. This suggests that this adsorption of Hg(II) ions onto ZscL is not acceptable for pseudo-first-order reaction.
Kinetic parameters for adsorption of Hg(II) ions onto Ziziphus spina-christi L. (ZscL) at 30°C.
| Models | Parameters | Values | |
|---|---|---|---|
| (274 mg·l-1) | (446 mg·l-1) | ||
| Pseudo-first-order | k1 | – | – |
| R2 | – | – | |
| Pseudo-second-order | k1 | 8.85E-05 | 9.86E-05 |
| qe (exp.) | 488.6427 | 371.7933 | |
| qe (Calc.) | 555.5556 | 416.6667 | |
| R2 | 0.9836 | 0.9724 | |
| Bangham’s equation | Ko | 27.65493762 | 12.45583 |
| α | 0.459 | 0.4097 | |
| R2 | 0.9305 | 0.9141 | |
| Intraparticle diffusion | kP | 44.298 | 29.198 |
| C | 40.143 | 34.439 | |
| R2 | 0.8352 | 0.9084 | |
| Elovich equation | α | 65.62835 | 47.13728 |
| β | 0.009019 | 0.012742 | |
| R2 | 0.9244 | 0.9417 | |
The slopes and intercepts of plots t/qt versus t were used to calculate the pseudo-second-order rate constants k2 and qe. The straight lines in plots of t/q versus t (Figure 6) show good agreement of experimental data with the pseudo-second-order kinetic model for concentrations of 274 mg·l-1 and 446 mg·l-1. Table 2 lists the computed results obtained from the pseudo-second-order kinetic model. The correlation coefficients for the pseudo-second-order kinetic model obtained were >0.997 for the two concentrations used. The calculated qe values also agree very well with the experimental data. These indicate that the adsorption system studied belongs to the second order kinetic model.
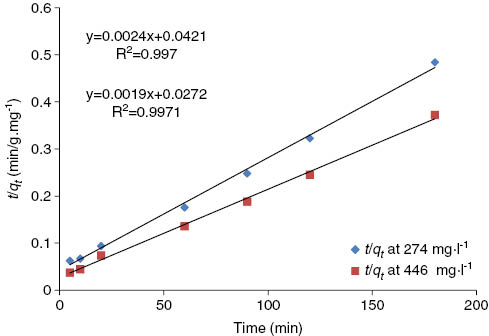
Pseudo-second- order reaction of Hg(II) ions onto Ziziphus spina-christi L. (ZscL) at 30°C.
The slopes and intercepts of plots qt versus t1/2 were used to calculate the intraparticle diffusion rate constant kP. The straight lines in plots of qt versus t1/2 (Figure 7) show good agreement of experimental data with the intraparticle diffusion model for concentrations of 274 mg·l-1 and 446 mg·l-1.
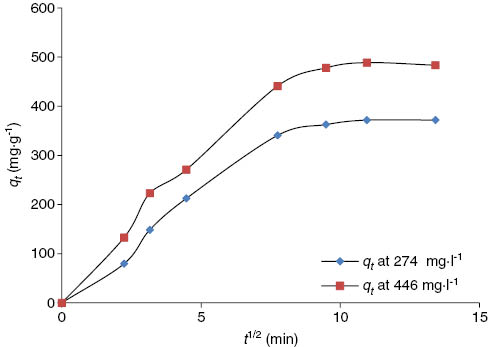
Intraparticle diffusion of Hg(II) ions onto Ziziphus spina-christi L. (ZscL) at 30°C.
Such plots may present a multilinearity [22, 23], indicating that two or more steps take place. The first portion is the external surface adsorption or instantaneous adsorption stage. The second portion is the gradual adsorption stage, where intraparticle diffusion is rate-controlled. The third portion is the final equilibrium stage where intraparticle diffusion starts to slow down due to extremely low adsorbate concentrations in the solution. Figure 8 shows a plot of the linearized form of the intraparticle diffusion model for concentrations of 274 mg·l-1 and 446 mg·l-1.
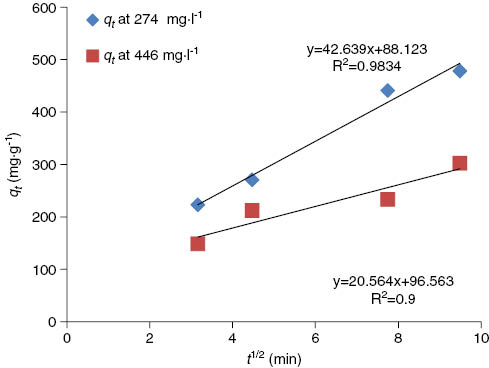
Test of intraparticle diffusion of Hg(II) ions onto Ziziphus spina-christi L. (ZscL) at 30°C.
Further, such deviation of the straight line from the origin indicates that the pore diffusion is not the rate-controlling step [24]. The values of kP (mg·g-1·min-1) obtained from the slope of the straight line (Figure 8) are listed in Table 2. The value of R2 for the plot is listed also in Table 2. The values of intercept C (Table 2) give an idea about the boundary layer thickness, i.e. the larger the intercept is the greater the boundary layer effect [25]. This value indicates that the adsorption of Hg(II) ions onto ZscL is acceptable for the intraparticle diffusion mechanism.
The plot of
If Hg(II) ions adsorption onto ZscL fits the Elovich model, a plot of qt versus ln (t) should yield a linear relationship with a slope of (1/β) and an intercept of (1/β) ln (αβ).
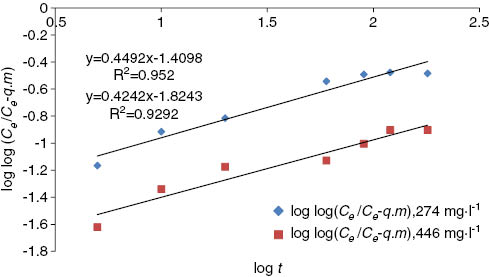
Bangham’s model of Hg(II) ions onto Ziziphus spina-christi L. (ZscL) at 30°C.
The straight lines in plots of qt versus ln(t) (Figure 10) show good agreement of experimental data with the Elovich model for concentrations of 274 mg·l-1 and 446 mg·l-1 (R2>0.92). This suggests that this adsorption system is acceptable for this system.
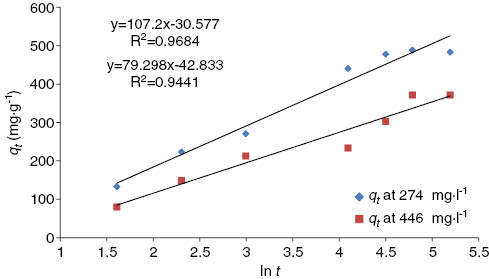
Elovich model of Hg(II) ions onto Ziziphus spina-christi L. (ZscL) at 30°C.
3.2.4 Effect of adsorbate concentration
3.2.4.1 Adsorption isotherm
Adsorption isotherms describe how adsorbates interact with adsorbents and are critical in optimizing the use of adsorbents. The amount of adsorbate per unit mass of adsorbent at equilibrium qe (mg·g-1) and the adsorbate equilibrium concentration Ce (mg·l-1) allows plotting the adsorption isotherm qe versus Ce (Figure 11) at 30°C.
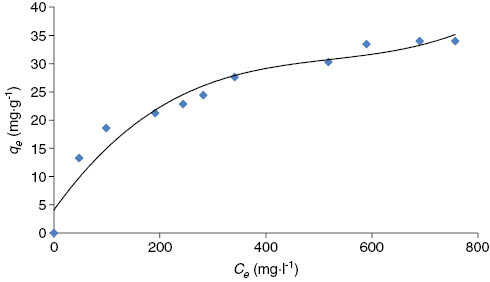
Equilibrium adsorption isotherm of Hg(II) ions onto Ziziphus spina-christi L. (ZscL) at 30°C.
Mathematical models can be used to describe and characterize the adsorption process. The most common isotherms for describing solid-liquid sorption systems are Langmuir, Freundlich, Temkin, Dubinin and Halsey (two parameter isotherms), Redlich-Peterson, Toth, Sips, Khan, Hill, Radke-Praunsnitz and Freudlich-Langmuir (three parameter isotherms), Baudo and Fritz-Schlunder (four parameter isotherms) and Fritz-Schlunder (five parameter isotherm). Therefore, in order to investigate the adsorption capacity of Pb (II) onto ZscL, the experimental data were fitted to these equilibrium models.
The equations of all adsorption isotherms [26–38] addressed in this paper are listed in Table 3.
Lists of adsorption isotherm models.
| Isotherm | Equation (nonlinear form) | References |
|---|---|---|
| Two parameter models | ||
| Langmuir | [26] | |
| Freundlich | [27] | |
| Tempkin | [28] | |
| Dubinin-Radushkevich | [29] | |
| Halsey | [30] | |
| Three parameter models | ||
| Redlich-Peterson | [31] | |
| Toth | [32] | |
| Sips | [33] | |
| Khan | [34] | |
| Radke-Prausnitz | [35] | |
| Langmuir-Freundlich | [36] | |
| Hill | [37] | |
| Four parameter models | ||
| Baudo | [38] | |
| Fritz-Schlunder | [39] | |
| Five parameter models | ||
| Fritz-Schlunder | [39] | |
The comparison of the adsorption capacity of various adsorbents reported in the literature for the removal of Hg(II) ions is shown in Table 4 [10–12, 39–42]. It was found from this table that the ZscL had a good affinity for removal of mercury compared with other adsorbents.
Comparison of sorption capacities of various adsorbents for Hg(II) ions.
| Adsorbents | Adsorption capacity (mg·g-1) | References |
|---|---|---|
| Sargassum fusiforme | 30.86 | [10] |
| Peanut hull powder | 30.3 | [11] |
| Mercaptoethylamine/mercaptopropyltrimethoxysilane functionalized vermiculites | 0.2863 | [12] |
| Activated carbon | 32.78 | [40] |
| Used tire rubber | 14.65 | [41] |
| Eucalyptus globules bark carbon | 4.014 | [42] |
| Ziziphus spina-christi L. | 37.45 | This study |
The comparison between the experimental data and the data obtained from two, three, four and five parameter models (Figures 12–15), as well as the constants and error analysis of two, three, four and five parameter models, are given in Tables 5–8.
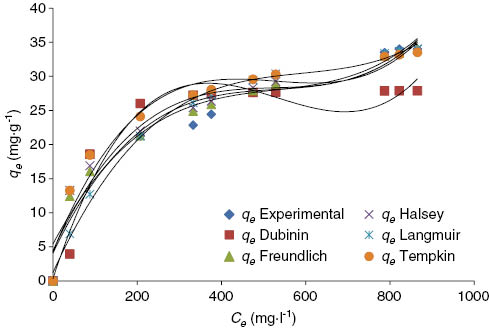
Comparison between experimental isotherm data and two parameter models at 30°C.
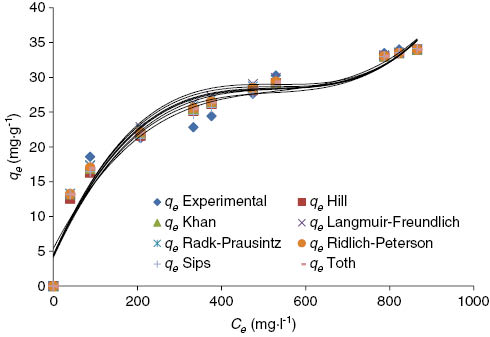
Comparison between experimental isotherm data and three parameter models at 30°C.
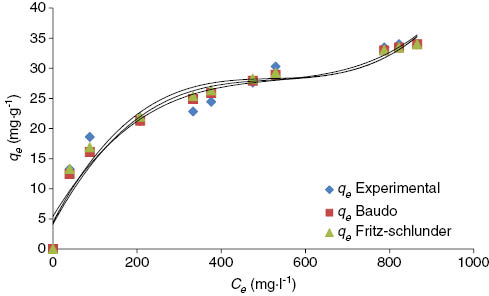
Comparison between experimental isotherm data and four parameter models at 30°C.
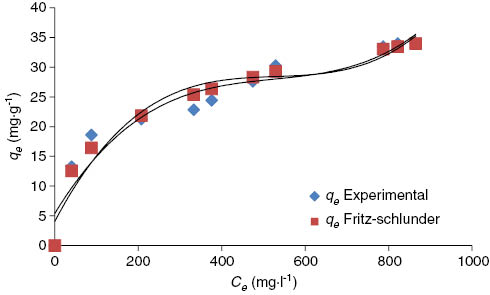
Comparison between experimental isotherm data and five parameter model at 30°C.
Constants and error analysis of two parameter models for adsorption of Hg(II) ions onto Ziziphus spina-christi L. (ZscL) at 30°C.
| Isotherm model | Parameter | Value | Error analysis | Value |
|---|---|---|---|---|
| Langmuir | aL | 0.007608467 | ARE | 1.136205506 |
| APE% | 11.36205506 | |||
| kL | 1.013005268 | EABS | 20.68104572 | |
| ERRSQ | 97.34102653 | |||
| R2 | Hybrid | 72.92762818 | ||
| 0.9965 | MPSD | 0.969684292 | ||
| Freundlich | 1/n | 0.22757524 | ARE | 0.438461301 |
| APE% | 4.384613012 | |||
| kF | 25.31509108 | EABS | 9.630324832 | |
| ERRSQ | 15.80206444 | |||
| R2 | 0.996 | Hybrid | 9.317788213 | |
| MPSD | 0.94758344 | |||
| Tempkin | AT | 0.407057769 | ARE | 1.056465708 |
| APE% | 10.56465708 | |||
| bT | 1.260126749 | EABS | 25.65291447 | |
| ERRSQ | 78.73132123 | |||
| R2 | 0.999 | Hybrid | 39.32156667 | |
| MPSD | 0.96057493 | |||
| Dubinin-Radushkevich | qD | 118.8048645 | ARE | 1.508145023 |
| APE% | 15.08145023 | |||
| BD | 42.74353392 | EABS | 39.61254765 | |
| ERRSQ | 209.9222383 | |||
| Hybrid | 98.49127318 | |||
| R2 | 0.9946 | MPSD | 0.968144195 | |
| Halsey | KH | 4.308582443 | ARE | 0.403071173 |
| APE% | 4.030711728 | |||
| n | -3.27420713 | EABS | 9.568057364 | |
| ERRSQ | 15.61382676 | |||
| R2 | 0.9737 | Hybrid | 8.52811346 | |
| MPSD | 0.94578976 |
APE%, Average percentage error; ARE, average relative error; EABS, sum of absolute errors; ERRSQ, sum of the squares of the errors; MPSD, Marquardt’s percent standard deviation.
Constants and error analysis of three parameter models for adsorption of Hg(II) ions onto Ziziphus spina-christi L. (ZscL) at 30°C.
| Isotherm model | Parameter | Value | Error analysis | Value |
|---|---|---|---|---|
| Redlich-Peterson | A | 6.721443411 | ARE | 0.424142513 |
| B | 1.416827429 | APE% | 4.241425127 | |
| g | 0.707951099 | EABS | 10.01880004 | |
| R2 | 0.9537 | ERRSQ | 17.12501055 | |
| Hybrid | 10.64441042 | |||
| MPSD | 0.947819016 | |||
| Toth | kt | 4.471055668 | ARE | 0.41599484 |
| at | 1.249244519 | APE% | 4.159948399 | |
| 1/t | 0.699906243 | EABS | 9.824585469 | |
| R2 | 0.9536 | ERRSQ | 16.32547708 | |
| Hybrid | 10.1714301 | |||
| MPSD | 0.947425982 | |||
| Sips | Ks | 4.309176667 | ARE | 0.403045497 |
| as | 1.68543E-05 | APE% | 4.03045497 | |
| Bs | 0.305416721 | EABS | 9.568416932 | |
| R2 | 0.9737 | ERRSQ | 15.61852149 | |
| Hybrid | 9.748850282 | |||
| MPSD | 0.94705523 | |||
| Khan | qk | 1.309370211 | ARE | 0.404550325 |
| ak | 0.693938938 | APE% | 4.045503252 | |
| bk | 48.30069986 | EABS | 9.575453791 | |
| R2 | 0.9540 | ERRSQ | 15.54737612 | |
| Hybrid | 9.717682068 | |||
| MPSD | 0.947041897 | |||
| Hill | qSH | 284.113147 | ARE | 0.454908257 |
| KD | 78.61939814 | APE% | 4.549082574 | |
| nH | 0.350262206 | EABS | 10.1240463 | |
| R2 | 0.9539 | ERRSQ | 16.4264891 | |
| Hybrid | 10.80611143 | |||
| MPSD | 0.948681139 | |||
| Langmuir- Freundlich | qmLF | 85.15316612 | ARE | 0.490318002 |
| KLF | 0.000432405 | APE% | 4.903180018 | |
| mLF | 0.415815182 | EABS | 11.54622799 | |
| R2 | 0.9551 | ERRSQ | 26.17255559 | |
| Hybrid | 16.09025087 | |||
| MPSD | 0.951568747 | |||
| Radke-Prausnitz | αR | 2.837353545 | ARE | 0.450891362 |
| rR | 5.576155423 | APE% | 4.508913616 | |
| βR | 0.269346464 | EABS | 10.6881857 | |
| R2 | 0.9536 | ERRSQ | 20.68404154 | |
| Hybrid | 12.74479499 | |||
| MPSD | 0.949396904 |
APE%, Average percentage error; ARE, average relative error; EABS, sum of absolute errors; ERRSQ, sum of the squares of the errors; MPSD, Marquardt’s percent standard deviation.
Constants and error analysis of four parameter models for adsorption of Hg(II) ions onto Ziziphus spina-christi L. (ZscL) at 30°C.
| Isotherm model | Parameter | Value | Error analysis | Value |
|---|---|---|---|---|
| Baudo | Qm | 3.757838658 | ARE | 0.436932857 |
| bo | 214.4703477 | APE% | 4.369328571 | |
| x | -0.452157 | EABS | 9.6287083 | |
| y | -0.221515 | ERRSQ | 15.68243568 | |
| R2 | 0.9607 | Hybrid | 12.27467799 | |
| MPSD | 0.950145775 | |||
| Fritz-Schlunder | A | 266.9631152 | ARE | 0.403033179 |
| α | 0.07641195 | APE% | 4.03033179 | |
| B | 5.441786272 | EABS | 9.568243113 | |
| β | 0.17185084 | ERRSQ | 15.61824834 | |
| R2 | -0.26305732 | Hybrid | 11.37340852 | |
| 0.9608 | MPSD | 0.948515994 |
APE%, Average percentage error; ARE, average relative error; EABS, sum of absolute errors; ERRSQ, sum of the squares of the errors; MPSD, Marquardt’s percent standard deviation.
Constants and error analysis of five parameter models for adsorption of Hg(II) ions onto Ziziphus spina-christi L. (ZscL) at 30°C.
| Isotherm model | Parameter | Value | Error analysis | Value |
|---|---|---|---|---|
| Fritz-Schlunder | Qmfs | 2.808590608 | ARE | 0.474899072 |
| K1 | 2.808590608 | APE% | 4.748990721 | |
| K2 | 0.208250942 | EABS | 10.56925328 | |
| m1 | 1.016693475 | ERRSQ | 17.62434616 | |
| m2 | 0.849113488 | Hybrid | 16.10980402 | |
| R2 | 0.9944 | MPSD | 0.952380073 |
APE%, Average percentage error; ARE, average relative error; EABS, sum of absolute errors; ERRSQ, sum of the squares of the errors; MPSD, Marquardt’s percent standard deviation.
3.3 Error analysis and nonlinear regression method
In the nonlinear regression method, the validity of widely used isotherm models to the experimental data was examined by trial and error using the solver add-in with Microsoft Excel. The R2 value is used to minimize the error distribution between the experimental equilibrium data and the predicted isotherms.
The fitting presentations of two, three, four and five parameter models are shown in Figures 12–15, and the constants and error analysis of two and three parameter models are given in Tables 5–8.
Among two, three, four and five parameter models, the highest R2 value and lowest ARE, average percentage error (APE%), EABS, ERRSQ, MPSD and Hybrid indicated that Halsey (two parameter isotherm) is a better fit than the rest of the isotherm models.
4 Conclusions
ZscL has been utilized as adsorbent material for the removal of Hg(II) ions from contaminated water. The ability of ZscL to adsorb Hg(II) ions was investigated by using the batch adsorption procedure. The data of the adsorption isotherm was tested by two, three, four and five parameter models by using the nonlinear regression technique. The best fitting model was firstly evaluated using six different error functions. The examination of all these error estimation methods showed that the Halsey model provides the best fit for experimental data in comparison with other isotherms. The kinetics of adsorption of Hg(II) ions have been discussed using five kinetic models, i.e. the pseudo-first-order, the pseudo-second-order, Elovich, intraparticle diffusion and Bangham models. The adsorption of Hg(II) ions onto ZscL could be well described by the pseudo-second-order kinetic model.
About the authors

Ali Hashem obtained his BS degree in Chemistry from the Faculty of Science, Assiut University, in 1983 and his MS degree in Organic Chemistry from the Faculty of Science, Zagazig University, Egypt, in 1989. He obtained his PhD in Organic Chemistry from the Faculty of Science, Cairo University, Cairo, Egypt, in 1993. He was then appointed as a researcher in the Department of Pretreatment and Finishing of Cellulose Based Textiles, Textile Research Division, National Research Centre, Egypt. He was promoted to Associate Professor in the same department in 2001, and then promoted to Full Professor in 2006. He worked in the Textile Engineering Department, Mehran University, Pakistan, for 1 year in 2008 as a Foreign Professor. Currently he is working as Professor of Organic Chemistry at Shaqra University, Saudi Arabia. His main research interests are cellulose and carbohydrate chemistry, adsorption chemistry and wastewater treatment, polymer chemistry and color chemistry. He is author or co-author of about 60 peer-reviewed publications.
Alaauddin Al-Anwar obtained his BS degree in Chemistry from the Faculty of Science, Assiut University, Egypt, in 1983 and his MS degree in Organic Chemistry from the Faculty of Science, Banha University, Egypt, in 2010. Currently, he is finalizing his PhD in the Faculty of Science, Alazhar University. His experience is in examination and analysis of toxic substances and drugs in blood, urine, body fluids and tissues in different media.
References
[1] Hatairat S, Ornanong A, Wimol N, Ponlayuth S, Sorapong J. Korean J. Chem. Eng. 2015, 32, 896–902.Search in Google Scholar
[2] Hashem A, Ahmad F, Fahd R. Adsorpt. Sci. Technol. 2008, 26, 563–579.10.1260/026361708788059866Search in Google Scholar
[3] Thenmozhi R, Santhi T. Res. Chem. Intermed. 2015, 41, 1327–1341.10.1007/s11164-013-1276-zSearch in Google Scholar
[4] Zhu Y, Zheng Y, Wang W, Wang A. J. Water Process Eng. 2015, 7, 218–226.10.1016/j.jwpe.2015.06.010Search in Google Scholar
[5] Di Natale F, Erto A, Lancia A, Musmarra D. J. Hazard. Mater. 2015, 281, 47–55.10.1016/j.jhazmat.2014.07.072Search in Google Scholar PubMed
[6] Jainae K, Sukpirom N, Fuangswasdi S, Unob F. J. Ind. Eng. Chem. 2015, 23, 273–278.10.1016/j.jiec.2014.08.028Search in Google Scholar
[7] Hashem A, AzzeerAM, Ayoub A. Polym.-Plast. Technol. Eng. 2010, 49, 1395–1404.10.1080/03602559.2010.482085Search in Google Scholar
[8] Hashem A, Hussein HA, Sanousy MA, Adam E, Saad EE. Polym. Plast. Technol. Eng. 2011, 50, 1220–1230.10.1080/03602559.2011.566301Search in Google Scholar
[9] Hashem A, Alkheraije Kh A. J. Environ. Prot. 2013, 4, 280–289.10.4236/jep.2013.43033Search in Google Scholar
[10] Huang S, Lin G. J. Environ. Health Sci. Eng. 2015, 13,1–8.10.1186/s40201-015-0157-3Search in Google Scholar PubMed PubMed Central
[11] Ding Z, Yu R, Hu X, Chen Y. J. Environ. Stud. 2014, 23, 1115–1121.Search in Google Scholar
[12] Tran L, Wu P, Zhu Y, Yang L, Zhu N. J. Colloid Interface Sci. 2015, 445, 348–356.10.1016/j.jcis.2015.01.006Search in Google Scholar PubMed
[13] Xiong C, Li Y, Wang G, Fang L, Zhou S, Yao C, Chen Q, Zheng X, Qi D, Fu Y, Zhu Y. Chem. Eng. J. 2015, 259, 257–265.10.1016/j.cej.2014.07.114Search in Google Scholar
[14] Tsai SC, Juang KW. J. Radioanal. Nucl. Chem. 2000, 243, 741–746.10.1023/A:1010694910170Search in Google Scholar
[15] Sheng PX, Ting YP, Chen JP, Hong L. J. Colloid Interface Sci. 2004, 275, 131–141.10.1016/j.jcis.2004.01.036Search in Google Scholar
[16] Hashem A. Polym.-Plast. Technol. Eng. 2006, 45, 35–42.10.1080/03602550500371620Search in Google Scholar
[17] Trivedi HC, Patel VM, Patelm RD. Eur. Polym. J. 1973, 9, 525–531.10.1016/0014-3057(73)90036-0Search in Google Scholar
[18] Ho YS, McKay G. Water Res. 2000, 34, 735–742.10.1016/S0043-1354(99)00232-8Search in Google Scholar
[19] Weber WJ, Morris JC. Proc. 1st. Int. Conf. Water Pollut. Res. 1962, 2, 231–266.Search in Google Scholar
[20] Tutem E, Apak R, Unal CF. Water Res. 1998, 32, 2315–2324.10.1016/S0043-1354(97)00476-4Search in Google Scholar
[21] Chien SH, Clayton WR. Soil Sci. Soc. Am. J. 1980, 44, 265–268.10.2136/sssaj1980.03615995004400020013xSearch in Google Scholar
[22] Wu FC, Tseng RL, Juang RS. Environ. Technol. 2001, 22, 205–213.10.1080/09593332208618296Search in Google Scholar
[23] Annadurai G, Juang RS, Lee DJ. J. Hazard. Mater. 2002, 92, 263–274.10.1016/S0304-3894(02)00017-1Search in Google Scholar
[24] Poots VJP, McKay G, Healy J. J. Water Pollut. Control Fed. 1978, 50, 926–935.Search in Google Scholar
[25] Nagarethinam K, Mariappan MS. Dyes Pigm. 2001, 51, 25–40.10.1016/S0143-7208(01)00056-0Search in Google Scholar
[26] Langmuir I. J. Am. Chem. Soc. 1916, 38, 2221–2295.10.1021/ja02268a002Search in Google Scholar
[27] Freundlich H. J. Phys. Chem. 1906, 57, 385–470.Search in Google Scholar
[28] Tempkin MJ, Pyzhev V. Acta Physiochim. URSS 1940, 12, 217–222.Search in Google Scholar
[29] Dubinin MM. Zh. Fiz. Khim. 1965, 39, 1305–1317.Search in Google Scholar
[30] Halsey G. J. Chem. Phys. 1948, 16, 931–937.10.1063/1.1746689Search in Google Scholar
[31] Redlich O, Peterson D. J. Phys. Chem. 1959, 63, 1024–1026.10.1021/j150576a611Search in Google Scholar
[32] Toth J. Acta Chem. Acad. Hung. 1971, 69, 311–317.Search in Google Scholar
[33] Sips R. J. Chem. Phys. 1948, 16, 490–495.10.1063/1.1746922Search in Google Scholar
[34] Khan AR, Ataullah R, Al-Haddad A. J. Colloid Interface Sci. 1997, 194, 154–165.10.1006/jcis.1997.5041Search in Google Scholar
[35] Radke CJ, Prausnitz JM. Ind. Eng. Chem. Fund. 1972, 11, 445–451.10.1021/i160044a003Search in Google Scholar
[36] Foo KY, Hameed BH. Chem. Eng. J. 2010, 156, 2–10.10.1016/j.cej.2009.09.013Search in Google Scholar
[37] Baudo M. Etude des interactions solute-fibres de charbon actif. Application et regeneration, PhD Thesis, Universite de Rennes, I, 1990.Search in Google Scholar
[38] Fritz W, Schlunder EU. Chem. Eng. Sci. 1974, 29, 1279–1282.10.1016/0009-2509(74)80128-4Search in Google Scholar
[39] Kannan N, Malar SJS. Ind. J. Chem. Technol. 2005, 12, 522–527.Search in Google Scholar
[40] Meng X, Hua Z, Dermatas D, Wang W, Kuo HY. J. Hazard. Mater. 1998, 57, 231–241.10.1016/S0304-3894(97)00091-5Search in Google Scholar
[41] Meera MS, Ganesan TK. J. Adv. Chem. Sci. 2015, 1, 89–92.Search in Google Scholar
[42] Khairi NAS, Yusof NA, Abdullah A, Mohammad F. Int. J. Mol. Sci. 2015, 16, 10562–10577.10.3390/ijms160510562Search in Google Scholar PubMed PubMed Central
©2016 by De Gruyter
This article is distributed under the terms of the Creative Commons Attribution Non-Commercial License, which permits unrestricted non-commercial use, distribution, and reproduction in any medium, provided the original work is properly cited.
Articles in the same Issue
- Frontmatter
- In this issue
- Editorial
- Science needs passion – science is passion – science gives passion
- Original articles
- Performance evaluation of various bioreactors for methane fermentation of pretreated wheat straw with cattle manure
- Recyclable graphene-supported palladium nanocomposites for Suzuki coupling reaction
- Optimization of the asymmetric synthesis of chiral aromatic alcohol using freeze-dried carrots as whole-cell biocatalysts
- Green synthesis of 2-aryl benzothiazole heterogenous catalyzed by MoO3 nanorods
- Factorial design study to access the “green” iodocyclization reaction of 2-allylphenols
- Stereoselective synthesis of (1S,2S)-1-phenylpropane-1,2-diol by cell-free extract of Lactobacillus brevis
- Ultrasound-assisted preparation of ZnO nanostructures: understanding the effect of operating parameters
- Study of anti-cancer properties of green silver nanoparticles against MCF-7 breast cancer cell lines
- Syntheses of ultra-fine barium carbonate powders by homogeneous precipitation method
- Green synthesis of novel antioxidant luminescent silica nanoparticle embedded carbon nanocomposites from a blue-green alga
- Preparation of TiC by carbothermal reduction in vacuum and acid leaching using blast furnace slag bearing titania
- Ultrasound assisted three phase partitioning of peroxidase from waste orange peels
- Isotherms and kinetic studies on adsorption of Hg(II) ions onto Ziziphus spina-christi L. from aqueous solutions
- Conference announcement
- Conferences 2016–2017
- Book reviews
- Ionic liquids in the biorefinery concept: challenges and perspectives
- Sustainable catalysis