Chemically modified Retama raetam biomass as a new adsorbent for Pb(II) ions from aqueous solution: non-linear regression, kinetics and thermodynamics
-
Ali Hashem
Ali Hashem obtained his BS degree in Chemistry from the Faculty of Science, Assiut University, in 1983. He obtained his MS degree in Organic Chemistry from the Faculty of Science, Zagazig University, Egypt, in 1989. He obtained his PhD in Organic Chemistry from the Faculty of Science, Cairo University, Cairo, Egypt, in 1993. He was then appointed as a researcher in the Department of Pretreatment and Finishing of Cellulose Based Textiles, Textile Research Division, National Research Centre, Egypt. He was promoted to Associate Professor in the same department in 2001, then promoted to Full Professor in 2006. He worked in the Textile Engineering Department, Mehran University, Pakistan, for 1 year in 2008 as a Foreign Professor. Currently he is working as Professor of Organic Chemistry at Shaqra University, Saudi Arabia. His main research interests are cellulose and carbohydrate chemistry, adsorption chemistry and wastewater treatment, polymer chemistry and color chemistry. He is author or co-author of about 60 peer-reviewed publications.
 ,
Hamdy A. Hammad
,
Hamdy A. Hammad
Hamdy A. Hammad is a Professor of inorganic chemistry, Faculty of Science, Al-Azhat University, Cairo Egypt.
Alaauddin Al-Anwar obtained his BS degree in Chemistry from the Faculty of Science, Assiut University, Egypt, in 1983. He obtained his MS degree in Organic Chemistry from the Faculty of Science, Banha University, Egypt, in 2010. Currently, he is finalizing his PhD in the Faculty of Science, Alazhar University. His experience is in examination and analysis of toxic substances and drugs in blood, urine, body fluids and tissues in different media.

Abstract
Retama raetam (RR), a desert plant, was chemically modified by the reaction with succinic acid at high temperature to form succinic acid treated R. raetam (STRR). Three levels containing different carboxyl contents of STRR were prepared. Native RR and STRR were characterized by Fourier transform infrared spectroscopy (FTIR), scanning electron microscopy (SEM) and estimation of carboxyl content to support the adsorption of Pb(II) ions. The STRR adsorbent was utilized as adsorbent material for the removal of Pb(II) ions from aqueous solutions. The effect of various parameters like pH, adsorbent concentration, contact time, temperature and initial concentration was investigated using batch process to optimize conditions for maximum adsorption. The adsorbent data were analyzed using two-, three-, four- and five-parameter models at 30°C by non-linear regression analysis. The examination of error analysis methods showed that the Langmuir-Freundlich model provides the best fit for experimental data compared with other isotherms. The maximum biosorption capacity of Pb(II) ions was up to 270.27 mg/g at 30°C. The thermodynamics constants of the adsorption process, viz., ΔHo, ΔGo and ΔSo, were evaluated. The results showed that the adsorption of Pb(II) ions onto STRR was endothermic and spontaneous. The adsorption data followed second-order kinetics, supporting that chemisorption process was involved.
1 Introduction
Heavy metals in water have been a major preoccupation for researchers for many years due to their toxicity towards aquatic life, human beings and the environment. As they do not degrade biologically like organic pollutants, their presence in industrial effluents and drinking water is a public health problem.
Lead is recognized as multifunctional metal, which is an essential element to produce pipes, paints and bullets and also one of the metals used in the pewter industry. The purpose of lead in industrial sector brings leaded-waste production. Lead is a poisonous metal that can damage the human nervous system and cause brain disorder. A long-term exposure to lead may cause nephropathy and abdominal pains and may be particularly harmful to a woman’s ability to reproduce [1]. The permissible level for lead in drinking water is 0.05 mg/l according to the US Environmental Protection Agency. Therefore, a very low concentration of lead in water is very toxic [2].
Various processes of heavy metals removal are used; we can cite precipitation, electro precipitation, electro coagulation, cementing and separation by membrane; the solvent extraction; and the exchange of ions on resins [3]. These methods have been found to be limited, as they often involve high capital and operational costs and incomplete removal [4] and may be associated with the generation of secondary waste, which is again to be treated or to be safely disposed off [5].
Adsorption provides one of the most effective methods for removing heavy metal ions from aqueous solution [6]. Activated carbon is the most widely used adsorbent for this purpose because of its extended surface area, microporous structure, high adsorption capacity and high degree of surface reactivity. However, commercially activated carbons are very expensive [7]. The agricultural wastes were considered as low cost, as they (1) require little processing and (2) are abundant in nature. Commonly, it concerns vegetal materials; then the term biosorption is used to designate the fixation of contaminants onto biomaterials.
Biosorption, as an alternate method, is becoming one of the most effective methods for the adsorption of heavy metals from wastewater. The main advantages of biosorption over the conventional treatment methods include high efficiency, low cost, minimization of chemical or biological sludge, regeneration of biosorbents and the possibility of metal recovery.
Recently, numerous low-cost alternative adsorbents have been examined for the removal of Pb(II) ions from aqueous solutions [8–13]. The abundance and availability of Retama raetam (RR) as a desert plant make them a good candidate for incorporation as precursor to prepare a new biosorbent of heavy metals from wastewater.
The present work was directed at improving the capability of RR for removing Pb(II) ions from aqueous solutions. To achieve this goal, the following studies were undertaken: (a) preparation of succinic acid treated Retama raetam (STRR) through a study of all the factors affecting modification of RR residues using succinic acid to obtain esterified products with a high carboxyl group content, (b) establishment of the conditions under which the maximum adsorption of Pb(II) ions onto STRR occur, (c) treatment of the equilibrium data using non-linear optimization techniques using five error functions for evaluating the fit of the isotherm equations in order to optimize the design of adsorption system for the removal of Pb(II) ions onto STRR and (d) evaluation of the kinetic and thermodynamic parameters for Pb(II) ions adsorption onto STRR.
2 Materials and methods
2.1 Materials
RR a desert plant, was obtained from the Martouh desert, Egypt. The roots were separated from the stems and leaves, washed with distilled water several times to remove the surface adhered particles and water-soluble particles and dried at 80°C in an electric oven for 24 h and ground using a mixer and passed through a 100- to 200-mm sieve. The roots were chosen because they contain the highest percentage of the cellulose content.
Lead acetate, mercuric acetate, cadmium acetate, zinc acetate, EDTA, sodium hydroxide and nitric acid were all used as laboratory-grade chemicals and supplied by Merck Company, Germany.
2.2 Methods
2.2.1 Preparation of STRR bio-adsorbent:
Three levels of succinic acid treated STRR with various carboxyl content were prepared by keeping other reaction conditions constant and varying the amount of succinic acid, as shown in Table 1. The reaction was carried out as follows: to a 400-ml beaker containing 4-g ground RR particles, certain weight of succinic acid (dissolved in the least amount of distilled water) was added under continuous mixing with a mechanical stirrer until a homogenous paste was obtained. The paste was then transferred to a Pyrex Petri dish and dried at 100°C for 1 h in an air-circulated oven. The dried material was thermally treated at 140°C for 2 h. The thermally treated sample was then cooled to room temperature and then ground. Soluble by-products and unreacted succinic acid were removed by extraction in a Soxhlet extractor for 3 h with a water/ethanol (20:80) mixture. The final purified material was dried for 5 h at 60°C. The adsorbent samples were characterized by scan electron microscopy (SEM) and estimation of carboxyl content.
The carboxyl content of native RR and STRR samples.
| Succinic acid (mmol/l) | -COOH content (meq/100 g sample) |
|---|---|
| 0 | 17.3 |
| 4.234 | 241.63 |
| 8.468 | 371.81 |
| 16.936 | 498.43 |
Reaction conditions: RR particles, 4 g; particle size, 100–200 μm; drying temperature, 100°C for 1 h; dehydration temperature, 140°C for 2 h.
2.2.2 Adsorption studies:
A known volume (100 ml) of a Pb(II) ions solution with a concentration in the range of 100–1000 mg/l was placed in a 125-ml Erlenmeyer flask. An accurately weighed sample of STRR adsorbent (0.05 g) with a particle size in the range of 50–150 μm was then added to the solution. A series of such flasks was prepared; the pH values of the contents were adjusted by the addition of 0.1 M HNO3 or 0.1 M NaOH and then shaken at a constant speed of 150 rpm in a shaking water bath at 30°C for a known time length. At the end of the agitation time, the metal ion solutions were separated by filtration. Blank experiments were carried out simultaneously without the addition of the STRR adsorbent. The extent of metal ion adsorption onto adsorbent was calculated mathematically by measuring the metal ion concentration before and after the adsorption through direct titration against the standard EDTA solution. The amount of Pb(II) ions adsorbed on STRR at equilibrium, qe (mg/g) and percent removal of lead were calculated according to the following relationships:
where Co and Ce are the initial and final concentrations of Pb(II) ions (mg/l), V is the volume of Pb(II) ions (l), W is the weight of STRR adsorbent (g). All experiments were carried out in duplicate, and the mean values of qe were reported.
2.3 Error analysis
In the single-component isotherm studies, the optimization procedure requires an error function to be defined to evaluate the fit of the isotherm to the experimental equilibrium data. The common error functions for determining the optimum isotherm parameters were sum of absolute errors (EABS), Marquardt’s percent standard deviation (MPSD), hybrid fractional error function (HYBRID), sum of the squares of the errors (ERRSQ), average percentage error (APE) and average relative error (ARE) [14]. In the present study, all error functions were used to determine the best fit in the isotherm model as:
2.3.1 The sum of absolute error (EABS):
2.3.2 Marquardt’s percent standard deviation (MPSD):
2.3.3 Hybrid fractional error function (HYBRID):
2.3.4 The sum of the squares of the error (ERRSQ):
2.3.5 Average percentage error (APE):
2.3.6 Average relative error (ARE):
2.4 Analyses
2.4.1 Fourier transform infrared spectroscopy (FTIR):
The FTIR spectroscopy was used to determine the vibrational frequencies of the functional groups in the adsorbents. The infrared (IR) spectra were recorded on a Perkin-Elmer Spectrum 1000 spectrophotometer over 4000–400 cm-1 using KBr disk technique.
2.4.2 Scanning electron microscopy (SEM):
To carry out the SEM analysis, the sample was first mounted on a standard microscope stub and coated with a thin layer of gold using a Polaron Diode Sputter unit. The analysis was performed using a JEOL JSM 840 scanning electron microscope. The SEM was used to identify the surface quality and morphology of RR and STRR before and after Pb(II) adsorption.
2.4.3 Carboxyl content:
The carboxy group contents of the modified and unmodified adsorbents were estimated according to the method reported [15] as follows: an accurate amount (0.2 g) of adsorbent was introduced into a 125-ml Erlenmeyer flask containing 50 ml of NaOH solution (0.03 N), a corresponding blank experiment was carried out without the addition of the adsorbent sample. The flasks were left overnight at room temperature, after which the contents were titrated with standard HCl solution using phenolphthalein as the indicator. The carboxy group content of the modified starch was calculated as follows:
where Vo is the volume of HCl (ml) consumed in the blank experiment, V1 is the volume of HCl (ml) consumed by the adsorbent sample, N is the normality of the standard HCl solution, and W is the weight of adsorbent (g).
3 Results and discussion
3.1 Characterization of adsorbent
The adsorbent material was examined with Hg(II), Pb(II), Cd(II) and Zn(II) ions in preliminary study. It was found (data not shown) that the percent removal of succinic acid treated STRR towards these metal ions follows the following order:
The obtained order is due to the higher charge surface of Pb(II) ions than Cd(II), Hg(II) and Zn(II) ions and can be correlated with the hydrated cation radius, which is the smallest for Pb(II) [16, 17].
It is clear also from the preliminary study that the percent removal of Pb(II) ions onto succinic acid treated STRR increases with increase in carboxyl content of the prepared samples. The enhancement of the adsorption capacity with the increase in the carboxyl content may be attributed to the following:
higher number of active binding sites after modification, better ion-exchange properties and formation of new functional groups that favor metal uptake;
more carboxyl groups could be interacted with metal ions, and consequently, the adsorption capacity was greatly improved; and
the carboxyl groups in STRR have adequate physical and chemical characteristic, which lead to a corresponding enhancement in the metal ions adsorption capacity.
Therefore, adsorption studies of Pb(II) ions were investigated in details in this study using the higher carboxyl content as adsorbent material.
3.1.1 Fourier transform infrared spectroscopy (FTIR) studies: FTIR spectra
The FTIR spectra of RR, STRRR and Pb(II) ions loaded STRR are illustrated in Figure 1A, B and C, respectively. The difference in the fingerprint regions of the spectra is clear and confirms the modification and adsorption processes.
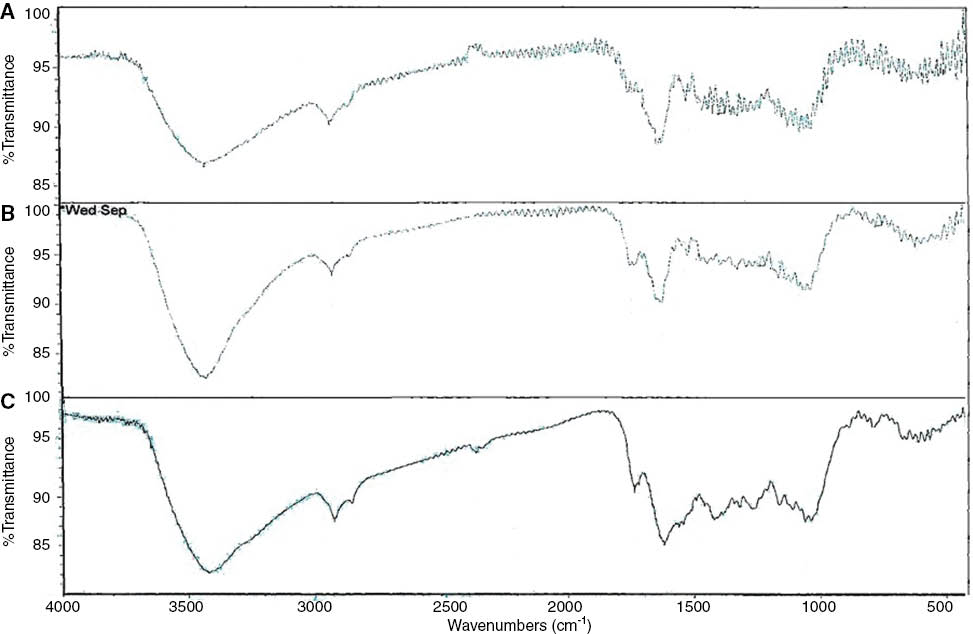
FTIR spectra of RR (A), STRR (B) and Pb(II) ions loaded STRR (C).
Figure 1A shows a broadband at ≈3420 cm-1, characteristic of the hydroxyl group of RR cellulose. The bands at 2928.54 cm-1 in IR spectra of RR biomass may be due to the C-H stretching vibrations. The band appearing at 1744.03 cm-1 is attributed to the formation of oxygen functional groups like a highly conjugated C=O stretching in carboxylic groups.
Figure 1B shows the appearance of new peak at 1618.95 cm-1 characteristic of the carboxylic acid ester due to the formation of STRR after thermal treatment with succinic acid.
The appearance of new peaks at 1433.38, 2027.07, 2052.42, 2077.75, 2103.11, 2128.48 and 2153.72 cm-1 could be attributed to the chemical modification of RR to from STRR. The bands in Figure 1A and B are in accordance with data obtained in similar work [18].
Figure 1C exhibits broadening at 3428.46 cm-1 compared with the spectra of RR, and this can be attributed to the adsorption of Pb(II) ions onto the adsorbent (STRR). Figure 1C also exhibits a small shift in the absorbance peaks in Pb(II) loaded STRR compared with that in RR and STRR (Figure 1A and B). The peak at 1618.95 cm-1 was shifted to 1615.75 cm-1. The peak observed at 1316.23 cm-1 was shifted to 1315.58 cm-1. The peak at 1153.41 cm-1 was shifted to 1158.2 cm-1. It should also be noted that the FTIR results did not provide any quantitative analysis as well as the information about the level of affinity to metal of the functional groups presented in the adsorbents. They only presented the possibility of the coupling between the metal species and the functional group of the adsorbents.
3.1.2 Scanning electron microscopy (SEM) studies
The surface morphologies of the RR, succinic acid treated STRR and Pb(II) ions-loaded STRR are shown in Figure 2A, B and C, respectively. SEM micrograph of RR and STRR (Figure 2A and B) reveals the irregular nature of biomass particles, which is rough and heterogeneous with considerable amount of voids and lot of ups and downs. The adsorption of Pb(II) ions by STRR is demonstrated by the change in morphology in the surface of adsorbent (Figure 2C). After Pb(II) ions adsorption, the tubes appear to be prominently swollen as Pb(II) ions enter the pores of the STRR (Figure 2C). This observation indicates that Pb(II) ions are adsorbed to the functional groups present inside the internal wall of the STRR structure. Based on the surface morphology results of STRR, it is suggested that STRR can be used as adsorbent for liquid-solid adsorption processes.
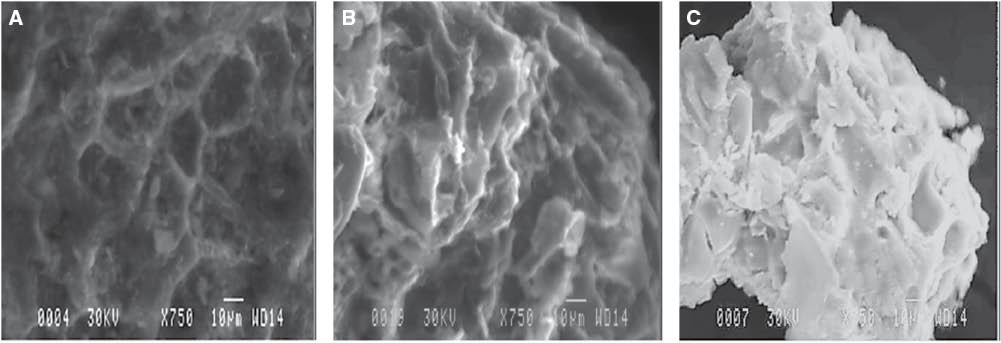
SEM of RR (A), STRR (B) and Pb(II) ions loaded STRR (C).
3.2 Factors affecting adsorption of Pb(II) ions onto STRR
3.2.1 Effect of pH of adsorbate
Figure 3 shows the adsorption capacity of STRR towards Pb(II) ions as a function of the pH value of the adsorbate at fixed adsorbent concentration, fixed agitation time and fixed adsorbate concentration at 30°C. It is clear from the figure that the adsorption capacity of STRR particles towards Pb(II) ions increased as the pH value of the solution increased within the range studied from 2 to 4.5. The adsorption capacity towards Pb(II) ions was a minimum under highly acidic conditions (pH=2). This was because the binding sites for metal ions onto the adsorbent were mainly occupied by H+ ions, which restricted the approach of Pb(II) ions cations as a result of repulsive forces. However, as the pH value of the solution increased, the number of associated H3O+ ions diminished, exposing an increasing proportion of the negatively charged adsorbent surface and thereby allowing an increasing number of positively charged Pb(II) ions to be adsorbed [13]. At pH values above 4.5, no further adsorption occurred due to the precipitation of Pb(II) ions as Pb(OH)2 [13].
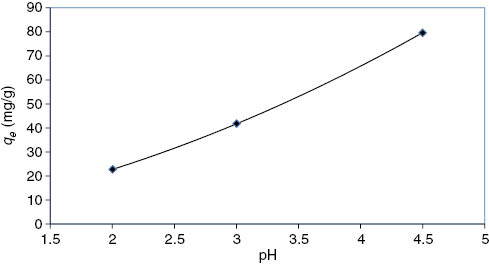
Effect of pH on adsorption capacity of Pb(II) ions onto STRR at 30°C.
3.2.2 Effect of adsorbent dose
The dependence of the adsorbent dose on both the adsorption capacity and the percentage removal of Pb(II) ions onto STRR was studied at pH 4.5, employing adsorbent doses within the range of 0.5–5 g/l at 30°C (Figure 4). It is apparent from the corresponding data depicted in Figure 4 that the percentage removal of Pb(II) ions increased with the increasing adsorbent dosage, which may be due to the increase in the surface area of the adsorbent and the availability of more adsorption sites. On the other hand, the adsorption capacity (qe) or the amount of Pb(II) ions adsorbed per unit mass of adsorbent decreased with increasing adsorbent dosage. This behavior may be due mainly to the overlapping of the adsorption sites as a result of the overcrowding of adsorbent particles in the system and also to the competition among Pb(II) ions for surface sites [19].
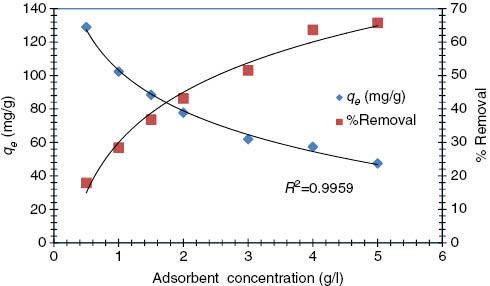
Effect of adsorbent concentration on both adsorption capacity and % removal of Pb(II) ions onto STRR at 30°C.
3.2.3 Effect of contact time and adsorbate concentration
Figure 5 shows the effect of contact time and adsorbate concentrations (204 and 398 mg/l) on the adsorption capacity of STRR towards Pb(II) ions. It will be seen from the figure that the adsorption capacity (mg/g) increased with the increase in contact time and concentration of adsorbate but remained virtually constant after equilibrium had been attained. This equilibrium time increased with the increase in the concentration of adsorbate in the system. Thus, equilibrium times of 30 and 45 min were observed for initial adsorbate concentrations of 204 and 398 mg/l, respectively. It is clear that the adsorption capacity of STRR towards Pb(II) ions depended on the adsorbate concentration, with the contact time required for Pb(II) ions removal being quite small. This latter observation is an important parameter for the possible application of STRR for economical wastewater treatment plant applications.

Effect of adsorbent concentration on both adsorption capacity and % removal of Pb(II) ions onto STRR at 30°C.
3.2.3.1 Adsorption kinetics
Kinetic analysis is required to get an insight on the rate of adsorption and the rate-limiting step of the transport mechanism, which are primarily used in the modeling and design of the process. The kinetic models were pseudo-first-order, pseudo-second-order, intra-particle diffusion, Bangham’s equations and Elovich model, which are expressed as follows:
The pseudo-first-order model [20] is represented as:
The pseudo-second-order model [21] is represented as:
The intra-particle diffusion model [22] can be expressed by the following equation:
where k is the pseudo-first-order rate constant (mg/g/min); k2 is the pseudo-second-order rate constant (g/mg/min); kP is the intra-particle diffusion rate constant
Bangham’s equation [23] was employed for applicability of adsorption of Pb(II) onto STRR. Bangham’s equation was used to evaluate whether the adsorption is pore-diffusion controlled.
where Co is the initial concentration of the adsorbate (mg/l), V is the volume of the adsorbate (ml), m is the weight of adsorbent (g/l), q (mg/g) is the amount of adsorbate retained at time t, and α (<1) and k are the constants.
The Elovich model equation [24] is generally expressed as:
where α (mg/g/min) is the initial adsorption rate and the parameter β (g/mg l) is related to the extent of surface coverage and activation energy for chemisorption.
Pseudo-first-order model rendered the rate of occupation of the adsorption sites to be proportional to the number of unoccupied sites. A pseudo-first-order kinetic process (Eq. 10) is usually considered physical adsorption, and the whole process is diffusion controlled. The slopes and intercepts of plots of log (qe-qt) vs. t for the concentrations of 204 and 398 mg/l were used to determine the pseudo-first-order constant and equilibrium adsorption density, qe. However, qe of experimental data deviated considerably from the theoretical data from the pseudo-first-order model (Table 2). A comparison of the results with the correlation coefficients is shown in Table 1. The correlation coefficients for the pseudo-first-order kinetic model obtained for concentrations of 204 and 398 mg/l were low (Figure 6). This suggests that this adsorption of Pb(II) ions onto STRR is not acceptable for pseudo-first-order reaction.
Kinetic parameters for adsorption of Pb(II) ions onto STRR at 30°C.
| Models | Parameters | Values | |
|---|---|---|---|
| (204 mg/l) | (398 mg/l) | ||
| Pseudo-first order | k1 | 0.0013818 | 0.0013818 |
| R2 | 0.673 | 0.8411 | |
| qe (exp.) | 121.3856 | 132.7655 | |
| qe (calc.) | – | – | |
| Pseudo-second order | K2 | 0.001036849 | 0.001110208 |
| qe (exp.) | 121.3856 | 132.7655 | |
| qe (calc.) | 114.9425287 | 136.9863014 | |
| R2 | 0.9876 | 0.9989 | |
| Bangham’s equation | Ko | 23.69321163 | 19.20984823 |
| α | 0.1997 | 0.1283 | |
| R2 | 0.8954 | 0.9773 | |
| Intra-particle diffusion | KP | 7.3638 | 4.1825 |
| C | 50.746 | 86.999 | |
| R2 | 0.9718 | 0.9797 | |
| Elovich equation | α | 121.7031047 | 1593.614413 |
| β | 0.062861453 | 0.07384979 | |
| R2 | 0.8676 | 0.9785 | |
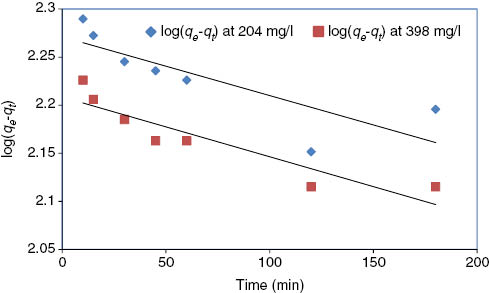
Pseudo-first-order reaction of Pb(II) ions onto STRR at 30°C.
Pseudo-second-order kinetic model (Eq. 11) is assumed as the chemical reaction mechanisms [25], and the biosorption rate is controlled by chemical biosorption through sharing or exchange of electrons between the adsorbate and adsorbent. Therefore, the adsorption behavior belonging to the pseudo-second-order kinetic model is a chemical process. The pseudo-first-order and pseudo-second-order kinetic models cannot describe the diffusion mechanism, thus kinetic results need to be evaluated by using the intra-particle diffusion model, as given in Eq. 11.
The slopes and intercepts of plots t/qt vs. t were used to calculate the pseudo-second-order rate constants k2 and qe. The straight lines in plots of t/q vs. tFigure 7 show good agreement of experimental data with the pseudo-second-order kinetic model for concentrations of 204 and 398 mg/l. Table 2 lists the computed results obtained from the pseudo-second-order kinetic model. The correlation coefficients for pseudo-second-order kinetic model obtained were >0.98 for the two concentrations used. The calculated qe values also agree very well with the experimental data (Table 2). These indicate that the adsorption of Pb(II) ions onto STRR is acceptable to the second-order kinetic model.
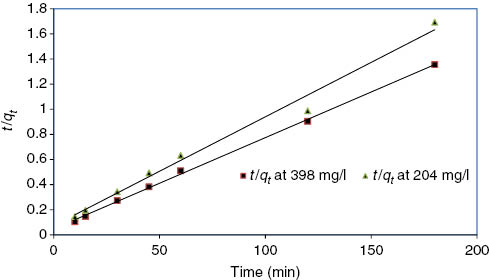
Pseudo-second-order reaction of Pb(II) ions onto STRR at 30°C.
The slopes and intercepts of plots qt vs. t1/2 were used to calculate the intra-particle diffusion rate constant kP. The straight lines in plots of qt vs. t1/2 (Figure 8) show good agreement of experimental data with the intra-particle diffusion model for concentrations of 204 and 398 mg/l.
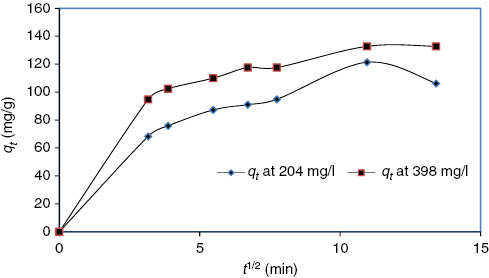
Intra-particle diffusion of Pb(II) ions onto STRR.
Such plots may present a multilinearity [26, 27], indicating that two or more steps take place. The first portion is the external surface adsorption or instantaneous adsorption stage. The second portion is the gradual adsorption stage, where intra-particle diffusion is rate-controlled. The third portion is the final equilibrium stage, where intra-particle diffusion starts to slow down due to extremely low adsorbate concentrations in the solution. Figure 9 shows a plot of the linearized form of the intra-particle diffusion model for concentrations of 204 and 398 mg/l. Furthermore, such deviation of straight line from the origin (Figure 9) indicates that the pore diffusion is not the rate-controlling step [28]. The values of kP (mg/g/min) obtained from the slope of the straight line (Figure 9) are listed in Table 2. The value of R2 for the plot is listed also in Table 2. The values of intercept C (Table 2) give an idea about the boundary layer thickness, i.e. the larger the intercept, the greater the boundary layer effect [29]. This value indicates that the adsorption of Pb(II) ions onto STRR is acceptable for intra-particle diffusion mechanism.
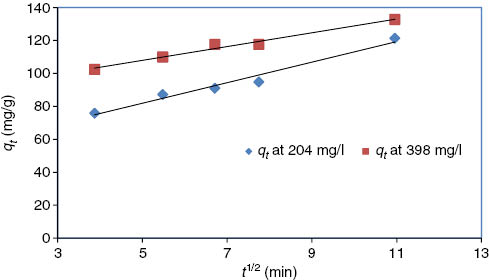
Test intra-particle diffusion of Pb(II) ions onto STRR.
The plots of
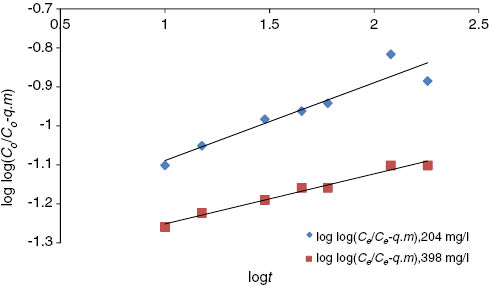
Bangham’s model of Pb(II) ions onto STRR.
If Pb(II) ions adsorption onto STRR fits the Elovih model, a plot of qt vs. ln(t) should yield a linear relationship with a slope of (1/β) and an intercept of (1/β) ln(αβ). The straight lines in plots of qt vs. ln(t) (Figure 11) show good agreement of experimental data with the Elovich model for concentrations of 204 and 398 mg/l (R2>0.90). This suggests that this adsorption system is acceptable for this system.
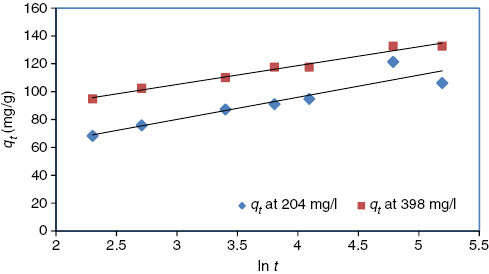
Elovich model of Pb(II) ions onto STRR.
3.2.4 Effect of temperature on adsorption of Pb(II) onto STRR
The effect of temperature on the adsorption capacity of Pb(II) ions onto STRR. was studied at pH 4.5, employing adsorbent dose of 0.3 g/l under different temperatures at 30, 40 and 50°C, as shown in Figure 12. The data from this figure indicate that the adsorption capacity increases with the increase in temperature from 30 to 50°C. This increase may be attributed to the development of new active sites at high temperature or to the increase of the chance of metal ions diffusion into the adsorbent. The observed data also suggest that STRR can be considered as an efficient adsorbent for Pb(II) ions from aqueous solution.
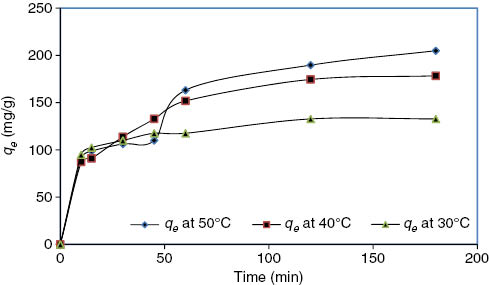
Effect of duration temperature on adsorption capacity of Pb(II) ions onto STRR.
3.2.4.1 Thermodynamic parameters
The original concepts of thermodynamics assume that in an isolated system, where energy cannot be gained or lost, the entropy change is the driving force. In environmental engineering practice, both energy and entropy factors must be taken into account in determining what processes will occur spontaneously.
Thermodynamic parameters such as the standard free energy (ΔGo), the enthalpy change (ΔHo) and the entropy change (ΔSo) have been calculated for the present system using the following equations [30]:
where Ko is equilibrium constant, Csolid is solid phase concentration at equilibrium (mg/l), Cliquid is liquid phase concentration at equilibrium (mg/l), T is absolute temperature in Kelvin, and R is a gas constant. Free energy values are obtained from the above equations at all temperatures; enthalpy and entropy value is calculated from the slope and intercept of plot lnK against 1/T, as shown in Figure 13 and Table 3. The negative values of ΔGo in the range of 30–50°C (303–323 K) indicate the spontaneous nature of the adsorption of Pb(II) ions onto STRR. The positive values of ΔHo in the range of 30–50°C listed in Table 3 suggest that the adsorption process was endothermic over this temperature range. The positive values of ΔSo in the range of 40–50°C show the increase in randomness at the solid/solution interface during the adsorption of Pb(II) ions onto STRR.
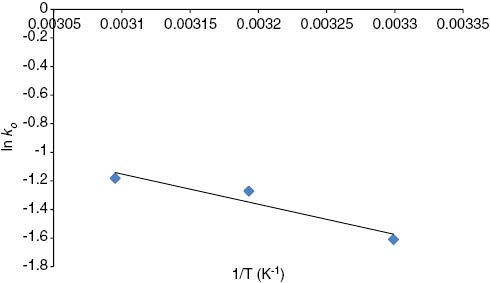
Van’t Hoff plot of the effect of temperature on adsorption of Pb(II) ions onto STRR.
Thermodynamic parameters for the adsorption of Pb(II) ions onto STRR at different temperatures.
| Temperature (K) | ΔGo (KJ/mol) | ΔHo (KJ/mol) | ΔSo (KJ/mol K) |
|---|---|---|---|
| 303 | -40.03223 | ||
| 313 | -32.6628 | ||
| 323 | -31.3329 | 173.42 | 0.4425 |
3.2.5 Effect of adsorbate concentration (adsorption isotherm)
Adsorption isotherm describes how adsorbates interact with adsorbents and are critical in optimizing the use of adsorbents. The amount of adsorbate per unit mass of adsorbent at equilibrium, qe (mg/g), and the adsorbate equilibrium concentration, Ce (mg/l), allows plotting the adsorption isotherm, qe vs. Ce (Figure 14), at 30°C and mathematical models can be used to describe and characterize the adsorption process. The most common isotherms for describing solid-liquid sorption systems are Langmuir, Freundlich, Temkin, Dubinin and Halsey (two-parameter isotherms); Redlich-Peterson, Toth, Sips, Khan and Hill, Radke-Praunsnitz and Freudlich-Langmuir (three-parameter isotherms); Baudo and Fritz-Schlunder (four-parameter isotherms); and Fritz-Schlunder (five-parameter isotherm). Therefore, in order to investigate the adsorption capacity of Pb(II) ions onto STRR, the experimental data were fitted to these equilibrium models.
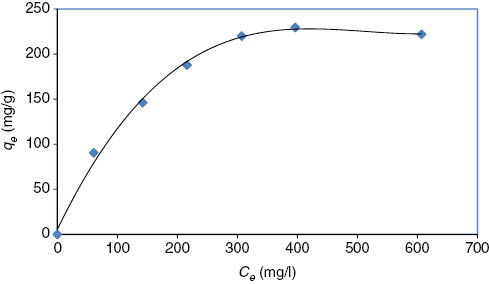
Equilibrium adsorption isotherm of Pb(II) ions onto STRR at 30°C.
3.3 Two-parameter isotherms
3.3.1 The Langmuir isotherm
The Langmuir equation [31] was applied for adsorption equilibrium of Pb(II) ions by STRR. The assumption of this model is based on the maximum adsorption corresponding to a saturated monolayer of adsorbate molecules on the adsorbent surface and the energy of adsorption is constant; as well, there is no transmigration of adsorbate in the plane surface. The non-linear form of the Langmuir isotherm is given by the following equation:
where aL is the Langmuir isotherm constant (l/mg), KL is the Langmuir constant (l/g), and aL/KL represents the adsorption capacity, Qmax.
3.3.2 The Freundlich isotherm
The Freundlich model [32] is a special case applied to non-ideal adsorption on heterogeneous surfaces and also to multilayer adsorption, suggesting that binding sites are not equivalent and/or independent. This model is described by Eq. 20 as follows:
where qe is the equilibrium concentration of Pb(II) ions on STRR adsorbent (mg/g), Ce is the equilibrium concentration of Pb(II) ions (mg/l), and KF (mg/g) and n are the Freundlich constants characteristic of the system, indicators of adsorption capacity and adsorption intensity, respectively.
3.3.3 Tempkin isotherm
The Temkin isotherm [33] has been used in the following form:
where R is the universal gas constant (8.31441 J/mol/K), T is the absolute temperature (K), AT is the Temkin isotherm constant (g/mg), and bT is the Temkin constant.
3.3.4 Dubinin-Radushkevich isotherm
This isotherm [34] is generally expressed as follows:
where qD and βD are Dubinin-Radushkevich constants.
3.3.5 Halsey isotherm
The Halsey [35] adsorption isotherm can be given as:
where kH and n are the Halsey isotherm constant and exponent, respectively. This equation is suitable for multilayer adsorption, and the fitting of the experimental data to this equation attests to the heteroporous nature of the adsorbent.
3.4 Three-parameter isotherms
3.4.1 Redlich-Peterson isotherm
The Redlich-Peterson model is used as a compromise between Langmuir and Freundlich models, which can be written as [36]:
where qe is the amount of mercury adsorbed (mg/g) at equilibrium, Ce (mg/l) is the concentration of adsorbate at equilibrium, A (l/g) and B are the Redlich constants, and g is an exponent that lies between 1 and 0.
3.4.2 Toth isotherm
Toth isotherm model [37] is useful in describing heterogeneous adsorption systems, which satisfy both low- and high-end boundary of the concentration [38]. It can be represented by the following equation:
where KT, aT and t are the Toth isotherm constants.
3.4.3 Sips isotherm
Sips isotherm [39] is a combined form of Langmuir and Freundlich expressions. Sips model can be represented by the following equation:
where ks is the Sips model isotherm constant (l/g), as the Sips model constant (l/mg), and Bs is the Sips model exponent.
3.4.4 Khan isotherm
The Khan isotherm [40] is a generalized model suggested for the pure solutions; bK and aK are devoted to the model constant and model exponent. The Khan isotherm model can be represented by the following:
Where bk is the Khan model constant, ak is the Khan model exponent, and qK is the maximum uptake (mg/g).
3.4.5 Radke-Prausnitz isotherm
The Radke-Prausnitz [41] isotherm can be represented as follows:
where αR and rR are Radke-Prausnitz model constants, and βR is the Radke-Prausnitz model exponent.
3.4.6 Langmuir-Freundlich isotherm
The Langmuir-Freundlich equation is given by [39] the following:
where qmLF is the Langmuir-Freundlich maximum adsorption capacity (mg/g), kLF is the equilibrium constant for a heterogeneous solid, and mLF is the heterogeneity parameter lies between 0 and 1.
3.4.7 Hill isotherm
The Hill model [42] assumes that adsorption process as a cooperative phenomenon, with the ligand binding ability at one site on the macromolecule, may influence the different binding sites on the same macromolecule. It is described by the following equation:
where kD, nH and sH are constants for the Hill model.
3.5 Four-parameter isotherms
3.5.1 Baudo isotherm
The Baudo isotherm [43] can be written in the following form:
where qe is the adsorbed amount at equilibrium (mg/g), Ce is the equilibrium concentration of adsorbate (mg/l), qmo is the Baudo maximum adsorption capacity (mg/g), bo is the equilibrium constant, and x and y are the Baudo parameters .
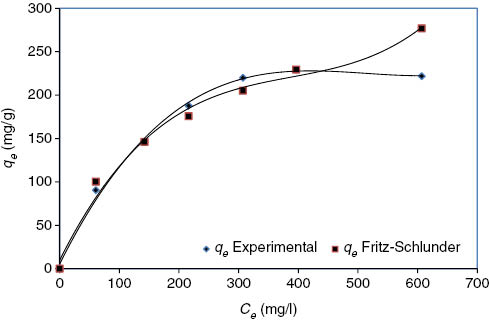
3.5.2 Fritz-Schlunder isotherm
Another four-parameter equation of the Langmuir-Freundlich type was developed empirically by Fritz and Schlunder [44]. It is expressed by the equation:
where qe is the adsorbed amount at equilibrium (mg/g), Ce is the equilibrium concentration of adsorbate (mg/l), A and B are the Fritz-Schlunder parameters, and α and β are the Fritz-Schlunder equation exponents. At high liquid-phase concentrations of the adsorbate, the last equation reduces to the Freundlich equation.
3.6 Five-parameter isotherm
3.6.1 Fritz-Schlunder isotherm
Fritz and Schlunder [44] have proposed a five-parameter empirical expression that can represent a broad field of equilibrium data as follows:
where qe is the adsorbed amount at equilibrium (mg/g), Ce is the equilibrium concentration of adsorbate (mg/l), qmFS is the Fritz-Schlunder maximum adsorption capacity (mg/g), and K1, k2, m1 and m2 are Fritz-Schlunder parameters.
The comparison of the adsorption capacity of various adsorbents reported in the literature for the removal of Pb(II) ions is shown in Table 4 [45–52]. It was found from this table that ZscL had a good affinity for removal of lead compared with other adsorbents.
Comparison of adsorption capacity of Pb(II) ions with different adsorbents.
| Adsorbents | Adsorption capacity (mg/g) | References |
|---|---|---|
| Carpobrotus edulis | 175.6 | [1] |
| Cereal chaff | 12.5 | [2] |
| Coir fibers | 52.03 | [3] |
| Corncobs native | 16.223 | [4] |
| Seed powder of Prosopis juliflora DC | 40.322 | [5] |
| Coffee residue activated with zinc chloride | 62.57 | [6] |
| Bagasse fly ash | 2.5 | [7] |
| Peanut husk | 29.14 | [8] |
| Modified RR | 270.27 | This study |
The comparison between the experimental data and the data obtained from two-, three-, four- and five-parameter models are shown in Figures 15–18; also, the constants and error analysis of two-, three-, four- and five-parameter models are given in Tables 5–8.
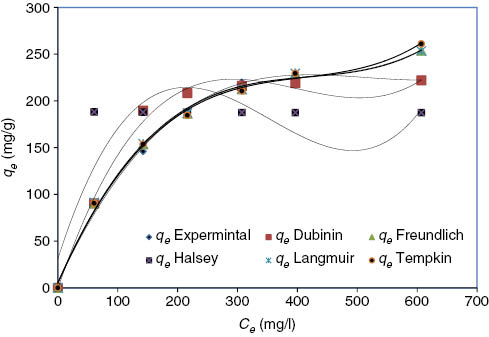
Comparison between experimental isotherm data and two parameter isotherm models at 30°C.
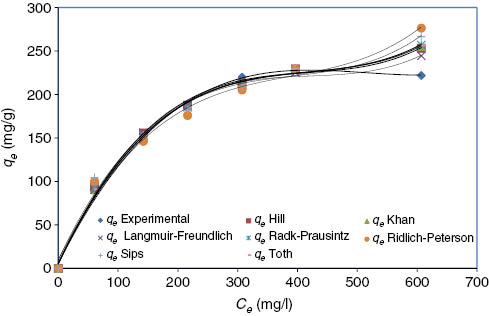
Comparison between experimental isotherm data and three parameter isotherm models at 30°C.
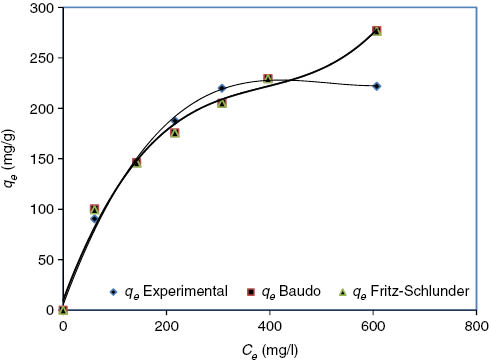
Comparison between experimental isotherm data and four parameter isotherm models at 30°C.
Comparison between experimental isotherm data and five parameters model at 30°C.
Constants and error analysis of two parameter models for adsorption of Pb(II) ions onto STRR at 30°C.
| Isotherm model | Parameter | Value | Error analysis | Value |
|---|---|---|---|---|
| Langmuir | aL | 0.006733267 | ARE | 0.247349389 |
| kL | 2.124195408 | APE% | 4.12248982 | |
| R2 | 0.9964 | EABS | 48.92859345 | |
| ERRSQ | 1119.482672 | |||
| Hybrid | 130.3757076 | |||
| MPSD | 0.950395394 | |||
| Freundlich | 1/n | 0.006574164 | ARE | 0.237351201 |
| KF | 2.087682924 | APE% | 3.95585335 | |
| R2 | 0.9966 | EABS | 48.43661977 | |
| ERRSQ | 1139.487872 | |||
| Hybrid | 131.6881337 | |||
| MPSD | 0.950375903 | |||
| Tempkin | AT | 0.055941135 | ARE | 0.287576971 |
| bT | 0.335905993 | APE% | 4.792949524 | |
| R2 | 0.9963 | EABS | 59.23353586 | |
| ERRSQ | 1686.520418 | |||
| Hybrid | 193.6349415 | |||
| MPSD | 0.953954626 | |||
| Dubinin-Radushkevich | qD | 223.9574539 | ARE | 0.470791475 |
| BD | 5.481504772 | APE% | 7.846524589 | |
| R2 | 0.9936 | EABS | 78.39972641 | |
| ERRSQ | 2444.103561 | |||
| Hybrid | 394.7665762 | |||
| MPSD | 0.964103316 | |||
| Halsey | KH | 189.7493474 | ARE | 1.851662039 |
| n | 512.273532 | APE% | 30.86103399 | |
| R2 | 0.8062 | EABS | 248.4297695 | |
| ERRSQ | 15300.64958 | |||
| Hybrid | 3382.060702 | |||
| MPSD | 0.989024283 |
Constants and error analysis of three parameter models for adsorption of Pb(II) ions onto STRR at 30°C.
| Isotherm model | Parameter | Value | Error analysis | Value |
|---|---|---|---|---|
| Redlich-Peterson | A | 44.9985596 | ARE | 0.48124521 |
| B | 2.532366587 | APE% | 8.020753497 | |
| G | 0.570182102 | EABS | 90.68868608 | |
| R2 | 0.9885 | ERRSQ | 3413.217275 | |
| Hybrid | 536.3108652 | |||
| MPSD | 0.964358888 | |||
| Toth | KT | 198.7074586 | ARE | 0.258202388 |
| aT | 128.492213 | APE% | 4.303373136 | |
| 1/t | 0.932172898 | EABS | 52.68334483 | |
| R2 | 0.9962 | ERRSQ | 1324.214887 | |
| Hybrid | 202.6312169 | |||
| MPSD | 0.954384556 | |||
| Sips | Ks | 12.92717763 | ARE | 0.483122377 |
| as | 0.018796871 | APE% | 8.052039612 | |
| βs | 0.548700874 | EABS | 82.49583849 | |
| R2 | 0.9874 | ERRSQ | 2390.215621 | |
| Hybrid | 405.2958621 | |||
| MPSD | 0.963047053 | |||
| Khan | qk | 300.6685587 | ARE | 0.243701515 |
| ak | 0.971566979 | APE% | 4.06169192 | |
| bk | 0.0069968 | EABS | 50.0568724 | |
| R2 | 0.9965 | ERRSQ | 1217.497182 | |
| Hybrid | 186.7975176 | |||
| MPSD | 0.95364419 | |||
| Hill | qSH | 315.6628174 | ARE | 0.271218049 |
| KD | 134.7140593 | APE% | 4.520300817 | |
| nH | 0.983336129 | EABS | 50.85634539 | |
| R2 | 0.9958 | ERRSQ | 1125.744088 | |
| Hybrid | 178.211759 | |||
| MPSD | 0.953700076 | |||
| Langmuir-Freundlich | qmLF | 283.1948574 | ARE | 0.228693331 |
| KLF | 0.008430565 | APE% | 3.811555524 | |
| mLF | 1.127343479 | EABS | 45.60993643 | |
| R2 | 0.9971 | ERRSQ | 703.6257967 | |
| Hybrid | 113.525732 | |||
| MPSD | 0.949558994 | |||
| Radke-Prausnitz | αR | 2.282828379 | ARE | 0.274955967 |
| rR | 215.4068542 | APE% | 4.582599446 | |
| βR | 0.059483839 | EABS | 54.53890182 | |
| R2 | 0.9958 | ERRSQ | 1353.08305 | |
| Hybrid | 207.8497585 | |||
| MPSD | 0.95470217 |
Constants and error analysis of four parameter models for adsorption of Pb(II) ions onto STRR at 30°C.
| Isotherm model | Parameter | Value | Error analysis | Value |
|---|---|---|---|---|
| Baudo | qmo | 110.3318171 | ARE | 0.488503762 |
| bo | 0.174803438 | APE% | 8.141729372 | |
| X | -0.684093654 | EABS | 91.82398137 | |
| Y | 0.124981885 | ERRSQ | 3489.593436 | |
| R2 | 0.9882 | Hybrid | 824.176304 | |
| MPSD | 0.968552795 | |||
| Fritz-Schlunder | A | 22.82461263 | ARE | 0.477184879 |
| α | 0.54976572 | APE% | 7.953081309 | |
| B | 0.572327782 | EABS | 90.45346683 | |
| β | 0.178684764 | ERRSQ | 3413.367706 | |
| R2 | 0.9888 | Hybrid | 801.8889732 | |
| MPSD | 0.968175349 |
Constants and error analysis of five parameter models for adsorption of Pb(II) ions onto STRR at 30°C.
| Isotherm model | Parameter | Value | Error analysis | Value |
|---|---|---|---|---|
| Fritz-Schlunder | QmFS | 49.35644567 | ARE | 0.487516289 |
| K1 | 6.909902393 | APE% | 8.125271477 | |
| K2 | 20.41101653 | EABS | 91.65286251 | |
| m1 | 0.860721485 | ERRSQ | 3476.673388 | |
| m2 | 0.422129557 | Hybrid | 1641.927696 | |
| R2 | 0.9882 | MPSD | 0.975247748 |
3.7 Error analysis and non-linear regression method
For non-linear method, a trial and error procedure, which is applicable to computer operation, is developed using a solver add-in (Microsoft Excel) The experimental data and the predicted isotherms by non-linear method for the adsorption of Pb(II) ions onto STRR were shown in Figures 15–18. The R2 value is used to minimize the error distribution between the experimental equilibrium data and the predicted isotherms. The calculated isotherm parameters and their corresponding coefficient of determination, error analysis of the parameters and R2 values were listed in Tables 4–7.
Among two-, three-, four- and five-parameter models, the highest R2 value and lowest average relative error (ARE), average percentage error (APE%), EABS, ERRSQ, MPSD and HYBRID indicated that the Langmuir-Freundlich (three-parameter isotherm) is the better fit than the rest of the isotherm models. The acceptable models for the experimental data follow the following order:
Langmuir-Freundlich (three-parameter isotherm) >Freunlich (two-parameter isotherm)>Fritz-Schlunder (four-parameter isotherm>Fritz-Schlunder (five-parameter isotherm).
4 Conclusions
RR particles were modified by treatment with succinic acid at high temperatures to obtain STRR. The RR and STRR samples were characterized by FTIR spectral analysis and SEM before and after adsorption of Pb(II) ions. The carboxyl contents of RR and STRR were also determined. STRR was utilized for the removal of Pb(II) ions from aqueous solution. The results indicated that the adsorption capacity of STRR towards Pb(II) ions was affected by pH value, adsorbent concentration, agitation time, initial metal ion concentration and temperature. Different isotherm models were used for the mathematical description of the equilibrium adsorption data of Pb(II) ions onto STRR at 30°C.
The results obtained showed that the adsorption equilibrium data were well fitted by the Langmuir model and the maximum adsorption capacity was 270.27 at 30°C. The negative values of ΔGo obtained via the appropriate thermodynamic relationship indicated the spontaneous nature of the adsorption of Pb(II) ions onto STRR. The positive values of ΔHo obtained over the temperature range of 30–50°C (303–323 K) indicated that the adsorption process was endothermic over this range. The positive values of ΔSo indicated that an increase in randomness occurred at the solid/solution interface during the adsorption of Pb(II) ions onto STRR over the temperature range of 30–50°C.
About the authors

Ali Hashem obtained his BS degree in Chemistry from the Faculty of Science, Assiut University, in 1983. He obtained his MS degree in Organic Chemistry from the Faculty of Science, Zagazig University, Egypt, in 1989. He obtained his PhD in Organic Chemistry from the Faculty of Science, Cairo University, Cairo, Egypt, in 1993. He was then appointed as a researcher in the Department of Pretreatment and Finishing of Cellulose Based Textiles, Textile Research Division, National Research Centre, Egypt. He was promoted to Associate Professor in the same department in 2001, then promoted to Full Professor in 2006. He worked in the Textile Engineering Department, Mehran University, Pakistan, for 1 year in 2008 as a Foreign Professor. Currently he is working as Professor of Organic Chemistry at Shaqra University, Saudi Arabia. His main research interests are cellulose and carbohydrate chemistry, adsorption chemistry and wastewater treatment, polymer chemistry and color chemistry. He is author or co-author of about 60 peer-reviewed publications.
Hamdy A. Hammad is a Professor of inorganic chemistry, Faculty of Science, Al-Azhat University, Cairo Egypt.

Alaauddin Al-Anwar obtained his BS degree in Chemistry from the Faculty of Science, Assiut University, Egypt, in 1983. He obtained his MS degree in Organic Chemistry from the Faculty of Science, Banha University, Egypt, in 2010. Currently, he is finalizing his PhD in the Faculty of Science, Alazhar University. His experience is in examination and analysis of toxic substances and drugs in blood, urine, body fluids and tissues in different media.
References
[1] Ibrahim MNM, Wan Ngah WS, Norliyana MS, Wan Daud WR, Rafatullah M, Sulaiman O, Hashim R. J. Hazard. Mater. 2010, 182, 377–385.Search in Google Scholar
[2] Bhattacharjee S, Chakrabarty S, Maity S, Kar S, Thakur P, Bhattacharyya G. Water Res. 2003, 37, 3954–3966.Search in Google Scholar
[3] Azouaou N, Sadaoui Z, Djaafri A, Mokaddem H. J. Hazard. Mater. 2010, 184, 126–134.Search in Google Scholar
[4] Brown PA, Gill SA, Allen SJ. Water Res. 2000, 34, 3907–3916.Search in Google Scholar
[5] Chandra SK, Kamala CT, Chary NS, Anjaneyulu Y. Int. J. Miner. Proc. 2003, 68, 37–45.Search in Google Scholar
[6] Nassar MM, El-Geundi MS. J. Chem. Technol. Biotechnol. 1991, 50, 257–264.Search in Google Scholar
[7] Thomas JBW. Crittenden, Adsorption Technology and Design, Butterworth Heinemann: Oxford, 1998, p 14.Search in Google Scholar
[8] Zahra S, Reyhane S, Reza F. J. Nanostruct. Chem. 2013, 3, 1–8.Search in Google Scholar
[9] Dariush R. J. Nanostruct. Chem. 2013, 3, 1–6.Search in Google Scholar
[10] Moradi O, Mirza B, Norouzi M, Fakhri A. Iran.J. Environ. Health Sci. Eng. 2012, 9, 31.Search in Google Scholar
[11] Gailing H, Dong W, Shulan M, Junli C, Ling J, Peiyuan W. J. Colloid Interface Sci. 2015, 445, 294–302.Search in Google Scholar
[12] Rathinam K, Sankaran M. Chem. Eng. J. 2015, 263, 168–177.Search in Google Scholar
[13] Hashem A, Alkheraije KA. World Appl. Sci. J. 2012, 20, 138–147.Search in Google Scholar
[14] Tsai SC, Juang KW. J. Radio Ana. Nuc. Chem. 2000, 243, 741–746.Search in Google Scholar
[15] Dual G, Reinhardt RM, Reid JD. Text. Res. J. 1953, 23, 719–726.Search in Google Scholar
[16] Moradi O, Zare K, Monajjemi M, Yari M, Aghaie H. Fullerenes Nanotubes Carbon Nanostruct. 2010, 18, 285–302.Search in Google Scholar
[17] Moradi O, Zare K. Fullerenes Nanotubes Carbon Nanostruct. 2011, 19, 628–652.Search in Google Scholar
[18] Hashem A, Abdel-Lateff A, Farag S, Hussein DM. Adsorpt. Sci. Technol. 2008, 26, 661–678.Search in Google Scholar
[19] Hashem A, Abou-Okeil A, El-Shafie A, El-Sakhawy M. Polym. Plastics Technol. Eng. 2006, 45, 135–141.Search in Google Scholar
[20] Trivedi HC, Patel VM, Patelm RD. Eur. Polym. J. 1973, 9, 525–531.Search in Google Scholar
[21] Ho YS, McKeay G. Water Res. 2000, 34, 735–742.Search in Google Scholar
[22] Weber WJ, Morris JC. Proc. 1st Int. Conf. Water Pollut. Res. 1962, 2, 231–266.Search in Google Scholar
[23] Tutem E, Apak R, Unal CF. Water Res. 1998, 32, 2315–2324.Search in Google Scholar
[24] Chien SH, Clayton WR. Soil Sci. Soc. Am. J. 1980, 44, 265–268.Search in Google Scholar
[25] Ho YS, McKay G. Chem. Eng. J. 1998, 70, 115–124.Search in Google Scholar
[26] Wu FC, Tseng RL, Juang RS. Environ. Technol. 2001, 22, 205–213.Search in Google Scholar
[27] Annadurai G, Juang RS, Lee DJ. J. Hazard. Mater. 2002, 92, 263–274.Search in Google Scholar
[28] Poots VJP, McKay G, Healy J. J. Water Pollut. Control Fed. 1978, 50, 926–935.Search in Google Scholar
[29] Nagarethinam K, Mariappan MS. Dyes Pigm. 2001, 51, 25–40.Search in Google Scholar
[30] Sudesh C, Varsha G, Seema S. Clean Technol. Environ. Policy 2015, 17, 1039–1051.10.1007/s10098-014-0860-2Search in Google Scholar
[31] Langmuir I. J. Am. Chem. Soc. 1916, 38, 2221–2295.Search in Google Scholar
[32] Freundlich H. J. Phys. Chem. 1906, 57, 385–470.Search in Google Scholar
[33] Tempkin MJ, Pyzhev V. Acta Physiochim. URSS 1940, 12, 217–222.Search in Google Scholar
[34] Dubinin MM. Zhurnal FizicheskoiKhimii 1965, 39, 1305–1317.Search in Google Scholar
[35] Halsey G. J. Chem. Phys. 1948, 16, 931–937.Search in Google Scholar
[36] Redlich O, Peterson D. J. Phys. Chem. 1959, 63, 1024–1026.Search in Google Scholar
[37] Toth J. Acta Chem. Acad. Hung. 1971, 69, 311–317.Search in Google Scholar
[38] Vijayaraghavan K, Padmesh TVN, Palanivelu K, Velan M. J. Hazard. Mater. 2006, B133, 304–308.Search in Google Scholar
[39] Sips R. J. Chem. Phys. 1948, 16, 490–495.Search in Google Scholar
[40] Khan AR, Ataullah R, Al-Haddad A. J. Colloid Interface Sci. 1997, 194, 154–165.Search in Google Scholar
[41] Radke CJ, Prausnitz JM. Ind. Eng. Chem. Fund. 1972, 11, 445–451.Search in Google Scholar
[42] Foo KY, Hameed BH. Chem. Eng. J. 2010, 156, 2–10.Search in Google Scholar
[43] Baudu M. Etude des interactions solute-fibres de charbon actif. Application et regeneration, PhD Thesis, Universite de Rennes I, 1990.Search in Google Scholar
[44] Fritz W, Schlunder EU. Chem. Eng. Sci. 1974, 29, 1279–1282.Search in Google Scholar
[45] Benhimaa H, Chiban M, Sinan F, Seta P, Persin M. Colloid Surf B 2008, 61, 10–16.10.1016/j.colsurfb.2007.06.024Search in Google Scholar PubMed
[46] Lalhruaitluanga H, Jayaram K, Prasad MNV, Kumar KK. J. Hazard. Mater. 2010, 175, 311–318.Search in Google Scholar
[47] Gupta VK, Carrott PJM, Carrott MML, Suhas R. Crit. Rev. Env. Sci. Technol. 2009, 39, 783–842.Search in Google Scholar
[48] Tana G, Yuan H, Yong L, Dan X. J. Hazard. Mater. 2010, 174, 740–745.Search in Google Scholar
[49] Jayaram K, Prasad MNV. J. Hazard. Mater. 2009, 169, 991–997.Search in Google Scholar
[50] Boudrahem F, Aissani-Benissad F, Aıt-Amar H. J. Environ. Manag. 2009, 90, 3031–3039.Search in Google Scholar
[51] Gupta VK, Ali I. J. Colloid Interface Sci. 2004, 271, 321–328.Search in Google Scholar
[52] Li Q, Zhai J, Zhang W, Wang M, Zhou J. J. Hazard. Mater. 2006, B141, 163–167.Search in Google Scholar
©2015 by De Gruyter
This article is distributed under the terms of the Creative Commons Attribution Non-Commercial License, which permits unrestricted non-commercial use, distribution, and reproduction in any medium, provided the original work is properly cited.
Articles in the same Issue
- Frontmatter
- In this issue
- Original articles
- Rapid colorimetric detection of Hg2+ ion by green silver nanoparticles synthesized using Dahlia pinnata leaf extract
- Chemically modified Retama raetam biomass as a new adsorbent for Pb(II) ions from aqueous solution: non-linear regression, kinetics and thermodynamics
- Dry reforming of methane over Ni/CeO2 catalysts prepared by three different methods
- Microstructure and wear behavior of Al-Al2O3in situ composites fabricated by the reaction of V2O5 particles in pure aluminum
- Company profile
- Austrian small enterprise Microinnova GmbH receives “Process Intensification Award for Industrial Innovation 2015” from the European Federation for Chemical Engineering (EFCE)
- Conference announcement
- Conferences 2016–2017
- Book reviews
- Biohydrogen
- Green chemistry for dyes removal from waste water
- Green chemistry strategies for drug discovery