Rapid colorimetric detection of Hg2+ ion by green silver nanoparticles synthesized using Dahlia pinnata leaf extract
-
Kaushik Roy
Kaushik Roy obtained his MTech in Nanoscience and Technology from Jadavpur University, India in 2012. He is currently working as a senior research fellow in Jadavpur University. His field of interest is different applications of noble metal nanoparticles.
 ,
Chandan K. Sarkar
,
Chandan K. Sarkar
Chandan K. Sarkar received his PhD from University of Oxford, UK in 1983. He joined Jadavpur University in 1987 and is currently working as a professor in the Department of Electronics and Telecommunication Engineering, Jadavpur University.
Chandan K. Ghosh received his PhD in science from Jadavpur University. He is currently working as an assistant professor in the School of Materials Science and Nanotechnology, Jadavpur University.

Abstract
In this study, we for the first time reported green synthesis of silver nanoparticles from silver nitrate solution using leaf extract of Dahlia pinnata. Green synthesis was chosen over conventional physical or chemical synthesis procedures due to eco-friendliness, simplicity and low cost. Formation of silver nanoparticles was monitored at regular intervals using UV-Vis spectroscopy. Different phases and the crystal nature of silver nanoparticles were studied by X-ray diffraction (XRD). Transmission electron microscopy (TEM) was performed to realize the shape, size and morphology of the nanoparticles. Fourier transform infrared (FTIR) spectroscopy of the particles revealed the role of organic molecules that reduced and capped the colloidal particles in the medium during interaction. Most importantly, the rapid colorimetric sensing activity of these biosynthesized nanoparticles was explored and the green synthesized Ag nanoparticles instantly detected the presence of hazardous Hg2+ ions in water successfully.
1 Introduction
The nanoparticles of noble metals possess unique electronic and optical properties suitable for various modern applications [1, 2]. In particular, silver nanoparticles show versatile properties like biocompatibility, electrochemical activities, antimicrobial properties, low toxicity, etc. that make it a subject of great interest among research communities [3–5]. The hazardous chemicals involved in the wet chemical preparation techniques of Ag nanoparticles were found to cause severe environmental pollution [6–8]. The physical route has specific limitations as they need costly and sophisticated instruments that consume large amounts of energy [9]. The alternative method is the green synthesis route that involves microorganisms [10, 11] and plant extracts [12–14] to prepare nanoparticles from metal salts.
Green synthesis of silver nanoparticles using various plant extracts has received more attention recently over the use of microorganisms due to its low cost and easy handling methods, unlike the complicated procedure of maintaining cell cultures [15]. Silver nanoparticles were first prepared through the green route by Gardea-Torresdey et al. [16]. After that, many research groups synthesized Ag nanoparticles using leaf extract of Azadirachta indica [17], Hibiscus rosa-sinensis [18], Petroselinum crispum [19], Camellia sinensis [20], Cymbopogon sp. [21], etc. Some of the researchers even used the extracts of underground tubers of potato [22] and carrot [23] for synthesis of silver nanoparticles. However, no report was found about the use of Dahlia pinnata leaves for the same purpose. We chose the leaves of D. pinnata as they contain bioactive organic molecules that may reduce the metal ions [24] and stabilize the colloidal particles in the reacting solution.
Hg2+ is considered to be one of the most harmful metal pollutants and found in soil, water and even food materials [25]. Exposure to this heavy metal at even very low concentration (~1 μm/ml) may cause digestive disorders [26], kidney dysfunction [27] and various neurological disorders as well [28, 29]. The sensors now available for detecting Hg2+ are either based on organic compounds [30] and fluorophores [31] or functionalized nanorods [32]. However, the biosynthesized silver nanoparticles were rarely tested for their ability to detect Hg2+ ions.
Here, we followed the green approach to the synthesis of Ag nanoparticles using leaf extract of D. pinnata. The colorimetric sensing of Hg2+ ions using light brown suspension of biogenic silver nanoparticles at a wide pH range (between 3 and 8) has been investigated for the first time and the results shows that these colloidal nanoparticles can play the role of mercury detector at various physiological conditions.
2 Materials and methods
2.1 Materials
Fresh leaves of D. pinnata (Figure 1) were collected from a local nursery for preparing leaf extract. Pure silver nitrate and mercury chloride required for this work were purchased from Merck India Ltd., Mumbai, India. Other metal salts used in this experiment were also the products of Merck India Ltd.
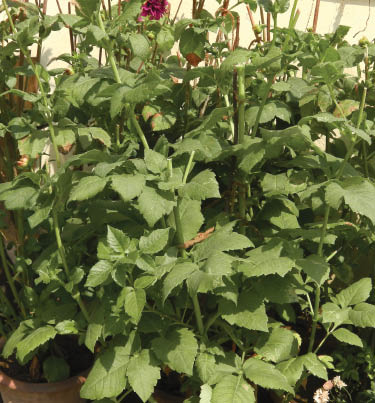
Dahlia pinnata leaves.
2.2 Methods
2.2.1 Preparation of silver nanoparticles:
To prepare the leaf extract of D. pinnata, the collected leaves (weight around 50 g) were cleaned, chopped and crushed inside a grinder. Then it was filtered and centrifuged at 2000 rpm for obtaining clear extract soup of D. pinnata leaves. A stock solution (20 mm) of AgNO3 was prepared by dissolving around 0.34 g of silver nitrate into 100 ml of deionized (DI) water. To reduce the silver ions present in the AgNO3 solution, an equal amount (i.e. 100 ml) of leaf extract was added drop wise to it and the half diluted reacting mixture (with resulting concentration of 10 mm) was kept at room temperature in darkness. After a couple of hours of incubation, the color of the mixture began to change from colorless to dark yellow (Figure 2) indicating the formation of nanosilver in the reacting mixture. When the reaction completed, the mixture was centrifuged at 10,000 rpm for 20 min to separate colloidal nanoparticles from other components of the mixture. To enhance the purity of the silver nanoparticles and remove the biomass completely, the precipitate formed at the bottom of the centrifuge tube after centrifugation was further re-dispersed in a small amount (approximately 10 ml) of DI water and centrifuged again at 5000 rpm for 10 min. After centrifugation, the soup was decanted and the pellet of colloidal particles formed at the bottom of the tube was collected carefully and dried inside a vacuum drier for 12 h to obtain dry powder of silver nanoparticles. The dry powder was later used for different characterizations and study of its hazardous metal ion sensing ability.
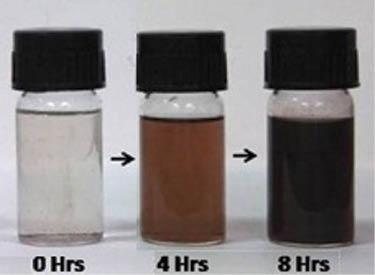
Color change of reacting mixture with incubation time.
2.2.2 Characterization of silver nanoparticles:
The formation of silver nanoparticles was monitored at regular intervals by scanning the reacting mixture under a Perkin Elmer UV-Vis spectrometer (λ-35, USA). X-ray diffraction (XRD) measurement of the nanoparticles was performed with the help of a Rigaku Ultima-III, Japan diffractometer (λ=0.154 nm). Fourier transform infrared (FTIR) spectra of the biogenic nanoparticles and the pure extract were recorded by using an IR-Prestige-21 (Shimadzu) FTIR spectroscope. To prepare the sample for transmission electron microscopy (TEM) analysis, the dry powder of colloidal particles was dispersed in a small quantity of DI water keeping the concentration at around 50 μg/ml, followed by ultrasonication (Piezo-U-Sonic Ultrasonicator: frequency >20 kHz) for 15 min. Then, a few drops of this suspension were placed on a carbon coated copper grid and dried inside a desiccator before scanning under high resolution TEM (200 kV, FEI-Tecnai). The sonicated light brown suspension of Ag nanoparticles was later used for the colorimetric sensing study.
2.3 Study of sensing activity
To evaluate the metal ion detecting ability of green synthesized silver nanoparticles, five different metal salts, i.e. Cd(NO3)2, Cr2(SO4)3, Pb(NO3)2, Zn(NO3)2 and HgCl2 with the required amount were dissolved in DI water to prepare the stock solution (1 mm) of each salt for colorimetric study. When 1 ml solution of each metal salt was added to 1 ml light brown suspension of Ag nanoparticles, a distinct color change was observed only in the case of HgCl2 where the light brown suspension turned colorless instantly. No such specific colorimetric change was noticed for the other metal ions after addition to the suspension. To determine the minimum detectable concentration of Hg2+ (for visual detection by color change), various concentrations of mercury ions were exposed to the suspension of silver nanoparticles and the UV-Vis spectra of the mixture was recorded by a Perkin Elmer UV-Vis spectroscope (λ-35, USA). Later, the biogenic silver nanoparticle based Hg2+ ion detection was performed at a wide pH range (between pH 3 and 8), taking the concentration of Hg2+ as 10 μm, i.e. the minimum detectable concentration as derived from UV-Vis spectra.
3 Results and discussion
3.1 Determination of Ag nanoparticle formation by UV-Vis spectroscopy
D. pinnata is a herbaceous plant, the leaves of which are a potent source of functional organic molecules [24]. Hence, the leaf extract of this plant is expected to reduce silver ions, if exposed. When the leaf extract of D. pinnata was added to the AgNO3 solution, the color of the mixture started to change from colorless to dark yellow after a couple of hours of incubation. The color intensified with incubation time and turned into dark brown after 8 h of observation, indicating the reduction of Ag+ ions and formation of silver nanoparticles gradually in the medium. The color change is expected to arise due to surface plasmonic resonance of Ag nanoparticles [33]. The colloidal mixture was scanned using a UV-Vis spectrometer and the peak absorbance noticed near 460 nm further confirmed the formation of silver nanoparticles. The UV-Vis spectra were obtained at regular intervals (every 2 h) to have an insight of nanoparticle formation in the reacting mixture (Figure 3). The peak value of absorbance near 460 nm was observed to be increasing with incubation time without any shifting and its variation with time is shown in Figure 3 (inset). From Figure 3 (inset), it is clear that the maximum absorbance increases linearly up to 8 h of reaction time denoting production of a greater number of Ag nanoparticles in the medium. Beyond 12 h of observation, the formation rate saturates, suggesting the completion of reaction.
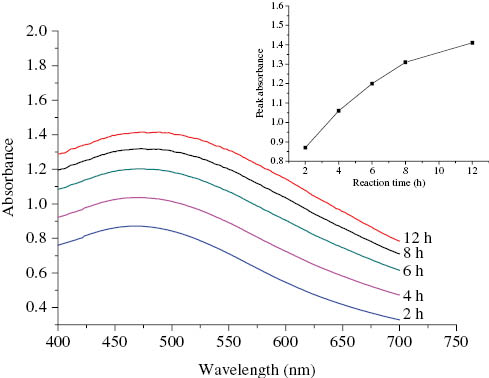
Time dependent UV-Vis spectra of silver nanoparticle formation; inset figure shows the variation of maximum absorbance with reaction time.
3.2 Structural analysis by XRD and TEM
The XRD pattern of the biogenic silver nanoparticles (Figure 4) consists of seven noticeable peaks at 2θ=27.75°, 32.15°, 38.15°, 46.25°, 54.65°, 57.25° and 76.83° which can be assigned to (220), (122), (111), (231), (331), (241) and (311) planes of face centered cubic structures of silver, respectively, (correlated to JCPDS: File No. 04-0783). In addition, absence of any other peaks in the curve also indicates the purity of the biosynthesized silver nanoparticles.
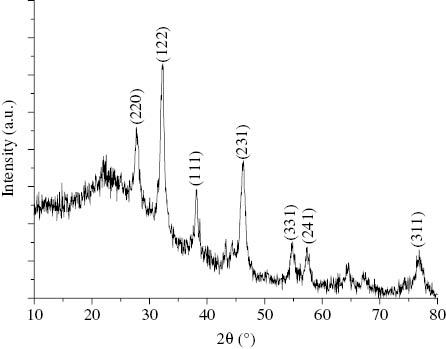
X-ray diffraction (XRD) pattern of green synthesized Ag nanoparticles.
The high resolution TEM images (Figure 5) reveal the size, shape and morphology of the biogenic Ag nanoparticles. It may be observed from the TEM images that the shape of nanoparticles is almost spherical with diameter nearly 15 nm. The interplanar spacing was manipulated from the lattice fringes (Figure 5B) to be around 0.28 nm which may correspond to the (122) planes of silver nanoparticles.

(A) and (B) transmission electron microscopy (TEM) images of biogenic silver nanoparticles.
3.3 Analysis by FTIR spectroscopy
FTIR spectra of both the extract and the biogenic Ag nanoparticles were recorded in absorbance mode to detect the functional biomolecules that contribute to the reduction and stabilization of the silver nanoparticles during interaction in the medium. The spectrum of the leaf extract of D. pinnata reveals six distinct peaks, as shown in Figure 6. Two bands noticed at 1064 cm-1 and 3265 cm-1 can be assigned to the C-N bond present in amines and O-H stretching of aromatic compounds (like phenol, etc.), respectively [34]. A band observed at 2916 cm-1 may be attributed to the C-H stretching of aldehydes, whereas the band at 1423 cm-1 possibly indicates C-H bending of alkanes [12, 35].The remaining two bands at 673 cm-1 and 1595 cm-1 may correspond to the stretching vibration of halo-alkanes and bending of C-H bonds present in hydrocarbons, respectively [36]. The spectrum of biogenic silver nanoparticles appears to be broadened and most of the intense peaks disappeared, indicating a high level of purity of the samples. It is clear from this analysis that the aromatic compounds (like phenol, etc.) along with other hydrocarbons present in the leaf extract of D. pinnata probably reduced the silver ions and stabilized the colloidal particles during interaction in the reacting medium.
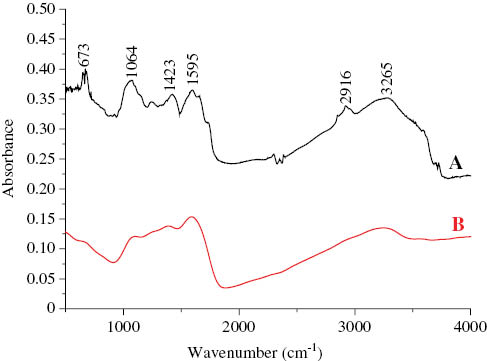
Fourier transform infrared (FTIR) spectra of (A) leaf extract of Dahlia pinnata and (B) biogenic silver nanoparticles.
3.4 Hg2+ sensing activity of Ag nanoparticles
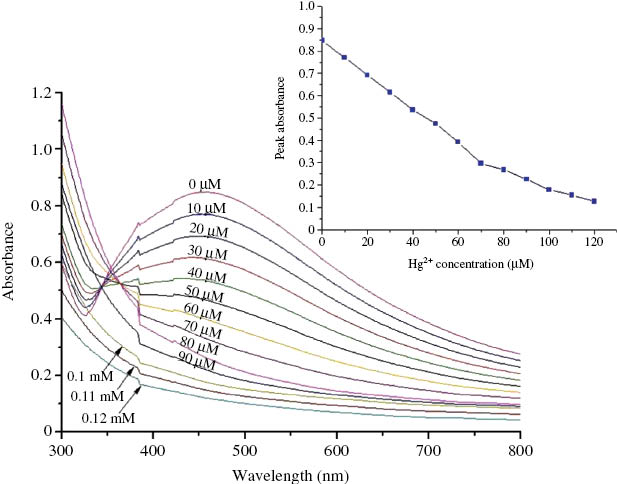
The suspension of green silver nanoparticles was evaluated here as a colorimetric sensor for different metallic ions by adding equal concentrations (1 ml, 1 mm) of the solutions of metal salts into a suspension of green synthesized Ag nanoparticles that showed decolorizing after addition of Hg2+ selectively (Figure 7 [inset]). Addition of other metal ions (Cd2+, Cr3+, Zn2+ and Pb2+) into the suspension displayed no specific color changes except broadening and a small shift of the absorbance peaks as shown in Figure 7. Prominently, the addition of Hg2+ ion into the suspension of nanosilver instantly turned it colorless from light brown and thus established the selective colorimetric detection of Hg2+ [37]. The minimum detectable concentration of Hg2+ ions for visual detection was determined by adding different Hg2+ concentrations into the suspension of Ag nanoparticles and following the change of absorbance in the UV-Vis spectra of the solution. From Figure 8, it is clear that the minimum concentration of HgCl2 (10 μm) added to the suspension slightly reduced the intensity of absorption. The absorbance peak decreased gradually with increasing concentration of Hg2+ and finally disappeared (almost at 100 μm). The variation of peak absorbance with Hg2+ concentration is shown in Figure 8 (inset). The mechanism of Hg2+ detection by suspension of Ag nanoparticles can be explained by the electrochemical differences between these two metal ions: Hg2+ and Ag+. The reduction potential of Ag+ is +0.80 V (Ag++e=Ag) whereas the standard reduction potential for Hg2+ is +0.92 V (2Hg2++2e=Hg22+) [38]. According to the electrochemical series, the higher reduction potential of the metals signifies better oxidizing abilities [39]. Hence, Hg2+ can oxidize the colloidal silver during interaction and form Ag+ ions, resulting in the decolorization of the solution [40].

UV-Vis spectra of Ag nanoparticle suspension with different metal ions; inset figure shows the selective colorimetric sensing of Hg2+ ion in aqueous solution.
Change of absorbance with Hg2+ concentration; inset figure shows the variation of peak absorbance with Hg2+ concentration.
To sense the presence of Hg2+ in water at various physiological conditions, we performed the colorimetric detection of Hg2+ (taking minimum detectable concentration) by suspension of nanosilver in a wide pH range (pH=3–8) [41]. The pH of the solution was controlled by addition of required amount of diluted NaOH to the reacting solution and the UV-Vis spectra of the solution were recorded for different pH values. However, no significant change was observed in the efficacy of the suspension of Ag nanoparticles for detecting Hg2+ ions throughout the whole range of pH. Therefore, these stable biogenic silver nanoparticles can be used successfully for detection of hazardous Hg2+ ions in water and further protect the environment from hazardous mercury pollution [38, 42].
4 Conclusion
In recent times, the green synthesis procedure has been followed extensively for preparing metallic nanoparticles because it is a simple, low cost and eco-friendly alternative that can also be performed at room temperature. In this study, we prepared silver nanoparticles from a silver nitrate solution using the leaf extract of D. pinnata. The functional biomolecules possibly reduced the silver ions and stabilized the particles in the mixture. The prepared nanoparticles were found to be nearly spherical in shape with an average diameter of around 15 nm. Most importantly, the biosynthesized Ag nanoparticles showed the ability to selectively sense hazardous Hg2+ ions in a wide range of pH. Therefore, these nanoparticles can be employed to detect the hazardous Hg2+ ion in water and further save the environment from mercury pollution.
About the authors

Kaushik Roy obtained his MTech in Nanoscience and Technology from Jadavpur University, India in 2012. He is currently working as a senior research fellow in Jadavpur University. His field of interest is different applications of noble metal nanoparticles.

Chandan K. Sarkar received his PhD from University of Oxford, UK in 1983. He joined Jadavpur University in 1987 and is currently working as a professor in the Department of Electronics and Telecommunication Engineering, Jadavpur University.

Chandan K. Ghosh received his PhD in science from Jadavpur University. He is currently working as an assistant professor in the School of Materials Science and Nanotechnology, Jadavpur University.
Acknowledgments
Financial support (senior research fellowship) from the Council of Scientific and Industrial Research, India is acknowledged with gratitude by Kaushik Roy.
References
[1] El-Nour KMMA, Eftaiha A, Al-Warthan A, Ammar RAA. Arabian J. Chem. 2010, 3, 135–140.Search in Google Scholar
[2] Satyavathi R, Krishna MB, Rao SV, Saritha R, Rao DN. Adv. Sci. Lett. 2010, 3, 138–143.Search in Google Scholar
[3] Luo X, Morrin A, Killard AJ, Smyth MR. Electroanalysis 2006, 18, 319–326.10.1002/elan.200503415Search in Google Scholar
[4] Roy K, Sarkar CK, Ghosh CK. Dig. J. Nanomater. Bios. 2015, 10, 107–115.Search in Google Scholar
[5] Lee J, Kuang D, Feng Y, Zhang F, Xu Z, Liu M, Wang D. Biosens. Bioelectron. 2013, 42, 198–206.Search in Google Scholar
[6] Guzman MG, Dille J, Godet S. Int. J. Chem. Biomol. Eng. 2009, 2, 104–111.Search in Google Scholar
[7] Dong PV, Ha CH, Binh LT, Kasbohm J. Int. Nano Lett. 2012, 2, 1–9.Search in Google Scholar
[8] Wiley B, Herricks T, Sun Y, Xia Y. Nano Lett. 2004, 4, 1733–1739.Search in Google Scholar
[9] Zhu J, Liu S, Palchik O, Koltypin Y, Gedanken A. Langmuir 2000, 16, 6396–6399.10.1021/la991507uSearch in Google Scholar
[10] Shelar GB, Chavan AM. Int. J. Biomed. Adv. Res. 2014, 5, 348–351.Search in Google Scholar
[11] Sudha SS, Rajamanickam K, Rengaramanujam J. Indian J. Exp. Biol. 2013, 52, 393–399.Search in Google Scholar
[12] Roy K, Sarkar CK, Ghosh CK. Dig. J. Nanomater. Bios. 2014, 9, 1137–1147.Search in Google Scholar
[13] Mason C, Vivekanandhan S, Misra M, Mohanty A. World J. Nano Sci. Eng. 2012, 2, 47–52.Search in Google Scholar
[14] Bankar A, Joshi B, Kumar AR, Zinjarde S. Colloids Surf., A 2010, 368, 58–63.10.1016/j.colsurfa.2010.07.024Search in Google Scholar
[15] Vanaja M, Annadurai G. Appl. Nanosci. 2013, 3, 217–223.Search in Google Scholar
[16] Gardea-Torresdey JL, Gomez E, Peralta-Videa J, Parsons JG, Troiani H, Jose-Yacaman M. Langmuir 2003, 19, 1357–1361.10.1021/la020835iSearch in Google Scholar
[17] Namratha N, Vasan MP. Asian J. Pharm. Tech. 2013, 3, 170–174.Search in Google Scholar
[18] Philip D. Physica E 2010, 42, 1417–1424.10.1016/j.physe.2009.11.081Search in Google Scholar
[19] Roy K, Sarkar CK, Ghosh CK. Appl. Nanosci. 2015, 5, 945–951.Search in Google Scholar
[20] Loo YY, Chieng BW, Nishibuchi M, Radu S. Int. J. Nanomed. 2012, 7, 4263–4267.Search in Google Scholar
[21] Masurkar SA, Chaudhari PR, Shidore VB, Kamble SP. Nano-Micro Lett. 2011, 3, 189–194.Search in Google Scholar
[22] Roy K, Sarkar CK, Ghosh CK. Spectrochim. Acta, Part A 2015, 146, 286–291.10.1016/j.saa.2015.02.058Search in Google Scholar PubMed
[23] Abubakar AS, Salisu IB, Chahal S, Sahni G, Pudake RN. Int. J. Curr. Res. Rev. 2014, 6, 5–8.Search in Google Scholar
[24] Eid S, Saar DE, Druffel KL, Pappu HR. Plant Pathol. 2011, 60, 378–383.Search in Google Scholar
[25] Cristol DA, Brasso RL, Condon AM, Fovargue RE, Friedman SL, Hallinger KK, Monroe AP, White AE. Science 2008, 320, 335–335.10.1126/science.1154082Search in Google Scholar PubMed
[26] White JF. Exp. Biol. Med. 2003, 228, 639–649.Search in Google Scholar
[27] Zhou Y, Vaidya VS, Brown RP, Zhang J, Rosenzweig BA, Thompson KL, Miller TJ, Bonventre JV, Goering PL. Toxicol. Sci. 2008, 101, 159–170.Search in Google Scholar
[28] Harada M. Crit. Rev. Toxicol. 1995, 25, 1–24.Search in Google Scholar
[29] Tchounwou PB, Ayensu WK, Ninashvili N, Sutton D. Environ. Toxicol. 2003, 18, 149–175.Search in Google Scholar
[30] Xue X, Wang F, Liu X. J. Am. Chem. Soc. 2008, 130, 3244–3245.Search in Google Scholar
[31] Métivier R, Leray I, Valeur B. Chemistry 2004, 10, 4480–4490.10.1002/chem.200400259Search in Google Scholar PubMed
[32] Lee JS, Han MS, Mirkin CA. Angew. Chem., Int. Ed. 2007, 46, 4093–4096.Search in Google Scholar
[33] Kadkhodazadeh S, de Lasson JR, Beleggia M, Kneipp H, Wagner JB, Kneipp K. J. Phys. Chem. C 2014, 118, 5478–5485.10.1021/jp500288sSearch in Google Scholar
[34] Annamalai A, Christina VLP, Sudha D, Kalpana M, Lakshmi PTV. Colloids Surf. B 2013, 108, 60–65.10.1016/j.colsurfb.2013.02.012Search in Google Scholar PubMed
[35] Smith BC. Infrared Spectral Interpretation: A Systematic Approach, CRC Press: Florida, USA, 1999, ISBN: 0-8493-2463-7.Search in Google Scholar
[36] Koudelakova T, Bidmanova S, Dvorak P, Pavelka A, Chaloupkova R, Prokop Z, Damborsky J. Biotechnol. J. 2013, 8, 32–45.Search in Google Scholar
[37] Lin C, Yu C, Lin Y, Tseng W. Anal. Chem. 2010, 82, 6830–6837.Search in Google Scholar
[38] Ravi SS, Christena LR, SaiSubrabanian N, Anthony SP. Analyst 2013, 138, 4370–4377.10.1039/c3an00320eSearch in Google Scholar PubMed
[39] Zhang J, Li CM. Chem. Soc. Rev. 2012, 41, 7016–7031.Search in Google Scholar
[40] Deng L, Ouyang X, Jin J, Ma C, Jiang Y, Zheng J, Li J, Li Y, Tan W, Yang R. Anal. Chem. 2013, 85, 8594–8600.Search in Google Scholar
[41] Wang C, Lin Z, Roy P, Chang H. Front. Chem. 2013, 1, 1–5.Search in Google Scholar
[42] Liu J, Xu X, Yu S, Cheng H, Hong Y, Feng X. Environ. Res. 2014, 131, 160–164.Search in Google Scholar
©2015 by De Gruyter
Articles in the same Issue
- Frontmatter
- In this issue
- Original articles
- Rapid colorimetric detection of Hg2+ ion by green silver nanoparticles synthesized using Dahlia pinnata leaf extract
- Chemically modified Retama raetam biomass as a new adsorbent for Pb(II) ions from aqueous solution: non-linear regression, kinetics and thermodynamics
- Dry reforming of methane over Ni/CeO2 catalysts prepared by three different methods
- Microstructure and wear behavior of Al-Al2O3in situ composites fabricated by the reaction of V2O5 particles in pure aluminum
- Company profile
- Austrian small enterprise Microinnova GmbH receives “Process Intensification Award for Industrial Innovation 2015” from the European Federation for Chemical Engineering (EFCE)
- Conference announcement
- Conferences 2016–2017
- Book reviews
- Biohydrogen
- Green chemistry for dyes removal from waste water
- Green chemistry strategies for drug discovery