Development of a continuous emulsification process for a highly viscous dispersed phase using microstructured devices
-
Yongli Li
Yongli Li received his Bachelor degree from Tongji University, Master degree from Polytech’ Savoie and PhD degree from University of Caen (joint research with University of Rouen). Afterwards, he worked as Marie Curie Research Fellow at University of Limerick. In November 2012 he joined the Thermal Process Engineering Group, Institute for Micro Process Engineering, Karlsruhe Institute of Technology (KIT) as Research Scientist. His current research is on continuous emulsification and high pressure homogenization using microstructured devices.
 ,
Iris Gerken
,
Iris Gerken
Iris Gerken received her Diploma in Chemical Engineering in 2012 from Technical University of Dresden. She now works on efficient and improved heat transfer in micro structures as her PhD project at Institute for Micro Process Engineering, Karlsruhe Institute of Technology (KIT).
Andreas Hensel received his Diploma in Chemical Engineering at University of Karlsruhe (Germany). Since 2001 he has been working with the group “Liquid and Dispersed Systems”, Institute of Micro Process Engineering, Karlsruhe Institute of Technology (KIT). His research fields are liquid-liquid mixing, emulsification and homogenization with microstructured systems, especially for industrial applications.
Manfred Kraut studied chemistry at the University of Karlsruhe. Then he worked at University of Stuttgart (Germany) in the field of adsorption on zeolites. In 1999 he started to work on micro reaction technology in Karlsruhe. He is now heading the group “Liquid and Disperse Systems” at the Institute for Micro Process Engineering of KIT. His interests lie in fast exothermic liquid phase reactions, mixing and the industrial application of micro process engineering.
Juergen J. Brandner is currently head of the Thermal Processes Department/Heat Exchange Group of the Institute for Micro Process Engineering of Karlsruhe Institute of Technology (KIT), (Germany). He is also a lecturer for Micro Process Engineering at Dresden Technical University (Germany). Heis author or co-author of about two hundred and eighty technical papers and seven technical books. After studies in chemistry he obtained a Diploma in Electrical Engineering and an Engineering Doctorate in Mechanical Engineering, both from KIT, as well as a habilitation degree from Dresden Technical University.

Abstract
A highly viscous oil was used to create oil-in-water emulsions. Rheological properties of the dispersed phase, the emulsifier, and their combination were measured to study the flow behavior. The temperature dependence of the viscosity and the influence of different mixing orders on emulsion quality were examined. Furthermore, the stability of the produced emulsions was studied. Finally, the initial emulsification process was analyzed and optimizations were suggested.
1 Introduction
An emulsion is a mixture of two or more insoluble liquids, typically water and oil. The dispersed phase forms droplets which are surrounded by the continuous phase. Thus, emulsions can be divided into oil-in-water and water-in-oil types. The properties of emulsions mainly depend on the droplet size distribution and the property of emulsifiers as well as the viscosities of the dispersed phase and the continuous phase [1].
The aim of the present work is to develop a continuous emulsification process with minimal energy consumption. A commercial product was used as a reference case. This oil-in-water emulsion was manufactured using a batch process. In many cases, emulsification aims to produce droplets as fine as needed for physical stability to avoid sedimentation [1]. Generally, emulsions with droplet sizes from 0.1 to 1 µm are called mini or submicron emulsions and up to tens of µm they are called macro emulsions [2]. The investigated emulsions in the present work are macro emulsions. Droplet size distribution is one of the major parameters for evaluating the quality of emulsions. At first, the commercially available emulsion was analyzed with respect to this property and the results were used to compare with the properties of the emulsions from the new processes. Another particular property of this emulsification process is, that the dispersed phase has a high viscosity, which may induce problems for the use of microchannel devices.
For emulsification, different techniques exist, e.g., the use of rotor-stator-systems, high pressure homogenizers and membrane or microchannel systems [2]. Each method has its area of application. The membrane technique can result in narrow droplet size distributions. High pressure homogenizers are frequently used to achieve small droplet sizes, and can work for either low or high viscosity dispersed phases [3], to give a few examples. In this work, microstructured mixers (µMixer) were chosen for emulsification in this work and the preliminary process design is presented.
2 Study of rheological properties
The dispersed phase used in the experiments has a density of 1100 kg/m3. It is called Oil in the context instead of using its chemical name. In emulsification and homogenization processes, the viscosity of the fluids has an influence on the critical Weber number in laminar shear flow [2], elongational flow [2], turbulent flow [4] or cavitational flow [5], which determines the formation of new interfacial areas and droplet disruption. In this study, Oil is a highly viscous fluid, thus the rheological properties will be discussed first.
The rheological experiments were carried out with a rheometer, Rheostress 1 from Thermo Haake. A cone-plate system was used and the titanium cone had a diameter of 60 mm with an angle of 1°.
2.1 Flow properties
The viscosity dependence on shear rate was examined first. The temperature was set to 25°C and 95°C, respectively, and the shear rate range was set to cover the range of 0–1000 s-1. The moment of torque of the rheometer was limited to 100 mNm. Due to the high viscosity of Oil at 25°C, the required shear stress for obtaining high shear rates could not be reached. Thus, only the shear rate range of 0–30 s-1was achieved, however, the full studied range was reached for the measurement at 95°C. The purchased batch-fabricated emulsion and the emulsifier were still studied at 25°C.
The results are shown in Figure 1A. The viscosity of Oil at 95°C remained constant for the whole shear rate range of 0–1000 s-1, the deviation is <1%, and only a small viscosity drop at low shear rates close to 0 (Figure 1B) can be seen, which shows Newtonian flow behavior under the measurement conditions. The emulsifier exhibits similar behavior at 25°C. There are evident viscosity changes at low shear rates in the curves of the emulsions. To substantiate these results, tests on different emulsion samples were carried out and two of them are presented in Figure 1A and B. It should be noted that the flow curves of the two measurements overlapped exactly. As the dispersed phase droplets may be deformed at high shear rates, the experiments were limited to a shear rate of 320 s-1.

(A) Flow curves of Oil, emulsifier and emulsions (orange legends for shear stress and black legends for viscosity). (B) Flow curves magnification of Figure 1A (orange legends for shear stress and black legends for viscosity).
It was found that at low shear rates, there were no evident viscosity changes for Oil and the emulsifier, but indeed a small viscosity decrease of the emulsion was observed, which indicates that the emulsion may show Bingham flow behavior. In this study, the curves shear stress versus shear rate of the emulsion do not follow Bingham’s linear function at low shear rates. De Larrard et al. [6] developed a modified Bingham model, which can fit well with our experimental data. The yield stress  and the equivalent plastic viscosity
  can be determined by [6]:
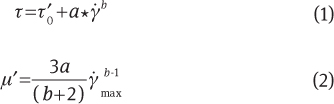
where a and b are constants, τ is shear stress,  is shear rate, and
  is the maximal shear rate of the studied range. The fitted parameters are presented in Table 1. It is found the emulsion has a yield stress of 0.66 Pa and an equivalent plastic viscosity of 0.070 Pa·s. The slight viscosity changes observed at low shear rates were probably caused by the deformation of the droplets. The viscosity of the emulsions became almost constant as the shear rate surpassed 30 s-1. In conclusion, the emulsion shows Newtonian behavior with a low yield stress (Bingham behavior); Oil and the emulsifier are Newtonian fluids without yield stresses.
Determination of the yield stresses and the plastic viscosities.
| Fluids | a | b |  |  |  | R2 |
|---|---|---|---|---|---|---|
| Emulsion at 25°C-1 | 0.04884 | 1.065 | 321.3 | 0.63 | 0.070 | 1 |
| Emulsion at 25°C-2 | 0.04354 | 1.087 | 320.0 | 0.69 | 0.070 | 1 |
| Average | – | – | – | 0.66 | 0.070 | – |
2.2 Temperature dependence of viscosity
The viscosity of Oil is about 123 Pa·s at 20°C at a shear rate of 10 s-1. Besides its influence on the flow regimes in the emulsification process, the high viscosity will also lead to high pressure losses in microstructured devices. Thus, it is necessary to find a way to reduce the viscosity efficiently. Two options were tested, increasing the temperature of Oil before mixing it with water, or mixing Oil with the emulsifier first. In the latter case, the emulsifier is expected to reduce the viscosity of Oil.
The viscosities of Oil and Oil-emulsifier mixture were studied over the temperature range of 17–98°C at a shear rate of 10 s-1 as shown in Figure 2 where the logarithm scale was applied for the Y-coordinate due to the big viscosity difference between the studied fluids. The viscosity of Oil decreases dramatically with the temperature increase. For example, the viscosity at 95°C is <0.3% of that at 17°C. The addition of the emulsifier also has an evident effect on viscosity reduction, especially at low temperatures. The viscosity of Oil-emulsifier mixture at 25°C is 55% lower than that of Oil.

Viscosities of Oil, Oil-emulsifier mixture and emulsion as a function of temperature (at 10 s-1).
The gap between the C60/1° cone and the plate is 52 µm in height at room temperature and gradually becomes smaller during temperature increase. The studied materials will expand due to temperature increase, so parts of the materials can be pushed out of the gap. Thus, the measured shear stress will be overestimated. As a result, the measured viscosity is higher than the real values. In this case, the viscosity was measured in temperature steps of 20°C. That is the reason for the discontinuity shown in the plots. The slight viscosity difference between two adjacent measurements at the same temperature was also due to the volume changes mentioned above. The viscosities of the emulsions were also studied in the temperature range of 25–45°C and they are closer to the viscosities of the continuous phase than that of the dispersed phase.
3 Designs of emulsification process
3.1 Analysis of emulsions
In this section, a few emulsification experiments were performed in a batch using different mixing orders of the components. The correspondent droplet size distributions of the emulsions were analyzed and compared with the purchased emulsion, which will contribute to the process design. The stability of the emulsions over time was studied, too.
The mass ratio of water to Oil was set to be about 1. The emulsifier content in the emulsions is about 2% in mass. The relatively small quantity of the emulsifier compared to the continuous phase or the dispersed phase indicates the difficulty of its mixing with water or Oil using a µMixer in a continuous process with the precise composition. It would be easier to dissolve the emulsifier in water or Oil in a batch container first, and then mix with Oil or water to create the emulsions in a µMixer. In both cases, only a single µMixer will be needed for the process.
Droplet size distribution is one of the most important parameters for the emulsion quality evaluation. It is related to the emulsions’ stability, viscosity, etc. The droplet size distribution was measured by static light scattering using a Beckman Coulter LS 230.
A commercially available product was used as reference (Process Ref). Different mixing arrangements referring to the components were tested to obtain emulsions: first dissolving the emulsifier in water, then mixing with Oil (Process 1); first dissolving the emulsifier in Oil, then mixing with water (Process 2). To test the solubility of Oil in water, the water was mixed with Oil directly. Then the emulsifier was added, and emulsions were generated after stirring (Process 3). Furthermore, to test the stability of the purchased emulsion, one sample was analysed after it was stored for about three weeks at room temperature [Process Ref (aged emulsion)].
For all the studied processes, Oil was preheated to 80°C before mixing with other components. For example, in Process 2, due to the large viscosity difference between Oil and the emulsifier, Oil was preheated to 80°C so that Oil had a similar viscosity to the emulsifier to facilitate the dissolution. In this study, only batch emulsifications were carried out under magnetic agitation. The results are presented in Figure 3 within reasonable uncertainties (<4%).

Characteristic droplet sizes of emulsions.
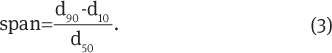
The volume weighted particle sizes d10, d50, d90 and the Sauter diameter d(3,2) are often used to characterize droplet size distributions of emulsions. The results of the emulsions produced in this work are presented in Figure 3. Practically, d(3,2) is related to the energy density input to the system during emulsification [7] and can be used to compare different emulsification processes. The span is used to indicate the width of the droplet size distributions. It is defined by equation (3):
Emulsions produced by Process 1 with 50% Oil content had been tested before. In these investigations it was found that Process 1 could generate a similar droplet size distribution as it was seen in the purchased emulsion. Here the experiments were repeated, but with slowly increasing the Oil content in the emulsion (about 60%) to test the possibility of high-content dispersed phase by this emulsification process. The results show that the emulsion produced exhibits lowest d(3,2), d10, and d50, which may be a result of the high energy input into the system due to longer stirring time. The relatively high d90 was achieved due to the high content of dispersed phase. Processes 2 and 3 show similar droplet size distributions to Process Ref.
The span of the studied processes are given in Table 2. All the processes except Process 1 show similar span compared to Process Ref, which means the width of the droplet size distribution fits the requirements well. Process 1 shows a very high span due to the high content of dispersed phase in the emulsion.
Span of the droplet sizes of emulsions produced with the different processes described.
| Process | Process Ref | Process Ref (aged emulsion) | Process 1 | Process 2 | Process 3 |
|---|---|---|---|---|---|
| Span | 1.23 | 1.36 | 4.29 | 1.45 | 1.26 |
Finally, the stability of emulsions was studied. It is found that d10, d50, d90, and d(3,2) all increased after three weeks of storage at room temperature (aged emulsion), which shows the stability of the emulsions cannot be guaranteed over a long time period at room temperature. This was due to the sedimentation effect and the coalescence of droplets. To reduce these effects, the product needs to be stored at lower temperatures (e.g., 5°C) or has to be used directly after production.
3.2 Design of the process
In previous work [8, 9], the possibility of using µMixers for emulsification was shown. Here, a special µMixer will be designed according to the ratio of the dispersed phase to the continuous phase, the correspondent pressure losses, etc. The results given in Section 3.1 showed that all the three batch processes (mixing Oil-emulsifier mixture with water, mixing water-emulsifier mixture with Oil, or mixing Oil-water mixture with emulsifier) could produce emulsions and there is no major difference in terms of the emulsion qualities between those three processes. In the last case, the residence time needs to be long enough to cover the interfaces. In a continuous emulsification process, the residence time in µMixers is usually very short and the emulsification may not be ensured. Thus, only the two other possibilities will be discussed as follows. A preliminary flow diagram is developed and shown in Figure 4.

Preliminary designed flow diagram for continuous emulsification.
In Figure 4, the emulsification takes place in the µMixer. From the discussion on viscosity given above, Oil should be heated before the mixing device. A microstructured heat exchanger (µHX) is preferred for its high efficiency in heat transfer. Pump 1 will be a special pump designed for handling highly viscous fluids. Depending on the pressure drop after the µHX, an additional pump (Pump 3) may be needed for the emulsification process. So far, a specially designed µHX for highly viscous fluids has not been described in literature. The development of an efficient µHX will be one of the major tasks in the development process.
The premixing of the emulsifier in water or in Oil is discussible. Dissolving the emulsifier in water is much easier, this premixing does not require much energy input and can be carried out in water containers with low or no agitation, i.e., there is no process step for obtaining the pre-mixture. If the emulsifier is dissolved in Oil, the pressure drop in the µHX can be reduced due to the effect of viscosity reduction by adding the emulsifier. In this case, most likely no additional pump (Pump 3) is needed. The disadvantage of this procedure is the difficulty of preparing the Oil-emulsifier mixture due to the high viscosity of Oil.
After emulsification, the temperature of the emulsion will be about 45°C. Therefore, at a later stage of this project, this portion of heat is planned to be recuperated? for preheating Oil by using the process shown in Figure 5. The blockage due to viscosity increase can only take place in the heating fluid passage (the emulsion, with the temperature decrease) and not in the heated fluid passage (Oil, with the temperature increase). The temperature of the emulsion will be lowered down from 45°C. Figure 2 shows that its viscosity is 0.106 Pa·s at 45°C and 0.128 Pa·s at 25°C. This moderate viscosity increase reduces the possibility of temperature change induced blockage in the heating fluid passage.

Flow diagram for continuous emulsification process using microstructured devices and energy recuperation.
In the suggested process, the thermal energy consumption is optimized. However, the more microstructured devices are incorporated, the more pressure losses are introduced. Thus, one or two additional pumps will be needed. The energy dissipation due to flow through microstructured devices may become important.
4 Energy balance in the µHX
In this section, the energy balances in the µHX of the two processes presented in Figure 4, water-emulsifier flow process and Oil-emulsifier flow process will be studied theoretically. As the viscosity of Oil (or Oil-emulsifier mixture) is reduced significantly with temperature variation, high heat transfer rates are desired close to the entrance of the Oil (or Oil-emulsifier mixture) passage of the µHX. Compared to cross flow and counter current flow µHX, co-current flow µHX can yield the highest temperature increases at the entrance, provided that the water used for heating in the three cases has the same heat capacitance rate and the same temperature at the entrance of the water passage. Here, the pre-calculation on co-current flow heat exchanger will be carried out to estimate the thermal transfer and pressure drop distribution along the microchannels of the µHX.
In this study, Oil shows a dramatic viscosity drop with increasing temperature. It is possible that the fluid in the Oil passage shows low viscosity near the inner channel surface due to high temperatures, however, the main part of the fluid in the center of the channel may go through rapidly without being heated sufficiently. Thus, the dimensions of the channels should be appropriately designed. In this calculation, 10 foils were taken for each passage and each foil had 100 microchannels. A single microchannel had a cross sectional area of 0.2×0.2 mm² and a length of 4 cm. To simplify the calculation, it was assumed that there were no temperature gradients inside each cross-section of the passages and the length of the flow distribution area was neglected. A hot water flow with an inlet temperature of 95°C was chosen to heat the Oil. The mass flow rate of Oil was set to 15 kg/h with an inlet temperature of 20°C. Along the flow direction, each channel was divided into 400 cells of equal length. Calculation on each section was carried out subsequently. The Oil was supposed to be heated to 80°C, and based on the selected heat exchanger geometry, the required water flow rate was found to be 30 kg/h.
The heat capacity of Oil (Cp) was measured by using a SETARAM Micro DSC-II calorimeter under air atmosphere. The scanning range was 20°C–90°C and the scanning rate was 0.1 K·min-1. The results are shown in Figure 6. Cp of Oil increases slightly with temperature and has an average of 1.94 kJ·kg-1·K-1, which is nearly half that of water. Oil will be heated to 80°C using a µHX, so the temperature distribution inside the µHX will cover the temperature range from room temperature to 80°C. Cp values (Figure 6) and the viscosities (Figure 2) were fitted by polynomial curves and used for calculations. The calculated pressure losses and the transferred thermal power along the channel length are presented in Figures 7 and 8, respectively.

Heat capacity of Oil.

Pressure loss of Oil (Oil-emulsifier mixture) flow in an ideal co-current flow µHX (only the pressure drop along the first 5 mm of the channel length is shown).

Transfer of thermal power in an ideal co-current flow µHX (only the transferred thermal power along the first 5 mm of the channel length is shown).
Figure 7 shows the differential and integrated pressure loss along the channel length. Due to the dramatic viscosity variation with temperature, the pressure loss close to the entrance part of the µHX is more significant than that of the rest of the channel length. At the same time, the emulsifier may provide an important contribution to reducing the pressure loss, especially near the entrance. Figure 8 shows that Oil flow or Oil-emulsifier mixture flow has no evident difference with regard to heat transfer. This is because the low content of emulsifier in the mixture does not change the heat capacity much. Figure 7 proves that most of the pressure loss occurs within the first 1.5 mm from the entrance of the µHX, and Figure 8 indicates that the heat transfer principally occurs within the first 4 mm from the entrance, which shows the µHX can be optimized by shortening the channel’s length. For the co-current flow µHX [10] previously developed in our institute, a short channel length can make it show similar behavior as the cross flow µHX due to the entrance distribution area [11]. The calculation above was based on the assumptions that there were no temperature gradients inside each channel section and no flow distribution area. In reality, it takes a certain time for the heat transfer from channel surface to the center of the fluid and the length of heat transfer area will be longer than the calculated value. So, the co-current flow µHX will still show advantages in this application, provided that the co-current flow µHX of future designs can reduce significantly the flow distribution length.
Basically, Figure 7 presents the pressure loss in the passages which is directly related to the pumping energy. Figure 8 presents the heat transfer which is directly related to the heating energy. They are the two main energy consumptions in the µHX system. The power balances for the two processes were calculated and presented in Table 3. The energy efficiency of the pump was assumed to be 85%. The required pumping power is much smaller than the required thermal power (<5%) for the µHX.
Power consumption in the µHX for the two processes.
| Fluids | Total thermal power (W) | Total pumping power (W) |
|---|---|---|
| Oil | 488 | 23 |
| Oil-emulsifier mixture | 488 | 16 |
The Oil-emulsifier mixture flow can reduce the pressure loss in the µHX compared to the Oil flow, but its influence on the total energy requirement in the µHX is negligible. The subsequent unit operation is emulsification. This process causes a very high pressure loss compared to the µHX. Losing more pressure in the µHX requires the installation of an additional pump for the high pressure emulsification. Thus, the investment on pumps may increase the total costs. But the premixing of Oil and emulsifier will need extra mechanical energy input. For the water-emulsifier flow process, the pumping energy is high, but the operation is relatively convenient for industrial production. In conclusion, each process has its advantage and both processes will be developed and compared experimentally.
5 Conclusions
Within the present study, a continuous emulsification process based on microstructured devices was developed schematically and evaluated. The dispersed phase and the emulsifier are Newtonian fluids and the emulsion was proved to show Bingham behavior; these properties will facilitate the simulation work. Increasing temperature and adding emulsifier can both reduce the viscosity of Oil, which shows solutions to reduce the pressure loss in the emulsification process. The droplet size distribution study of emulsions from different arrangements of mixing shows that orders of mixing do not have much influence on creating the desired product quality. The emulsion needs to be stored at low temperature to ensure its physical stability over a long time or it has to be used directly. The energy consumption in the µHX was also evaluated. In the end, an emulsification process with energy recuperation was presented and will be tested at a later stage of this project.
About the authors

Yongli Li received his Bachelor degree from Tongji University, Master degree from Polytech’ Savoie and PhD degree from University of Caen (joint research with University of Rouen). Afterwards, he worked as Marie Curie Research Fellow at University of Limerick. In November 2012 he joined the Thermal Process Engineering Group, Institute for Micro Process Engineering, Karlsruhe Institute of Technology (KIT) as Research Scientist. His current research is on continuous emulsification and high pressure homogenization using microstructured devices.

Iris Gerken received her Diploma in Chemical Engineering in 2012 from Technical University of Dresden. She now works on efficient and improved heat transfer in micro structures as her PhD project at Institute for Micro Process Engineering, Karlsruhe Institute of Technology (KIT).

Andreas Hensel received his Diploma in Chemical Engineering at University of Karlsruhe (Germany). Since 2001 he has been working with the group “Liquid and Dispersed Systems”, Institute of Micro Process Engineering, Karlsruhe Institute of Technology (KIT). His research fields are liquid-liquid mixing, emulsification and homogenization with microstructured systems, especially for industrial applications.

Manfred Kraut studied chemistry at the University of Karlsruhe. Then he worked at University of Stuttgart (Germany) in the field of adsorption on zeolites. In 1999 he started to work on micro reaction technology in Karlsruhe. He is now heading the group “Liquid and Disperse Systems” at the Institute for Micro Process Engineering of KIT. His interests lie in fast exothermic liquid phase reactions, mixing and the industrial application of micro process engineering.

Juergen J. Brandner is currently head of the Thermal Processes Department/Heat Exchange Group of the Institute for Micro Process Engineering of Karlsruhe Institute of Technology (KIT), (Germany). He is also a lecturer for Micro Process Engineering at Dresden Technical University (Germany). Heis author or co-author of about two hundred and eighty technical papers and seven technical books. After studies in chemistry he obtained a Diploma in Electrical Engineering and an Engineering Doctorate in Mechanical Engineering, both from KIT, as well as a habilitation degree from Dresden Technical University.
References
[1] Schubert H, Engel R. Chem. Eng. Res. Des. 2004, 82, 1137–1143.Search in Google Scholar
[2] Schuchmann HP, Köhler K, Aguilar F, Hensel A. In Oil-in-Water and Water-in-Oil Emulsions, Hessel V, Renken A, Schouten JC, Yoshida J. (Eds.), Micro Process Engineering, Volume 2: Device, Reactions and Applications, Wiley-VCH: Weinheim, Germany, 2009, pp. 325–343.10.1002/9783527631445.ch37Search in Google Scholar
[3] Schuchmann HP, Danner T. Chem. Ing. Tech. 2004, 76, 364–375.Search in Google Scholar
[4] Arai K, Konno M, Matinaga Y, Saito S. J. Chem. Eng. Jpn. 1977, 10, 325–330.Search in Google Scholar
[5] Behrend O, Ax K, Schubert H. Ultrason. Sonochem. 2000, 7, 77–85.Search in Google Scholar
[6] De Larrard F, Ferraris CF, Sedran T. Mater. Struct. 1998, 31, 494–498.Search in Google Scholar
[7] Schuchmann HP, Karbstein N, Hecht LL, Gedrat M, Köhler K. In High-Pressure Homogenization for the Production of Emulsions, Eggers R. (Ed.), Industrial High Pressure Applications, Wiley-VCH: Weinheim, 2012, pp. 97–121.10.1002/9783527652655.ch5Search in Google Scholar
[8] Hensel A. Köhler K, Kraut M, Schuchmann HP. Particuology 2011, 9, 506–509.10.1016/j.partic.2011.03.009Search in Google Scholar
[9] Köhler K, Aguilar F, Hensel A, Schubert K, Schubert H, Schuchmann HP. Chem. Eng. Technol. 2007, 30, 1590–1595.Search in Google Scholar
[10] Brandner JJ, Bohn L, Henning T, Schygulla U, Schubert K. Heat. Transfer. Eng. 2007, 28, 761–771.Search in Google Scholar
[11] Halbritter A, Schygulla U, Wenka A, Schubert K. Proc. of the 2nd Internat. Conf. on Microchannels and Minichannels (ICMM2004), ASME, 2004, pp. 967–975.Search in Google Scholar
©2013 by Walter de Gruyter Berlin Boston
This article is distributed under the terms of the Creative Commons Attribution Non-Commercial License, which permits unrestricted non-commercial use, distribution, and reproduction in any medium, provided the original work is properly cited.
Articles in the same Issue
- Masthead
- Masthead
- Graphical abstracts
- In this issue
- Editorial
- “Teamed Science” – the Future, and is 1+1=3?
- CoPIRIDE
- EU FP7 Project CoPIRIDE – towards new production and factory concepts for a sustainable and competitive European chemical industry
- Investigations on the anionic polymerization of butadiene in capillaries by kinetic measurements and reactor simulation
- Supercritical fluid technology in biodiesel production: pilot plant design and operation
- Supercritical fluid technology in biodiesel production
- Selective epoxidation of soybean oil with performic acid catalyzed by acidic ionic exchange resins
- Multi-injection microstructured reactor for intensification of fast exothermic reactions: proof of concept
- Novel manufacturing techniques for microstructured reactors in industrial dimensions
- Bridging sustainability and intensified flow processing within process design for sustainable future factories
- Process intensification in gas-to-liquid reactions: plasma promoted Fischer-Tropsch synthesis for hydrocarbons at low temperatures and ambient pressure
- Original articles
- Atom- and step-economic synthesis of biaryl-substituted furocoumarins, furoquinolones and furopyrimidines by multicomponent reactions and one-pot synthesis
- Development of a continuous emulsification process for a highly viscous dispersed phase using microstructured devices
- Conference announcements
- Ecochem: Free Conference & Exhibition on Sustainable Chemistry & Engineering (MCH Congress Center, Basel, Switzerland, November 19–21, 2013)
- 3rd Industrial Green Chemistry World: Convention & Ecosystem (IGCW-2013; Mumbai, India, December 6–8, 2013)
- 52nd Eastern Analytical Symposium and Exposition (EAS2013): Analytical in Motion: Knowledge, Network, and Career (Somerset, NJ, USA, November 18–20, 2013)
- 2nd International Flow Chemistry Asia Conference and Tradeshow, held in association with the Flow Chemistry Society (Singapore, November 14–15, 2013)
- 15th Brazilian Meeting on Organic Synthesis (15th BMOS): Applied Organic Synthesis in Action: Strategies and Process Development (Campos do Jordão, Brazil, November 10–13, 2013)
- 1st International Symposium on Nanoparticles/Nanomaterials and Applications (ISN2A-2014; Costa de Caparica, Portugal, January 20–22, 2014) and 1st International Conference on Ultrasonic-based Applications: from Analysis to Synthesis. (ULTRASONICS2014; Costa de Caparica, Portugal, September 15–17, 2014)
- Sustainable Oil and Gas 2013 (Edinburgh, Scotland, November 25–26, 2013)
- Conferences 2013–2017
- Book reviews
- Biomimetics: a molecular perspective
- Right first time in fine-chemical process scale-up
- Chemical photocatalysis
- Industrial separation processes: fundamentals