The effects of type and token frequency on word length: a cross-linguistic study
-
Thomas Berg
 ,
Peter Zörnig
,
Peter Zörnig

Abstract
Inspired by Zipf’s Law of Abbreviation, previous research was mostly directed at the interaction of word length and token frequency. Much less is known about the relationship of word length and type frequency, let alone about the differential impact of type and token frequency on word length. These issues are examined on the basis of a non-representative sample of 10 languages. The token frequency analysis reveals that 8 of the 10 languages show a monotonic decrease in frequency with increasing length while 2 languages reveal a unimodal distribution. By contrast, all 10 languages exhibit a rise followed by a monotonic drop of the frequency curve in the type frequency analysis. There appears to be a notable effect of type frequency on the nature of the token frequency distribution: the greater the average length of the words in the lexicon, the higher the probability of a unimodal distribution. Two principles are required to account for these results—a general dispreference for using long words and a language-particular dispreference for short words in the lexicon.
1 Introduction
Zipf (1965 [1935]) is to be credited for having sparked one of the most vibrant fields of research in quantitative linguistics. As is well-known, his Law of Abbreviation posits an inverse relationship between the length of a word and its usage frequency. This law permits both a static and a dynamic interpretation. From a synchronic perspective, a word is all the shorter, the higher its frequency. From the diachronic perspective, a word which undergoes an increase in frequency is predicted to undergo a decrease in length.[1] Notwithstanding a considerable range of variation, numerous languages from a considerable number of different families have been found to exhibit a monotonic decrease in frequency with increasing word length (e.g. Best and Altmann 1996; Popescu et al. 2013; Steiner 2012; Strauss et al. 2005).
In addition to language, several variables such as unit of measurement, genre, time and word structure were examined. Let us consider each in turn. The two most commonly used methods of determining length are in terms of number of syllables and number of graphemes. Largely for practical reasons, phoneme counts are less often performed. Pertinent examples include Ziegler’s (1996) syllable-based analysis of Brasilian Portuguese and Hatzigeorgiu et al.’s (2001) grapheme-based analysis of Greek. Different texts types from Slovenian were examined by Antic et al. (2006). Similarly, different historical stages of German were studied by Best (1997), Kuhr and Müller (1997), Dittrich (1996), and Bartels and Strehlow (1997). The result was always the same: no matter which historical period was considered, there was always a monotonic decrease in frequency as length increased.
The discussion of word structure will be slightly more detailed especially as this variable has been given short shrift in the relevant literature. It would seem natural for any usage-based analysis to consider nothing but surface forms. That is, inflectional variants of the same word would be treated like two different words. However, this is not the only possibility. Three different options are conceivable: the lemma-based, the word-form-based and the stem-based approach. The lemma approach subsumes all inflectional variants under a single main entry. In the case of nouns, all number variants (i.e. singular, plural and possibly dual) and all case variants (e.g. dative and allative) are collapsed and the frequency values of all variants are aggregated. It is not entirely clear how the length of such a main entry can be determined when the different variants are of unequal length. The lemma approach is confronted with the same problem as are lexicographers. It relies on the feasibility of dissociating inflection from derivation. This is not a trivial task as inflection and derivation are known to form a continuum (e.g. Dressler 1989). Moreover, the line separating the two may vary from language to language.
The word-form-based approach faces none of these challenges because it does not impose any categorization. All forms have the same status. By implication, it is predicated on the assumption that there is no relationship among the inflectional variants of a word, at least none which is fundamentally different from that among different derivatives of the same stem (e.g. existence vs. existential). The calculation of word length is straightforward in this approach.
The stem-based approach represents the most radical form of morphological analysis. All bound morphology is removed from morphologically complex words until only the bare stem is left. If the lexical stem is free-standing, it occurs in actual language usage; if, however, it is bound, it is a purely theoretical construct which does not occur in corpora and therefore cannot have a textual frequency. The stem-based approach assumes that all complex words are broken down into their constituent morphemes at some level of representation.
There are two ways in which the relationship among these three approaches may be conceived. They may be seen as different but equally viable perspectives on the same issue. In this view, they would be treated as complementary to one another. If, however, they are viewed as competitors, only one is adequate and the other two are inadequate. How could we arbitrate among these approaches? The gold standard almost certainly is psychological reality. If the mental representation of words is holistic, the word-form-based approach is to be preferred. If the mental representation is thoroughly analytic, the stem-based approach has much to recommend it. If inflectional variants are not separately represented (but generated by rule), the lemma-based approach gains favour (for a seminal article on lexical representation, see Butterworth 1983).
All three approaches are subject to the critical distinction between type and token frequency. For many decades, word length studies have been heavily focused on token frequency. However, the relationship between word length and type frequency is no less worthy of investigation than that between word length and token frequency. While the latter may seem more direct and hence, more intuitive, the former derives its appeal from being less direct and hence, less obvious. It all turns on how independent langue and parole (to use Saussure’s terms) are from each other. If there is a strong interdependence between them, type and token frequency may be expected to impact on word length in similar ways; if, however, the two aspects are rather autonomous, word length may be expected to be quite independent of type frequency in stark contrast to token frequency. The only way to find out is to systematically compare the effects of type and token frequency on word length.
Actually, few studies have investigated the relationship between word length and type frequency and even fewer have compared type and token frequency effects on length. It is sufficient to discuss one analysis which placed type frequency at centre-stage. Smith (2012) is a cross-linguistic study of the relationship between word length and type frequency. He took his data from spell-check dictionaries from 11 mostly Indo-European languages. Length was measured in terms of graphemes. He found that languages were similar in peaking at between 8 and 12 graphemes and showing a monotonic increase before the peak and a monotonic decrease after the peak. Taken at face value, the major difference among the languages involved the increase and decrease rate. While Smith did not provide any details on the dictionaries he used, it is fairly obvious that this difference is brought about by widely varying dictionary size. The lack of a normalization procedure hampers cross-linguistic comparability and limits the value of Smith’s work for our purposes.
Next, we consider four studies which examined both type and token frequency effects on word length. In all four works, length was measured in terms of syllables per word. Aoyama and Constable (1999) culled a diachronic convenience corpus of English spanning four centuries but did not separately analyze the different historical stages. Whereas token frequency monotonically decreased with increasing length, the type frequency graph peaked at a length of two syllables and then dropped steadily (see their Table 2 and Figure 6). While the authors make no big point of the difference between type and token frequency effects, they comment that the two distributions are distinct and speculate that they may have been identical in the beginning stages of the evolution of language.
Wei et al.’s (2021) analysis of Zhuang, a Tai-Kadai language, yields almost the same results as Aoyama & Constable’s of English. A unimodal distribution is observed in the type frequency analysis but a monotonically declining frequency curve is found in the token frequency analysis. A breakdown by text type reveals that the impact of type frequency on length is highly similar across genres. However, one of the genres (i.e. government work report) shows a preference for disyllabic word tokens, thus effectively resembling the type frequency analysis.[2] The authors make no attempt at coming to grips with the disparate effects of type and token frequency on word length.
Narisong and Liu’s (2014) results for Mongolian, an Altaic language, differ significantly from those for English and Zhuang. In the type frequency analysis, the curve monotonically increased for monosyllabic and disyllabic words, then peaked at length 3 and subsequently decreased monotonically. This simply shows that Mongolian words are on average longer than English and Zhuang ones. Quite surprisingly, the token frequency analysis produced results which were basically similar to those of the type frequency analysis. Trisyllabic words formed the most frequent class with a monotonic increase for the shorter and a monotonic decrease for the longer words.
Wang (2013) investigated word length in Chinese, a Sino-Tibetan language. Unlike Zhuang but like Mongolian, Chinese showed a unimodal distribution in both the type and the token frequent count. In view of its isolating nature, it is not surprising that its words are shorter than those in Mongolian. Both the type and the token frequency curve peaked at length 2. No substantive explanation is offered for these results.
The preceding review of some of the relevant literature reveals both consistent and inconsistent patterns across languages. Cross-language consistency is found in the type frequency count but not in the token frequency count. In all four languages, the type frequency graph points to a unimodal distribution. In the token frequency analysis, two languages show a steadily declining curve whereas another two languages show an initial rise followed by a drop (as in the type frequency analysis). The relationship of type and token frequency in their effects on length remains obscure throughout.
There is thus a dire need for a cross-linguistic study which systematically compares the effect of type and token frequency on word length. Such a study may help us to determine the extent of cross-linguistic variation as well as which patterns are more typical and which are less typical. In particular, the under-researched area of type frequency effects calls for a larger database. Only when such a database is available can we begin to contrast type and token frequency effects. In particular, we would like to know whether there is a correlation between the length of word types and that of word tokens. It is also useful to try to replicate previous findings on the basis of new corpora. At a more theoretical level, we would like to understand the reasons for possible differences between type and token frequency effects on word length as well as the reasons that may lead to different languages opting for different distributions. The mathematical modelling of our findings is an issue we wish to take up in our future work.
2 Method
The analysis of type and token frequency effects will be performed on the basis of frequency dictionaries, which by their very nature furnish token frequency information for all the types that are included in them. Moreover, a frequency dictionary may be expected to draw on a text base which represents a cross-section of ordinary language usage (whatever this may exactly mean). Frequency dictionaries were consulted for 10 languages, which divide into 8 Indo-European and 2 non-Indo-European ones. The Indo-European languages further subdivide into 3 Germanic and 4 Romance languages as well as Greek. This is a convenience sample dictated largely by the availability of relevant sources. We are therefore in no position to link our results to areal or genealogical features. A survey of the frequency dictionaries used is presented in Table 1. Note that two frequency dictionaries were consulted for Italian.
The database.
| Language | Inclusion strategy | Dictionary size | Text size | Mode | Format | Word forms | Source |
|---|---|---|---|---|---|---|---|
| Basque | Representative | 100,800 | 5,000,000 | Written/spoken | Electronic | Yes | E-Hitz |
| Dutch | Representative | 124,136 | 42,380,000 | Written | Electronic | Yes | CELEX |
| English | Representative | 52,447 | 17,900,000 | Mainly written | Electronic | Yes | CELEX |
| Finnish | Radical | 12,663 | 408,301 | Written/spoken | Paper | No | Saukkonen |
| French | Radical | 5,082 | 500,000 | Written | Paper | Yes | Juilland |
| German | Representative | 51,728 | 6,000,000 | Mainly written | Electronic | Yes | CELEX |
| Greek | Radical | 200 | 242,731 | Written | Electronic | Yes | LEXITERIA |
| Italian I | Radical | 5,014 | 500,000 | Written | Paper | Yes | Juilland |
| Italian II | Representative | 15,641 | 500,000 | Written | Paper | Yes | de Mauro |
| Rumanian | Radical | 4,841 | 500,000 | Written | Paper | Yes | Juilland |
| Spanish | Radical | 5,024 | 500,000 | Written | Paper | Yes | Juilland |
As can be gathered from Table 1, the dictionaries vary widely in size. Leaving Greek aside for the moment, the range is between approximately 5,000 and 125,000 words. This wide range is related to how the dictionaries were compiled. In fact, two types of frequency dictionary have to be distinguished (see the column “Inclusion Strategy” in Table 1). The first type lists all words that are found in the text corpus on which the lexicographers relied for the compilation of their dictionary. This type is here called “representative”. The second type lists only the most frequent words—from the single most frequent word down to the xth most frequent word. It is accordingly called “radical”. The size of a radical frequency dictionary is crucial. If it includes, let us say, the 50,000 most frequent words, the two dictionary types are likely to be indistinguishable in terms of average word length. If, however, such a dictionary contains only a few hundred words, it is unlikely to provide an accurate picture of average word length. This is a simple spin-off of Zipf’s Law of Abbreviation: if only the most frequent words are taken into account, these are bound to be shorter than a representative sample drawn from the entire frequency spectrum.[3]
In an attempt to assess the strength of this bias, a representative and a radical dictionary from the same language were included. The availability of two frequency dictionaries in Italian would seem to offer just such an opportunity. Juilland and Traversa’s (1973) is a radical frequency dictionary whereas De Mauro et al.’s (1993) is a representative one. Henceforth, the former dictionary will be referred to as “Italian I” and the latter as “Italian II”. Unfortunately, the two dictionaries differ not only in terms of size but also in terms of text type. De Mauro et al.’s dictionary is three times the size of Juilland and Traversa’s. Additionally, de Mauro et al.’s dictionary is committed to the spoken language whereas Juilland and Traversa’s targets the written language (see below). This renders it difficult to assign one specific cause to a possible difference in the length distributions of Italian I and II. Note in passing that the analysis of the Romance languages mainly draws on radical frequency dictionaries while that of the Germanic languages relies on representative ones.
Greek represents a special case. In the absence of an ordinary frequency dictionary, the Lexiteria project was tapped. This database includes frequency information for 242,731 word forms based on a web corpus of more than 16 million words. Regrettably, this frequency dictionary is not openly accessible. What is, however, available is a list of the 200 most frequent words. The single letters which appear on this list were eliminated, leaving us with barely 190 items. Turning vice into virtue, this shortage of data gives us the opportunity of examining whether this heavily biased dataset generates a distribution which differs from those languages with representative frequency dictionaries. Despite this advantage, there is no denying that the Greek data should be treated with extreme caution.
Most of the dictionaries in Table 1 draw on written language. When spoken language is included, it is often not clear to what extent it is represented. However, it may be surmised that the proportion of spoken language is fairly low. As noted above, an exception to the rule is de Mauro et al.’s frequency dictionary which is expressly dedicated to spoken Italian. It is based on telephone conversations, oral exams, public debates and the like. Spoken words might be expected to be on average slightly shorter than written words.
The majority of the dictionaries listed in Table 1 do not contain syllabified entries. For these languages, syllabification was done by hand. While the identification of syllable boundaries may be a thorny issue, in particular in languages with ambisyllabic consonants, counting the number of syllables is less of a challenge (see Liberman et al. 1974). One of the few problems involved determining the syllable structure of words with two adjacent vowels, which could be tautosyllabic or heterosyllabic. Obviously, this affects word length. We relied on our working knowledge of some of these languages. When this knowledge was not sufficient, we listened to the pronunciations provided by electronic dictionaries or consulted native speakers. Syllabification information was available for Basque, Dutch, English and German. Needless to say, we accepted wholesale the decisions that were made for these languages.
Most dictionaries distinguish between lemmas and word forms. This provision allowed us to examine possible effects that the decision between lemmas and word forms might have on the correlation between frequency and length. This decision had no effect in Narisong et al.’s analysis of Mongolian, but this is evidently no guarantee that the same result obtains in other languages. We decided to take a closer look at Dutch, English, German and Basque. The electronic format in which the relevant dictionaries are available made these four languages a convenient choice.
3 Data analysis
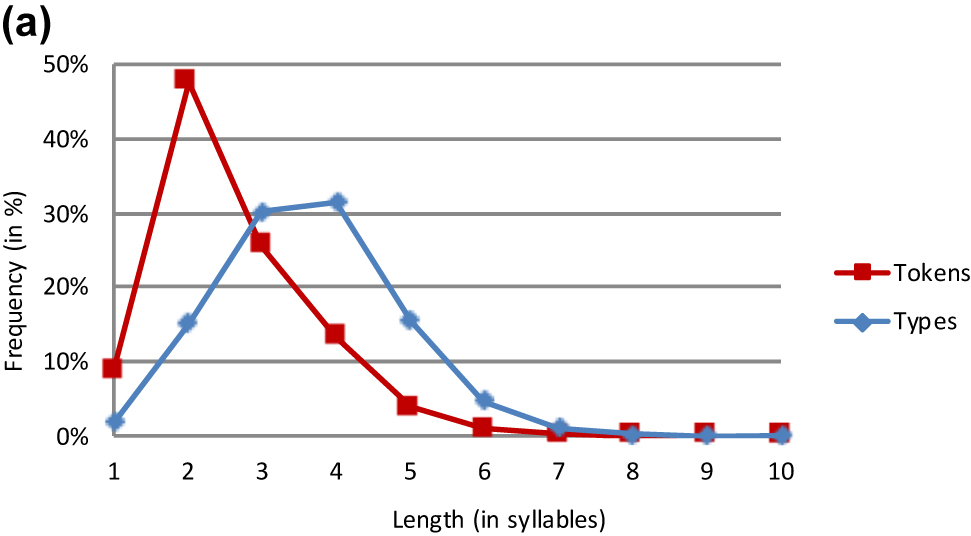
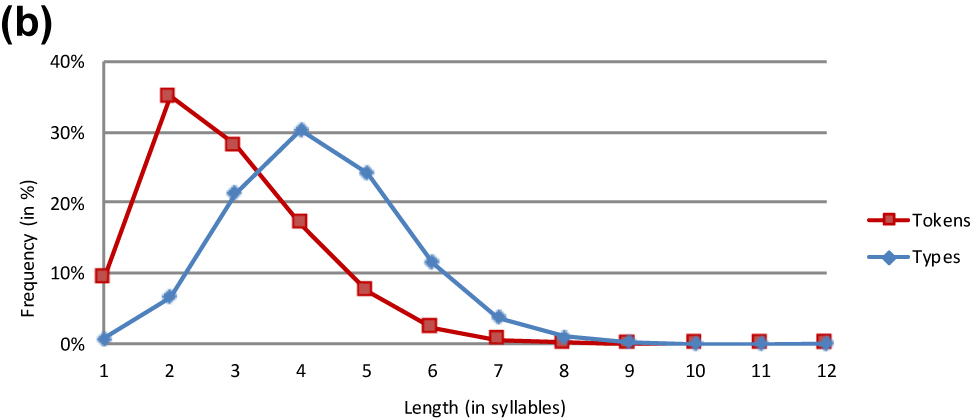
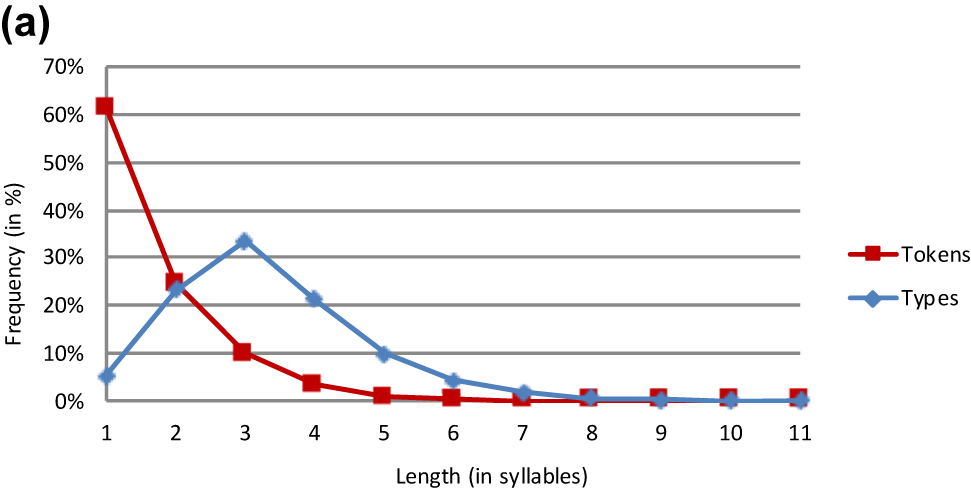
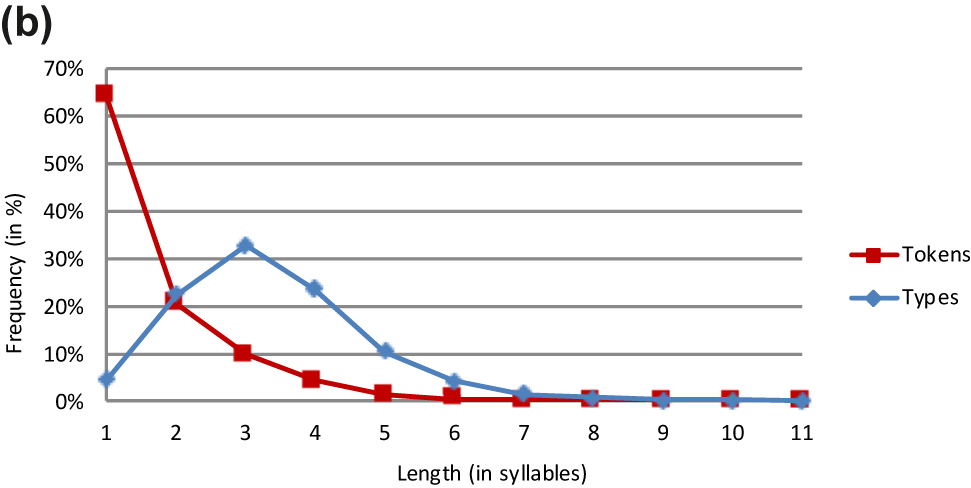
Our main analysis compares the 10 languages in Table 1 using the lemma-based approach. Section 3.1 focuses on type frequency effects while Section 3.2 focuses on token frequency effects. Type frequency is compared to token frequency in Section 3.3. Tables 2 –11 provide absolute numbers and percentages for the individual languages. For illustrative purposes, these results are graphically represented in Figures 1 –10.
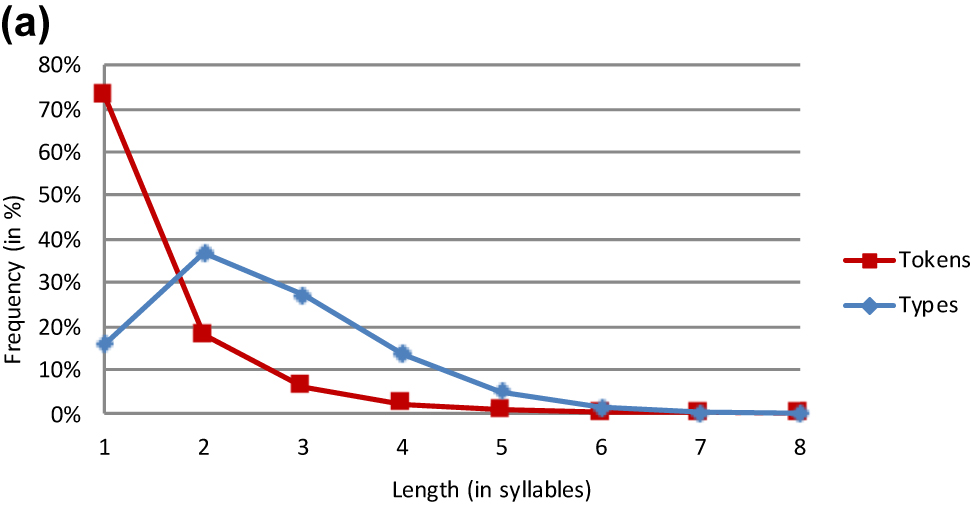
Basque lemmas.
| 1 syllable | 2 syllables | 3 syllables | 4 syllables | 5 syllables | 6 syllables | 7 syllables | 8 syllable | 9 syllables | 10 syllables | Total | Average syllables | |
|---|---|---|---|---|---|---|---|---|---|---|---|---|
| Types | 352 | 2.959 | 5.884 | 6.148 | 3.021 | 922 | 219 | 41 | 9 | 2 | 19.557 | 3.64 |
| Types % | 1.8% | 15.1% | 30.1% | 31.4% | 15.4% | 4.7% | 1.1% | 0.2% | 0.0% | 0.0% | 100% | |
| Tokens | 79.153.599.528 | 425.462.698.643 | 229.057.816.391 | 118.991.352.108 | 33.264.498.379 | 7.352.486.924 | 788.119.514 | 154.245.777 | 21.352.218 | 2.230.829 | 894.248.400.311 | 2.58 |
| Tokens % | 8.9% | 47.6% | 25.6% | 13.3% | 3.7% | 0.8% | 0.1% | 0.0% | 0.0% | 0.0% | 100% |
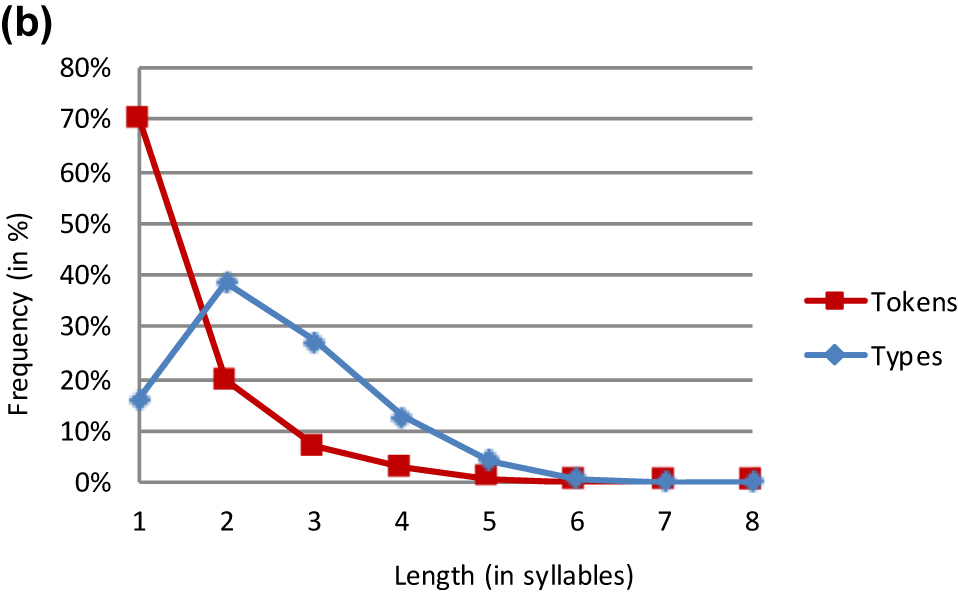
Basque word forms.
| 1 syllable | 2 syllables | 3 syllables | 4 syllables | 5 syllables | 6 syllables | 7 syllables | 8 syllables | 9 syllables | 10 syllables | 11 syllables | 12 syllables | Total | Average syllables | |
|---|---|---|---|---|---|---|---|---|---|---|---|---|---|---|
| Types | 762 | 6.620 | 21.389 | 30.321 | 24.320 | 11.608 | 3.818 | 977 | 219 | 37 | 8 | 1 | 100.080 | 4.27 |
| Types % | 0.8% | 6.6% | 21.4% | 30.3% | 24.3% | 11.6% | 3.8% | 1.0% | 0.2% | 0.0% | 0.0% | 0.0% | 100% | |
| Tokens | 88.548.987 | 335.963.797 | 268.512.098 | 162.672.294 | 71.788.108 | 22.501.297 | 5.460.127 | 1.199.780 | 193.446 | 51.853 | 5.214 | 549 | 956.897.550 | 2.89 |
| Tokens % | 9.3% | 35.1% | 28.1% | 17.0% | 7.5% | 2.4% | 0.6% | 0.1% | 0.0% | 0.0% | 0.0% | 0.0% | 100% |
Dutch lemmas.
| 1 syllable | 2 syllables | 3 syllables | 4 syllables | 5 syllables | 6 syllables | 7 syllables | 8 syllables | 9 syllables | 10 syllables | 11 syllables | Total | Average syllables | |
|---|---|---|---|---|---|---|---|---|---|---|---|---|---|
| Types | 3.782 | 16.737 | 24.068 | 15.220 | 7.101 | 3.096 | 1.176 | 391 | 107 | 14 | 1 | 71.693 | 3.30 |
| Types % | 5.3% | 23.3% | 33.6% | 21.2% | 9.9% | 4.3% | 1.6% | 0.5% | 0.1% | 0.0% | 0.0% | 100% | |
| Tokens | 24.378.707 | 9.766.184 | 3.965.767 | 1.337.255 | 269.976 | 62.669 | 16.289 | 4.448 | 766 | 110 | 6 | 39.802.177 | 1.58 |
| Tokens % | 61.2% | 24.5% | 10.0% | 3.4% | 0.7% | 0.2% | 0.0% | 0.0% | 0.0% | 0.0% | 0.0% | 100% |
Dutch word forms.
| 1 syllable | 2 syllables | 3 syllables | 4 syllables | 5 syllables | 6 syllables | 7 syllables | 8 syllables | 9 syllables | 10 syllables | 11 syllables | Total | Average syllables | |
|---|---|---|---|---|---|---|---|---|---|---|---|---|---|
| Types | 5.841 | 29.231 | 42.450 | 30.444 | 13.461 | 5.293 | 1.930 | 662 | 197 | 30 | 7 | 129.546 | 3.35 |
| Types % | 4.5% | 22.6% | 32.8% | 23.5% | 10.4% | 4.1% | 1.5% | 0.5% | 0.2% | 0.0% | 0.0% | 100% | |
| Tokens | 24.290.198 | 7.706.392 | 3.682.634 | 1.599.715 | 445.014 | 105.168 | 24.111 | 6.510 | 1.338 | 193 | 45 | 37.861.318 | 1.59 |
| Tokens % | 64.2% | 20.4% | 9.7% | 4.2% | 1.2% | 0.3% | 0.1% | 0.0% | 0.0% | 0.0% | 0.0% | 100% |
English lemmas.
| 1 syllable | 2 syllables | 3 syllables | 4 syllables | 5 syllables | 6 syllables | 7 syllables | 8 syllables | Total | Average syllables | |
|---|---|---|---|---|---|---|---|---|---|---|
| Types | 6.107 | 14.095 | 10.369 | 5.246 | 1.918 | 444 | 73 | 10 | 38.262 | 2.54 |
| Types % | 16.0% | 36.8% | 27.1% | 13.7% | 5.0% | 1.2% | 0.2% | 0.0% | 100% | |
| Tokens | 12.550.116 | 3.085.698 | 1.051.710 | 390.342 | 103.209 | 12.174 | 1.369 | 41 | 17.194.659 | 1.4 |
| Tokens % | 73.0% | 17.9% | 6.1% | 2.3% | 0.6% | 0.1% | 0.0% | 0.0% | 100% |
English word forms.
| 1 syllable | 2 syllables | 3 syllables | 4 syllables | 5 syllables | 6 syllables | 7 syllables | 8 syllables | Total | Average syllables | |
|---|---|---|---|---|---|---|---|---|---|---|
| Types | 9.910 | 23.616 | 16.641 | 7.774 | 2.659 | 527 | 81 | 10 | 61.218 | 2.54 |
| Types % | 16.2% | 38.6% | 27.2% | 12.7% | 4.3% | 0.9% | 0.1% | 0.0% | 100% | |
| Tokens | 10.780.532 | 3.023.471 | 1.057.506 | 481.317 | 107.322 | 12.214 | 1.375 | 41 | 15.383.778 | 1.44 |
| Tokens % | 70.1% | 19.7% | 6.9% | 2.6% | 0.7% | 0.1% | 0.0% | 0.0% | 100% |
Finnish lemmas.
| 1 syllable | 2 syllables | 3 syllables | 4 syllables | 5 syllables | 6 syllables | 7 syllables | 8 syllables | 9 syllables | 10 syllables | 11 syllables | 12 syllables | 13 syllables | 14 syllables | 15 syllables | Total | Average syllables | |
|---|---|---|---|---|---|---|---|---|---|---|---|---|---|---|---|---|---|
| Types | 194 | 2421 | 3.981 | 2.998 | 1.810 | 769 | 305 | 102 | 37 | 14 | 10 | 2 | 4 | 2 | 2 | 12.651 | 3.66 |
| Types % | 1.5% | 19.1% | 31.5% | 23.7% | 14.3% | 6.1% | 2.4% | 0.8% | 0.3% | 0.1% | 0.1% | 0.0% | 0.0% | 0.0% | 0.0% | 100% | |
| Tokens | 55.296 | 157.159 | 93.487 | 36.867 | 14.390 | 4.700 | 1.480 | 503 | 173 | 72 | 40 | 10 | 25 | 11 | 7 | 369.220 | 2.52 |
| Tokens % | 15.0% | 42.6% | 26.7% | 10.0% | 3.9% | 1.3% | 0.4% | 0.1% | 0.0% | 0.0% | 0.0% | 0.0% | 0.0% | 0.0% | 0.0% | 100% |
French lemmas.
| 1 syllable | 2 syllables | 3 syllables | 4 syllables | 5 syllables | 6 syllables | Total | Average syllables | |
|---|---|---|---|---|---|---|---|---|
| Types | 911 | 2.035 | 1.574 | 475 | 79 | 4 | 5.078 | 2.37 |
| Types % | 17.9% | 48.1% | 31.0% | 9.4% | 1.6% | 0.1% | 100% | |
| Tokens | 295.032 | 116.207 | 40.561 | 9.334 | 1.222 | 56 | 462.412 | 1.50 |
| Tokens % | 63.8% | 25.1% | 8.8% | 2.0% | 0.3% | 0.0% | 100% |
German lemmas.
| 1 syllable | 2 syllables | 3 syllables | 4 syllables | 5 syllables | 6 syllables | 7 syllables | 8 syllables | 9 syllables | 10 syllables | Total | Average syllables | |
|---|---|---|---|---|---|---|---|---|---|---|---|---|
| Type | 1.658 | 9.369 | 13.350 | 7.274 | 2.602 | 805 | 226 | 49 | 11 | 1 | 35.345 | 3.10 |
| Typos % | 4.7% | 26.5% | 37.8% | 20.6% | 7.4% | 2.3% | 0.6% | 0.1% | 0.0% | 0.0% | 100% | |
| Tokens | 2.668.270 | 1.395.776 | 624.024 | 195.990 | 62.071 | 15.240 | 2.672 | 618 | 161 | 11 | 4.964.833 | 1.72 |
| Tokens % | 53.7% | 28.1% | 12.6% | 3.9% | 1.3% | 0.3% | 0.1% | 0.0% | 0.0% | 0.0% | 100% |
German word forms.
| 1 syllable | 2 syllables | 3 syllables | 4 syllables | 5 syllables | 6 syllables | 7 syllables | 8 syllables | 9 syllables | 10 syllables | Total | Average syllables | |
|---|---|---|---|---|---|---|---|---|---|---|---|---|
| Type | 2.940 | 19.128 | 27.485 | 21.323 | 8.403 | 2.543 | 710 | 122 | 36 | 8 | 82.618 | 3.30 |
| Types % | 3.6% | 23.2% | 33.2% | 25.8% | 10.2% | 3.1% | 0.9% | 0.1% | 0.0% | 0.0% | 100% | |
| Tokens | 2.221.637 | 1.351.448 | 610.667 | 276.201 | 90.286 | 26.332 | 7.241 | 1.101 | 221 | 60 | 4.585.194 | 1.86 |
| Tokens % | 48.5% | 29.5% | 13.3% | 6.0% | 2.0% | 0.6% | 0.2% | 0.0% | 0.0% | 0.0% | 100% |
Greek lemmas.
| 1 syllable | 2 syllables | 3 syllables | 4 syllables | 5 syllables | Total | Average syllables | |
|---|---|---|---|---|---|---|---|
| Types | 39 | 93 | 42 | 13 | 3 | 190 | 2.20 |
| Types % | 20.5% | 48.9% | 22.1% | 6.8% | 1.6% | 100% | |
| Tokens | 5.382.599 | 1.705.457 | 421.604 | 117.153 | 20.583 | 7.647.396 | 1.39 |
| Tokens % | 70.4% | 22.3% | 5.5% | 1.5% | 0.3% | 100% |
Italian lemmas.
| 1 syllables | 2 syllables | 3 syllables | 4 syllables | 5 syllables | 6 syllables | 7 syllables | Total | Average syllables | |
|---|---|---|---|---|---|---|---|---|---|
| Types | 87 | 1.064 | 1.822 | 1.467 | 484 | 84 | 6 | 5.014 | 3.29 |
| Types % | 1.7% | 21.2% | 36.3% | 29.3% | 9.7% | 1.7% | 0.1% | 100% | |
| Tokens | 180.246 | 90.815 | 87.176 | 33.202 | 9.785 | 1.445 | 58 | 402.727 | 2.02 |
| Tokens % | 44.8% | 22.6% | 21.6% | 8.2% | 2.4% | 0.4% | 0.0% | 100% |
Italian lemmas.
| 1 syllable | 2 syllables | 3 syllables | 4 syllables | 5 syllables | 6 syllables | 7 syllables | 8 syllable | 9 syllables | 10 syllables | 11 syllables | 12 syllables | 13 syllables | 14 syllables | 15 syllables | Total | Average syllables | |
|---|---|---|---|---|---|---|---|---|---|---|---|---|---|---|---|---|---|
| Types | 282 | 1.838 | 3.793 | 4.106 | 2.189 | 763 | 210 | 72 | 36 | 25 | 27 | 1 | 0 | 1 | 1 | 13.344 | 3.77 |
| Types % | 2.1% | 13.8% | 28.4% | 30.8% | 16.4% | 5.7% | 1.6% | 0.5% | 0.3% | 0.2% | 0.2% | 0.0% | 0.0% | 0.0% | 0.0% | 100% | |
| Tokens | 167.177 | 140.546 | 119.843 | 35.293 | 14.252 | 3.059 | 489 | 123 | 86 | 43 | 35 | 1 | 0 | 1 | 1 | 480.949 | 2.17 |
| Tokens % | 34.8% | 29.2% | 24.9% | 7.3% | 3.0% | 0.6% | 0.1% | 0.0% | 0.0% | 0.0% | 0.0% | 0.0% | 0.0% | 0.0% | 0.0% | 100% |
Rumanian lemmas.
| 1 syllables | 2 syllables | 3 syllables | 4 syllables | 5 syllables | 6 syllables | 7 syllables | Total | Average syllables | |
|---|---|---|---|---|---|---|---|---|---|
| Types | 467 | 1.550 | 1.633 | 880 | 277 | 32 | 2 | 4.841 | 2.80 |
| Types % | 9.6% | 32.0% | 33.7% | 18.2% | 5.7% | 0.7% | 0.0% | 100% | |
| Tokens | 207.377 | 137.023 | 55.964 | 22.927 | 6.399 | 513 | 23 | 430.226 | 1.80 |
| Tokens % | 48.2% | 31.8% | 13.0% | 5.3% | 1.5% | 0.1% | 0.0% | 100% |
Spanish lemmas.
| 1 syllable | 2 syllables | 3 syllables | 4 syllables | 5 syllables | 6 syllables | 7 syllables | 8 syllables | 9 syllables | Total | Average syllables | |
|---|---|---|---|---|---|---|---|---|---|---|---|
| Types | 106 | 1.352 | 1.976 | 1.178 | 341 | 55 | 13 | 2 | 1 | 5.024 | 3.11 |
| Types % | 2.1% | 26.9% | 39.3% | 23.4% | 6.8% | 1.1% | 0.3% | 0.0% | 0.0% | 100% | |
| Tokens | 231.695 | 136.998 | 60.524 | 23.940 | 6.585 | 726 | 249 | 28 | 6 | 460.751 | 1.78 |
| Tokens % | 50.3% | 29.7% | 13.1% | 5.2% | 1.4% | 0.2% | 0.1% | 0.0% | 0.0% | 100% |
Basque lemmas.
Basque word forms.
Dutch lemmas.
Dutch word forms.
English lemmas.
English word forms.
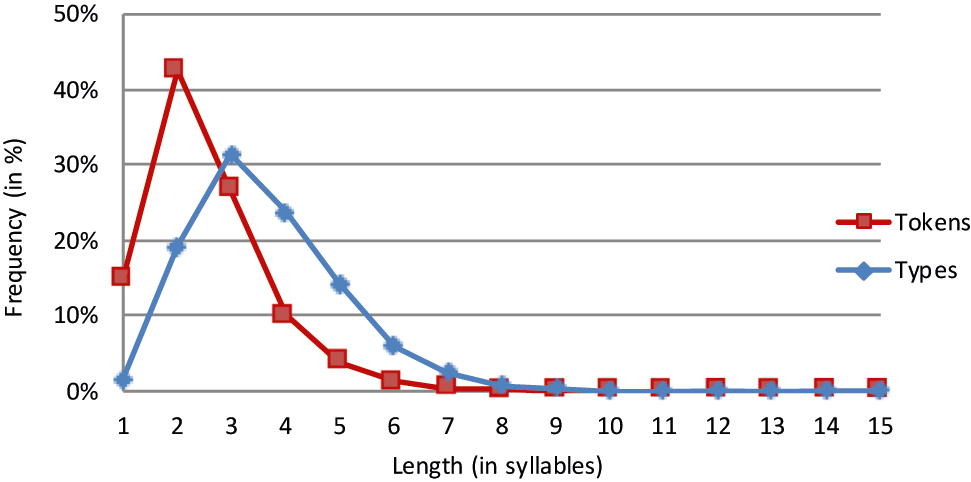
Finnish lemmas.
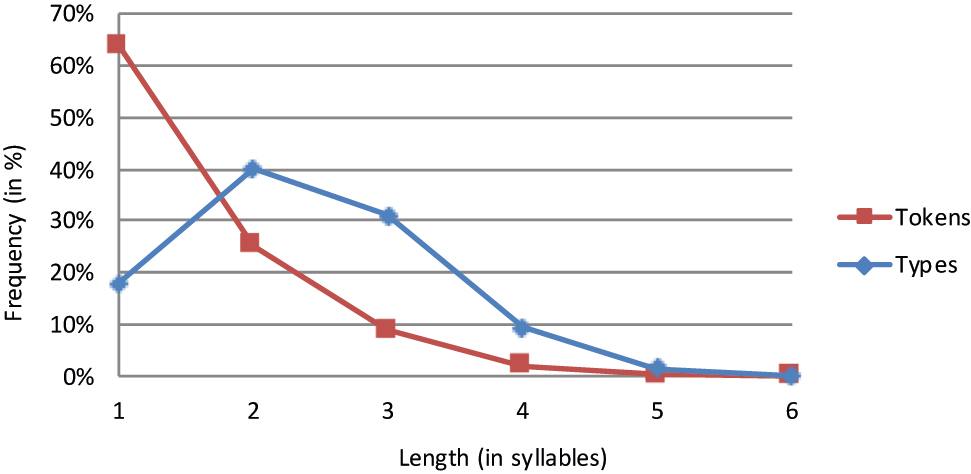
French lemmas.
German lemmas.
German word forms.
Greek lemmas.
Italian lemmas.
Italian lemmas.
Rumanian lemmas.
Spanish lemmas.
3.1 Type frequency effects
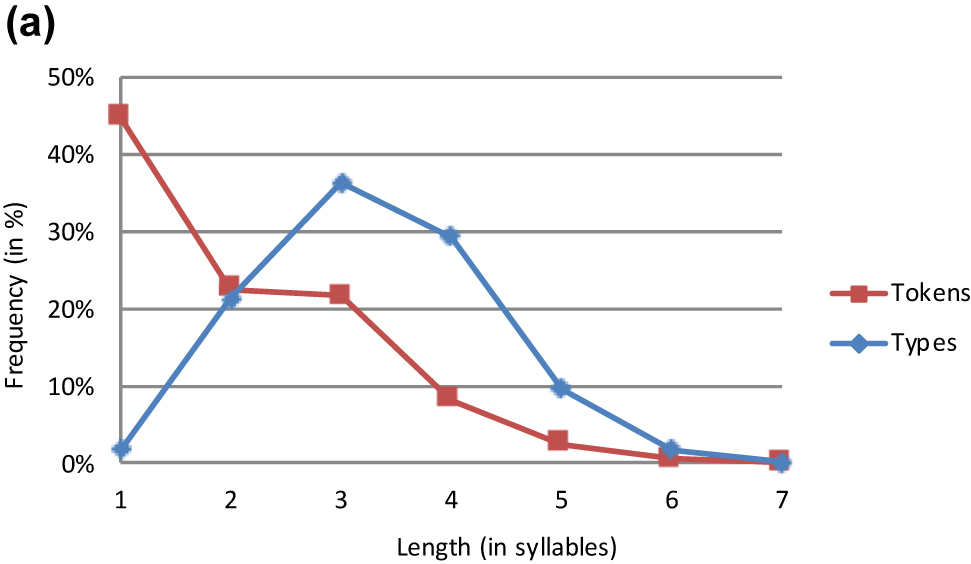
The type frequency distributions are rather similar across the 10 languages. All languages have a smaller share of monosyllabic than of polysyllabic word types. With the exception of Basque and Italian II, the graphs of all languages peak either at length 2 or at length 3. More specifically, three languages (e.g. French) exhibit a relative predominance of disyllabic words while six languages (e.g. German) reveal a preference for trisyllabic words. In Basque and Italian II, quadrisyllabic word types form the relative majority even though these are only marginally more frequent than trisyllabic words. The curves of all 10 languages are unimodal, i.e. they increase monotonically before the peak and decrease monotonically thereafter. Not surprisingly, the increase and the decrease rate vary substantially from language to language. For example, a rather steep upward slope is observed in Italian and Spanish while it is shallower in English and Rumanian. This slope is determined to a great extent by the frequency of monosyllabic words. It is on this score that the languages differ widely. Whereas some languages (e.g. Basque and Finnish) show a strong aversion to monosyllabic words, other languages (e.g. Dutch and German) show a weaker aversion and still other languages (e.g. English and French) are more tolerant of monosyllabicity.[4] There is also cross-linguistic variation in the difference between the increase rate from length 1 to 2 and that from length 2 to 3 in the languages with a preponderance of trisyllabic words. While some languages (e.g. Italian I) show no such difference (i.e. a straight line), others (e.g. Rumanian) show a less steep slope from length 2 to 3 as compared to that from length 1 to 2.
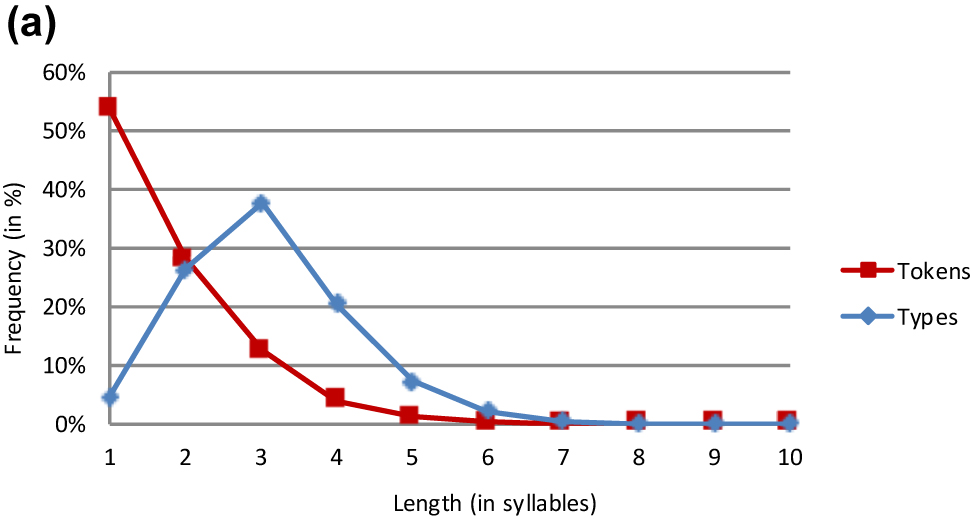
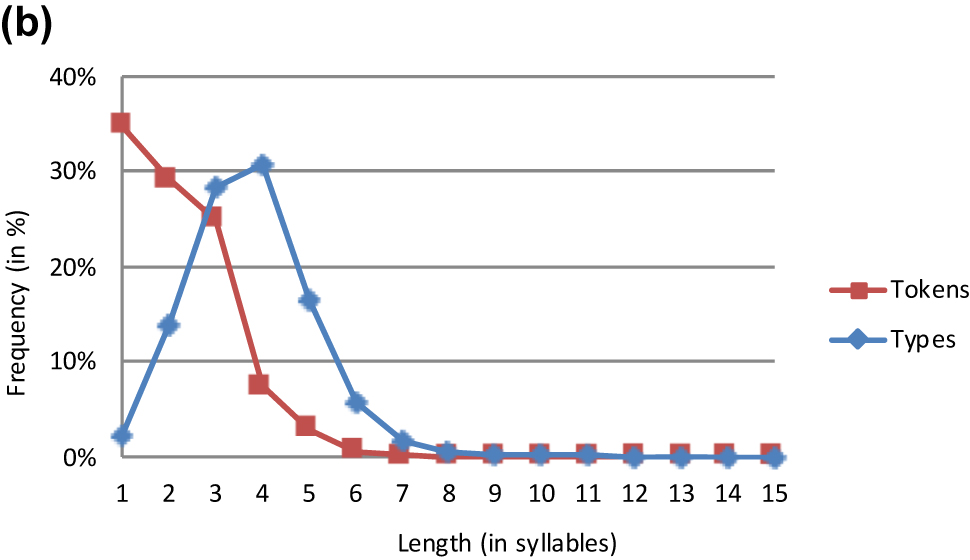
The lemma and the word form analyses yield very similar results. This is particularly true of the three Germanic languages (Tables 3, 4, and 6). The major difference between the lemma and the word form analyses in Basque is that the slope is steeper in the former than the latter curve (Figure 1). However, both graphs peak at length 4 at almost the same level.
It is remarkable that the two frequency distributions for Italian word types diverge in two related respects. For one, average word length is higher in Italian II than in Italian I; for another, the graph for Italian II peaks later than that for Italian I. It is likely that this length difference emanates from the difference in dictionary size and type. The restriction to the 5,000 most frequent words in Juilland and Traversa’s dictionary entailed the loss of long, low-frequency words. By virtue of Zipf’s Law of Abbreviation, the more inclusive nature of de Mauro et al.’s dictionary brought about a higher average word length.
The frequency data for English (Table 4) allow for a successful replication of Aoyama and Constable’s (1999) results. Like ours, their study attests to a predilection for disyllabic word types (see introductory section). This agreement demonstrates that the influence of type frequency on word length has remained stable since the Early Modern English period.
The frequency data for Dutch compare favourably to Rheinländer’s (2001) data. Like ours, her dictionary analysis yields a predominance of trisyllabic words.
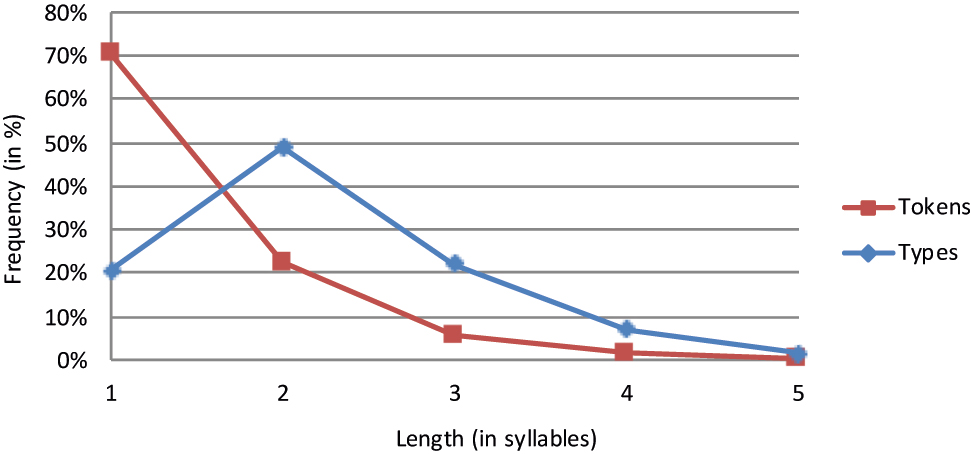
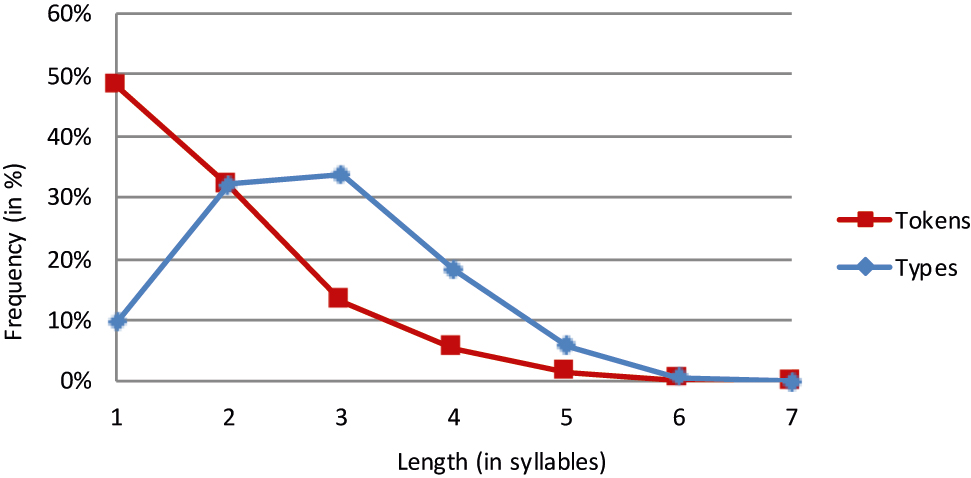
We also have occasion to compare our French data to a database compiled by Content et al. (1990), who also examined type frequency as a function of length. In contrast to Table 6 above, they report a peak at length 3 rather than length 2. In actual fact, the difference between Content et al.’s results and ours does not come unexpected. Content et al. draw on the “Micro-Robert”, a dictionary which lists more than 35,000 entries. As can be gleaned from Table 1, the size of Juilland, Brodin, and Davidovitch’s dictionary is much more modest. It stands to reason that the relatively small size of Juilland et al.’s radical dictionary introduced a bias in favour of including shorter words. This bias would explain why Content et al.’s data show a predominance of trisyllabic words while our data show a predominance of disyllabic words.
3.2 Token frequency effects
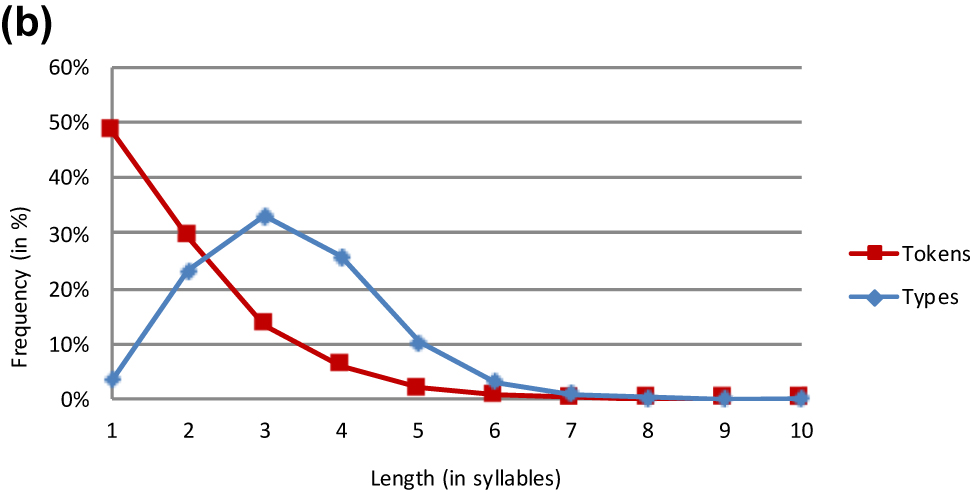
The token frequency distributions fall into two classes – a majority and a minority pattern. The majority pattern, which is observed in eight languages, involves a monotonic decrease in frequency as length increases. These languages are all of Indo-European origin. Not surprisingly, the slope of the curves varies from language to language. While some languages (e.g. Dutch and English) show a steep decrease in frequency from length 1 to length 2, others (e.g. Rumanian and Spanish) reveal a more modest decrease in frequency from monosyllabic to disyllabic words. It seems that there is a genealogical effect here. This decrease is steeper in the Germanic than the Romance languages.
The minority pattern is found in the two non-Indo-European languages Finnish and Basque.[5] Their token frequency graphs peak at length 2 and taper off rather slowly, with a relatively high rate of tri- and quadrisyllabic words. It is notable that Finnish and Basque show a quite similar pattern. In view of the fact that the dataset includes only two non-Indo-European languages, which are not even related, it is unwise to interpret their token frequency distributions in genealogical terms.
What determines the decision for or against a monotonic decline of the token frequency graph? First and foremost, the answer lies in the extent of the use of monosyllabic words. This criterion clearly distinguishes Finnish and Basque from the other languages in the sample. The latter have a rate of monosyllabicity spanning from 35 to 73%. By contrast, Basque and Finnish use far fewer monosyllabic words (i.e. 8.9% for Basque and 15.0% for Finnish). This modest beginning of the graphs is followed by a fairly strong increase in frequency from length 1 to length 2. Since the percentages must add up to 100, it is not hard to see the link between the limited use of monosyllabicity and the rather heavy use of longer words. These are two different manifestations of a limited preference for using longer words, a preference which is obviously modulated by word length.
It is worth adding that the token frequency graphs for both Basque and Finnish slope down beyond length 2. However, they remain higher than those for the Indo-European languages for disyllabic and all longer words. This confirms that the difference between Basque/Finnish and the other languages can indeed be located in the relative proclivity for using longer words. Thus, Basque and Finnish align themselves with Mongolian and Chinese, as discussed above, as well as with Ancient Hebrew (Afro-Asiatic; Balschun 1997) and Quechua (Quechuan; Best and Madrano 1997). While languages with a unimodal distribution are in the minority in our database, it should be recalled that our sample is not representative of the languages of the world. All we can say at this point is that a certain number of Indo-European languages show a monotonic decrease in the frequency curve.[6]
As in the type frequency analysis, the token frequency analysis brings forth highly similar patterns for lemmas and word forms in Dutch, English and German (Tables 3, 4, and 6). While the overall shape of the lemma and word form graphs is also the same in Basque, minor differences emerge in trisyllabic and longer items, which have a higher frequency as lemmas than as word forms.
It should finally be noted that the two token frequency graphs of Italian are fairly similar, with two minor differences (see Figure 8). In the first place, the graph depicting Italian I starts higher than that depicting Italian II. This is an immediate consequence of the much smaller sample size of Juilland and Traversa’s dictionary as compared to de Mauro et al.’s dictionary (see Table 1). This limited size generates a larger share of short words in language usage. In the second place, average word length is slightly higher in Italian II than in Italian I. Again, this may be indirectly attributed to the fact that de Mauro et al.’s dictionary is more inclusive than Juilland and Traversa’s.
3.3 Comparing type and token frequency effects
It transpires from the preceding analysis that type and token frequency give rise to disparate distributions in the majority of the languages in our sample. Whereas a monotonic decrease is observed in the token frequency count, the graphs of these languages peak at length 2 or 3 in the type frequency count. By implication, there is a certain degree of independence between type and token frequency. The two exceptional languages, viz. Basque and Finnish, reveal a unimodal distribution on both counts. Remarkably, the graphs of the two languages have a relatively similar shape. Simplifying somewhat, we may say that the type frequency graph is a token frequency graph displaced to the right. This suggests a certain degree of dependence between type and token frequency.
Despite the major difference in the type frequency distribution between Finnish and Basque on the one hand and the Indo-European languages on the other, there is a striking similarity in the frequency distributions: in all 10 languages, the type frequency graph starts lower, peaks lower, peaks later and tapers off later than the token frequency graph. We thus observe similarity alongside diversity. Of course, it would be illegitimate to generalize from the data of these 10 languages to all the languages of the world. However, what can be concluded from these findings is that different distributions may share certain critical features in common.
Which properties of the type and token frequency distributions bring about the difference between the two non-Indo-European and the eight Indo-European languages? As argued in the preceding subsections, monosyllabicity is the main culprit. Both Basque and Finnish show not only comparatively low token frequency rates but also an infinitesimal share of monosyllabic words in their lexicons. The difference between Basque/Finnish and the Indo-European languages resides primarily in the token frequency and secondarily in the type frequency of monosyllabic words. All Indo-European languages make use of monosyllabicity to an appreciably greater extent than Basque and Finnish do. The difference between the Indo-European and non-Indo-European languages is slightly less clear-cut in the type frequency count. Although most Indo-European languages have an appreciably higher rate of monosyllabic words than the two non-Indo-European languages, Italian I cannot be distinguished from Basque and Finnish. It may be that the radical nature of Juilland and Traversa’s dictionary is responsible for this quirk in the data.
3.4 Interim conclusion
All the languages examined have a good deal in common. The token frequency graphs invariably start higher than the type frequency graphs. Also in all 10 languages, disyllabic word types occur more often than monosyllabic word types. We thus observe a switch from token frequency rate being higher than type frequency rate, to token frequency rate being lower than type frequency rate at some point down the line. The location of the switch point varies from language to language. There is between-language variation in whether the type frequency graph slopes further up or goes down beyond length 2. The major difference between the eight Indo-European languages and the two non-Indo-European languages lies in whether the token frequency graph declines right from the start, as it does in the Indo-European languages, or rises from length 1 to length 2, as it does in Finnish and Basque. The decline leads to an intersection of the two graphs at or near length 2 whereas the rise leads to an intersection of the two graphs at or near length 3.
4 General discussion and a correlation analysis
The focus of this cross-linguistic study has been on the effects of type and token frequency on word length. The 10 languages under investigation display a high degree of uniformity but also one major disparity. The effect of type frequency on length can be captured by a unimodal distribution in all cases. The effect of token frequency on length is more variable. There is a preference for a monotonic decrease in frequency with increasing length in our data, but there is at present no basis for the claim that this preference holds world-wide. Thus, we acknowledge two different patterns in the analysis of token frequency effects, namely a graph which peaks at length 1 and another which peaks at length 2. A later peak is certainly possible, albeit unattested in our data.
We begin with a theoretical analysis of the commonalities among the 10 languages. The token frequency of monosyllabic words is always higher than their type frequency. There are two factors which jointly bring about this difference. The first is the obvious advantage of short words which require less cognitive and motor effort than long ones (compare MacDonald’s (2013) Easy First Principle). The second is connected to the fact that short words stand a relatively good chance of being function words, which are required as part of the process of structure building. Since these requirements have to be satisfied in every sentence, function words are needed more often than content words. This explains their elevated usage frequency, which always surpasses their type frequency. Short function words are at such an advantage that no single length class can reach this high level in the type frequency analysis. Thus, the peak of the type frequency graph invariably remains below the peak of the token frequency graph.
The fact that the type frequency graph not only peaks lower but also later than the token frequency graph results from the “shift” in the ratio of function to content words as length increases. Content words have of course a much higher type frequency than function words and this higher type frequency unfolds only after the short function words have been “left behind”, i.e. when the words have reached a certain length (typically, length 2 or 3). Once we are beyond the peak, the type frequency curve stays higher than the token frequency curve for all word lengths. This difference reflects Zipf’s Rank Frequency Law: the great majority of words are only seldom used (e.g. Piantadosi 2014). These words are of course the longer ones. This effect is so powerful that it begins “early” as we scan the graph from left to right, i.e. in words which are still relatively short.
A particularly “early” language is English, in which even disyllabic words have a lower token than type frequency. In Rumanian, type and token frequency rates are identical for disyllabic words. Finnish and Basque are “late” languages in the sense that type frequency rates begin to surpass token frequency rates only at length 3.
Our database is too slender to warrant the claim that the four effects just discussed are true for all languages. We prefer to regard these effects as candidates for universals in that the above explanation relies on the universal distinction between lexical and grammatical words which are expected to behave similarly in crucial respects across different languages.[7]
We proceed to an account of the major difference dividing the 10 languages into 2 sets. Why do the token frequency graphs of the 8 Indo-European languages decline monotonically whereas those of the 2 non-Indo-European languages do not? As shown above, the beginning of the type frequency graph does not neatly distinguish between the two sets. We hypothesize that the very low type frequency of monosyllabic words is a necessary, though not a sufficient condition for the emergence of a unimodal distribution. While it is logically possible that a low number of word types is used exceedingly often, it is more likely that token frequency increases with type frequency. However, type frequency is not the only factor in an account of the token frequency of monosyllabic words.
The simple observation is that monosyllabic words are less frequently used in Basque and Finnish than in the other languages. Why is this so? We will argue below that there is a correlation between the average length of word types and tokens as well as one between the rate of monosyllabic word types and the average word length in a given language. Finnish and Basque typify an aversion to short words. Naturally, this aversion is strongest in the shortest, i.e. monosyllabic words and lessens as words increase in size. For the sake of convenience, we reproduce the average length of words in the lexicon and in actual usage as well as the percentages of monosyllabic word types and tokens in the 10 languages in Table 12.
Average length of word types and tokens in the sample (lemma count).
| Language | Average length of | Percentage of | ||
|---|---|---|---|---|
| Word types | Word tokens | Monosyllabic types | Monosyllabic tokens | |
| Basque | 3.6 | 2.6 | 1.8 | 8.9 |
| Dutch | 3.3 | 1.6 | 5.3 | 61.2 |
| English | 2.5 | 1.4 | 16.0 | 73.0 |
| Finnish | 3.7 | 2.5 | 1.5 | 15.0 |
| French | 2.4 | 1.5 | 17.9 | 63.8 |
| German | 3.1 | 1.7 | 4.7 | 53.7 |
| Greek | 2.2 | 1.4 | 20.5 | 70.4 |
| Italian I | 3.3 | 2.0 | 1.7 | 44.8 |
| Italian II | 3.8 | 2.2 | 2.1 | 34.8 |
| Rumanian | 2.8 | 1.8 | 9.6 | 48.2 |
| Spanish | 3.1 | 1.8 | 2.1 | 50.3 |
To begin with, we calculated the correlations between any two of the four columns in Table 12. Let LTy(i) and LTo(i) denote the ith value of the average word length of types and tokens, and let MSTy(i) and MSTo(i) denote the rates of monosyllabic types and tokens. Comparing any two of the four columns in Table 12, we obtain the following six coefficients of linear correlation.
As can be seen, all six pairs are strongly correlated. As items (i) and (v) are the most relevant ones for our argument, we will study these two relations in more detail. From (4.1i) it follows that the data pairs (LTy(i), LTo(i)) are more or less tightly scattered around an increasing straight line (see Figure 11). The parameters a and b of the regression line
are determined by minimizing the squared deviations
resulting in
a = 0.6602, b = −0.1651.
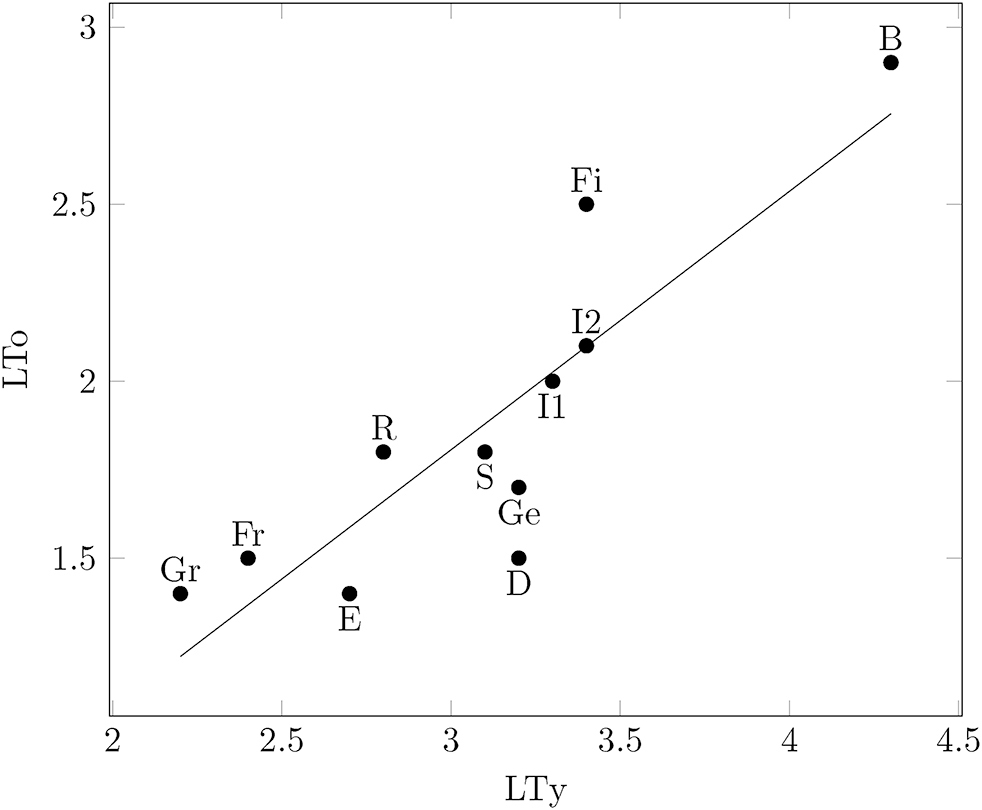
Average word token length as a function of average word type length.
The straight line in Figure 11 may be viewed as a theoretical relation between LTo and LTy, while the points represent observed values. The abbreviations (initials or first two letters) next to the data points identify the different languages. Table 13 compares the observed values of LTo with those computed by (4.2). In Rumanian, for instance, the observed value for token length is somewhat higher that the corresponding theoretical value of model (4.2).
Observed and computed values in increasing order of LTy.
| Average length of word types | Average length of word tokens | Relative error | ||
|---|---|---|---|---|
| Language | Observed LTy | Observed LTo | Computed 0.6602*LTy − 0.1651 |
|
| Greek | 2.2 | 1.4 | 1.29 | 0.09 |
| French | 2.4 | 1.5 | 1.42 | 0.06 |
| English | 2.5 | 1.4 | 1.49 | 0.06 |
| Rumanian | 2.8 | 1.8 | 1.68 | 0.07 |
| Spanish | 3.1 | 1.8 | 1.88 | 0.04 |
| German | 3.1 | 1.7 | 1.88 | 0.10 |
| Dutch | 3.3 | 1.6 | 2.01 | 0.20 |
| Italian I | 3.3 | 2.0 | 2.01 | 0.00 |
| Basque | 3.6 | 2.6 | 2.21 | 0.18 |
| Finnish | 3.7 | 2.5 | 2.28 | 0.10 |
| Italian II | 3.8 | 2.2 | 2.34 | 0.06 |
The last column of Table 13 reveals that the relative error rate is usually no greater than about 10% except for Basque (18%) and Dutch (20%).
We proceed to an examination of the relation between the average length of word tokens and the rate of monosyllabic tokens. From relation (4.1v) it follows that the data pairs (LTo(i), MSTo(i)) are very tightly scattered around a decreasing straight line (see Figure 12). For the parameters a and b of the regression line
we now obtain by minimizing the squared errors
a = −49.82, b = 140.5.
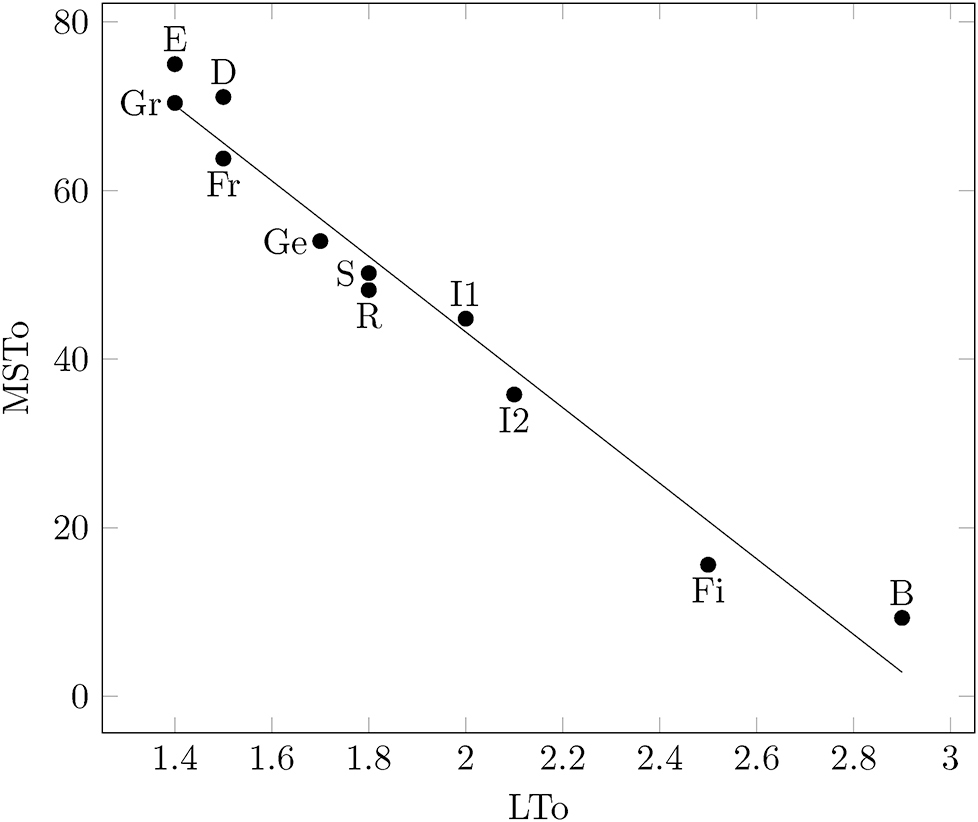
Rate of monosyllabic tokens as a function of average word token length.
Figure 12 shows that the linear model (4.3) provides an excellent fit to the relation between LTo and MSTo. Table 14 compares the observed values of MSTo with those computed by (4.3) in detail.
Observed and computed values in increasing order of LTo.
| Average length of word tokens | % monosyllabic tokens | Relative error | ||
|---|---|---|---|---|
| Language | Observed LTo | Observed MSTo | Computed −49.82*LTo + 140.5 |
|
| English | 1.4 | 73.0 | 70.8 | 0.03 |
| Greek | 1.4 | 70.4 | 70.8 | 0.05 |
| French | 1.5 | 63.8 | 65.8 | 0.03 |
| Dutch | 1.6 | 61.2 | 60.8 | 0.01 |
| German | 1.7 | 53.7 | 55.8 | 0.04 |
| Rumanian | 1.8 | 48.2 | 50.8 | 0.05 |
| Spanish | 1.8 | 50.3 | 50.8 | 0.01 |
| Italian I | 2.0 | 44.8 | 40.9 | 0.10 |
| Italian II | 2.2 | 34.8 | 30.9 | 0.13 |
| Finnish | 2.5 | 15.0 | 16.0 | 0.06 |
| Basque | 2.6 | 8.9 | 11.0 | 0.20 |
It is notable that the residuals (discrepancies between observed and computed monosyllabic tokens) are only relatively large in the case of Basque and Italian I and II (see the last column in Table 14). For all other languages, this error is always smaller than 7%.
As Table 12 indicates, the average length of Basque and Finnish word types as well as tokens is almost always higher than that of the word types and tokens in Indo-European. Only Italian II surpasses Basque and Finnish in the type frequency count, though not in the token frequency count. The similarity among these three languages in terms of average length of word types suggests that factors other than type frequency are at play in shaping the token frequency distribution.
The correlations in (4.1) allow us to argue that the average length of word types is one determinant of the average length of word tokens. Furthermore, a low rate of monosyllabic word types raises the probability of a unimodal distribution of the length of word tokens. The rate of monosyllabic tokens can be used to very clearly set off Basque and Finnish from the Indo-European languages. The rate of monosyllabic types generates similarly clear results, with one fly in the ointment. Italian I has a slightly lower percentage of monosyllabic word types than Basque (i.e. 1.7 vs. 1.8%). However, we maintain that it is more adequate to compare Basque (and Finnish) to Italian II, which is based on a representative rather than a radical frequency dictionary. Such a comparison reveals a difference between Finnish and Italian II (1.5 vs. 2.1). However, there is no denying that the rate of monosyllabicity is only one player in this game.
What other factors might impact on word length? Notably, we know a little about influences on word types, but next to nothing about influences on word tokens. It has repeatedly been claimed that word length is influenced by both lexicon size and phoneme inventory size (e.g. Strauss et al. 2005; Wimmer et al. 1994). The larger the lexicon and the smaller the number of phonemes, the longer the word types. We have seen evidence of an interaction of lexicon size and word length in the previous pages. The interaction of word length and the size of the phoneme system appears to be a robust effect (see Nettle 1995; Wichmann et al. 2011). The logic underlying the latter claim is that increased word length contributes to discouraging homonymy (Jespersen 1933). Thus, if phoneme inventory size was to have an effect on the length of word tokens, this effect could only arise through the intermediary of word types.
To further elucidate the role of length, we may briefly change perspective and return to Hatzigeorgiu et al.’s (2001) study of Greek, which measured length in terms of graphemes. As a matter of fact, if graphemes form the basis of the calculation of length, a monotonic incline of the curve is out of the question in a token frequency analysis. Specifically, no linguist would expect words consisting of a single grapheme to be used more frequently than two-grapheme words, which in turn would not be expected to be used more frequently than three-grapheme words etc. This is for the obvious reason that words must not be too short. There are probabilistic constraints on both the minimum and the maximum length of words. As has been repeatedly argued, both the role of the speaker and that of the listener need to be taken into account in an explanation of the quantitative patterns (e.g. Ferrer i Cancho and Solé 2003; Köhler 1986). Listeners require a minimum word length in order to reliably comprehend speakers’ output. Speakers, by contrast, prefer shorter words because these require less processing and articulatory effort. Hence, language in general and word length in particular are appropriately viewed as a compromise of meeting speakers’ and listeners’ conflicting needs.
Against this background, we may understand the difference between the Indo-European and the non-Indo-European languages in terms of the different weight that is assigned to speakers’ and listeners’ needs. The Indo-European languages in our study give more weight to speakers’ needs whereas Basque and Finnish accord more weight to listeners’ needs. More specifically, speakers strive for efficiency whereas listeners strive for accuracy. These principles are in competition with each other (see Kanwal et al. 2017 for experimental support). Some languages resolve this conflict in favour of accuracy while others give an edge to efficiency.
It remains to be discussed how type and token frequency are connected. The link, which was established through the correlation analysis, may be explained in the following manner. When a language has many monosyllabic word types, the probability of using these is higher than when a language has a low rate of monosyllabicity. Note that this is not necessarily so. However, the fact that speakers are biased towards selecting shorter words increases the probability of using these words when their number is larger. It should be emphatically reiterated that this effect of type frequency on token frequency is a probabilistic, not a categorical one.
Thus, to a certain extent, the type frequency distribution influences the token frequency distribution. What, then, determines the length of word types? The answer which immediately springs to mind implicates morphology. An agglutinating language is prone to generate longer words than an isolating one (Fenk-Oczlon and Fenk 1999). This reasoning can be successfully applied to the empirical data. Basque is a highly agglutinating language (Hualde and Ortis de Urbina 2003). So are Finnish (Abondolo 1998) and Mongolian (Poppe 2006) (see opening section). We are led therefore to postulate a link between morphological type and the unimodal distribution: agglutinating languages are more likely to show a unimodal distribution in language use than isolating (and fusional) languages are. This is a prediction that awaits a rigorous typological test. However, we hasten to add that morphological type is only one pertinent factor among others.[8] The case of Italian teaches us that a language need not be of the agglutinating type in order to boast long words. Moreover, it may very well be that a similar pattern will emerge in a representative dictionary of Greek. Which factors bring about the considerable length of words in these languages remains to be elucidated.
5 Conclusion
A great deal of previous research was devoted to studying the effect of token frequency on word length. The effect of type frequency on word length was largely neglected. One of the major aims of this study has been to redress the balance between type and token frequency effects on word length. This more comprehensive perspective reveals that type frequency is one determinant of token frequency (see also Berg 2014). It has allowed us to argue that the average length of words in the lexicon influences the distribution that emerges in word use. To be specific, languages with relatively short words tend to show a steady decrease in frequency with increasing length while languages with relatively long words evince a unimodal distribution.
All of the data that have been presented in this article can be accounted for by the joint operation of two principles—a dispreference for using long words and a dispreference for short words in the lexicon. The two principles vary in strength from language to language. How long or short words have to be in order to be disfavoured also varies from language to language. The first principle is claimed to hold for all the languages we have investigated. It accounts for the observation that from a particular word length on, token frequencies are always lower than type frequencies. Of course, this is an economical principle which harks back to Zipf’s (1949) Principle of Least Effort. Complementarily, the dispreference for using long words is accompanied by a preference for using short words. When short words are limited to monosyllabic items, this preference holds for all the languages in our sample. In this region, token frequencies are always higher than type frequencies.
This preference is seemingly at odds with the second principle which expresses a bias against short words and which, unlike the first principle, emerges in the lexicons of only some languages. However, this conflict is more apparent than real. While the first principle targets token frequency, the second targets type frequency. Since, as argued above, type frequency impacts on token frequency, the lower the rate of short words in the lexicon, the lower the probability of encountering these words in actual language use. We thus observe an intriguing conflict between two seemingly contradictory factors at the token frequency level—a preference as well as a dispreference for using short words. This conflict arises only in some languages in our sample. As the data in Table 12 above demonstrate, it is generally reconciled in favour of a preference for using short words. The percentage of monosyllabic tokens is between 5 times (Basque) and 26 times (Italian I) higher than the percentage of monosyllabic types.
References
Abondolo, Daniel. 1998. Finnish. In Daniel Abondolo (ed.), The Uralic languages, 149–183. London: Routledge.Suche in Google Scholar
Antic, Gordana, Ernst Stadlober, Peter Grzybek & Emmerich Kelih. 2006. Word length and frequency distributions. In Myra Spiliopoulou, Rudolf Kruse, Andreas Nürnberger & Christian Borgelt (eds.), From data and information analysis to knowledge engineering, 310–317. Heidelberg: Springer.10.1007/3-540-31314-1_37Suche in Google Scholar
Aoyama, Hideaki & John Constable. 1999. Word length frequency and distribution in English: Part I. Prose. Literary and Linguistic Computing 14. 339–358. https://doi.org/10.1093/llc/14.3.339.Suche in Google Scholar
Balschun, Claudia. 1997. Wortlängenhäufigkeiten in althebräischen Texten. Glottometrika 16. 174–179.Suche in Google Scholar
Bartels, Olaf & Michael Strehlow. 1997. Zur Häufigkeit von Wortlängen in deutschen Briefen im 19. Jahrhundert und in der ersten Hälfte des 20. Jahrhunderts. Glottometrika 16. 71–76.Suche in Google Scholar
Berg, Thomas. 2014. On the relationship between type and token frequency. Journal of Quantitative Linguistics 21. 199–222. https://doi.org/10.1080/09296174.2014.911505.Suche in Google Scholar
Best, Karl-Heinz. 1997. Wortlängen in mittelhochdeutschen Texten. Glottometrika 16. 40–54.Suche in Google Scholar
Best, Karl-Heinz & Gabriel Altmann. 1996. Project report. Journal of Quantitative Linguistics 3. 85–88. https://doi.org/10.1080/09296179608590067.Suche in Google Scholar
Best, Karl-Heinz & Paulina Medrano. 1997. Wortlängen in Ketschua-Texten. Glottometrika 16. 204–212.Suche in Google Scholar
Butterworth, Brian. 1983. Lexical representation. In Brian Butterworth (ed.), Language production, vol. 2, 257–294. London: Academic Press.Suche in Google Scholar
CELEX, R. Harald Baayen, Richard Piepenbrock & Leon Gulikers. 1995. The CELEX lexical database. Philadelphia, PA: Linguistic Data Consortium.Suche in Google Scholar
Content, Alain, Philippe Mousty & Monique Radeau. 1990. Brulex. Une base de données lexicales informatisée pour le français écrit et parlé. L’Année Psychologique 90. 551–566. https://doi.org/10.3406/psy.1990.29428.Suche in Google Scholar
De Mauro, Tullio, Federico Mancini, Massimo Vedovelli & Mariam Voghera. 1993. Lessico di frequenza dell’italiano parlato. Milano: Etaslibri.Suche in Google Scholar
Dittrich, Heike. 1996. Word length frequency in the letters of G.E. Lessing. Journal of Quantitative Linguistics 3. 260–264. https://doi.org/10.1080/09296179608599633.Suche in Google Scholar
Dressler, Wolfgang U. 1989. Prototypical differences between inflection and derivation. Zeitschrift für Phonetik, Sprachwissenschaft und Kommunikationsforschung 42. 3–10. https://doi.org/10.1515/stuf-1989-0102.Suche in Google Scholar
E-Hitz, Manuel Perea, Miriam Urkia, Colin J. Davis, Ainhoa Agirre, Edurne Laseka & Manuel Carreiras. 2006. E-Hitz: A word frequency list and a program for deriving psycholinguistic statistics in an agglutinating language (Basque). Behavior Research Methods 38. 610–615. https://doi.org/10.3758/bf03193893.Suche in Google Scholar
Fenk-Oczlon, Gertraud & August Fenk. 1999. Cognition, quantitative linguistics, and systemic typology. Linguistic Typology 3. 151–177. https://doi.org/10.1515/lity.1999.3.2.151.Suche in Google Scholar
Ferrer i Cancho, Ramon & Ricard V. Solé. 2003. Least effort and the origin of scaling in human language. Proceedings of the National Academy of Sciences 100. 788–791. https://doi.org/10.1073/pnas.0335980100.Suche in Google Scholar
Hatzigeorgiu, Nick, George Mikros & George Carayannis. 2001. Word length, word frequencies and Zipf’s law in the Greek language. Journal of Quantitative Linguistics 8. 175–185. https://doi.org/10.1076/jqul.8.3.175.4096.Suche in Google Scholar
Hualde, José Ignacio & Jon Ortiz de Urbina (eds.). 2003. A grammar of Basque. Berlin: Mouton de Gruyter.10.1515/9783110895285Suche in Google Scholar
Jespersen, Otto. 1933. Monosyllabism in English. In Selected writings of Otto Jespersen, 617–641. London: George Allen & Unwin.Suche in Google Scholar
Juilland, Alphonse, Dorothy Brodin & Catherine Davidovitch. 1970. Frequency dictionary of French words. The Hague: Mouton.Suche in Google Scholar
Juilland, Alphonse & Eugenio Chang-Rodriguez. 1964. Frequency dictionary of Spanish words. The Hague: Mouton.10.1515/9783112415467Suche in Google Scholar
Juilland, Alphonse, Prior Maximilian Hemsley Edwards & Ileana Juilland. 1965. Frequency dictionary of Rumanian words. The Hague: Mouton.10.1515/9783112415467Suche in Google Scholar
Juilland, Alphonse & Vincenzo Traversa. 1973. Frequency dictionary of Italian words. The Hague: Mouton.10.1515/9783110868937Suche in Google Scholar
Kanwal, Jasmeen, Kenny Smith, Jennifer Culbertson & Simon Kirby. 2017. Zipf’s law of abbreviation and the principle of least effort: Language users optimise a miniature lexicon for efficient communication. Cognition 165. 45–52. https://doi.org/10.1016/j.cognition.2017.05.001.Suche in Google Scholar
Köhler, Reinhard. 1986. Zur linguistischen Synergetik: Struktur und Dynamik des Lexikons. Bochum: Brockmeyer.Suche in Google Scholar
Kuhr, Saskia & Barbara Müller. 1997. Zur Wortlängenhäufigkeit in Luthers Briefen. Glottometrika 16. 55–62.Suche in Google Scholar
Lexiteria: Greek word frequency. 2010. Available at: https://lexiteria.com/word_frequency/greek_word_frequency_list.html.Suche in Google Scholar
Liberman, Isabelle Y., Donald Shankweiler, F. William Fischer & Bonnie Carter. 1974. Explicit syllable and phoneme segmentation in the young child. Journal of Experimental Child Psychology 18. 201–212. https://doi.org/10.1016/0022-0965(74)90101-5.Suche in Google Scholar
MacDonald, Maryellen C. 2013. How language production shapes language form and comprehension. Frontiers in Psychology 4. 1–16. https://doi.org/10.3389/fpsyg.2013.00226.Suche in Google Scholar
Narisong, Jingyang Jiang & Haitao Liu. 2014. Word length distribution in Mongolian. Journal of Quantitative Linguistics 21. 123–152. https://doi.org/10.1080/09296174.2014.882191.Suche in Google Scholar
Nettle, Daniel. 1995. Segmental inventory size, word length, and communicative efficiency. Linguistics 33. 359–367.Suche in Google Scholar
Piantadosi, Steven T. 2014. Zipf’s word frequency law in natural language: A critical review and future directions. Psychonomic Bulletin & Review 21. 1112–1130. https://doi.org/10.3758/s13423-014-0585-6.Suche in Google Scholar
Popescu, Ioan-Iovitz, Sven Naumann, Emmerich Kelih, Andrij Rovenchak, Haruko Sanada, Anja Overbeck, Reginald Smith, Radek Cech, Panchanan Mohanty, Andrew Wilson & Gabriel Altmann. 2013. Word length: Aspects and languages. In Reinhard Köhler & Gabriel Altmann (eds.), Issues in quantitative linguistics, vol. 3, 224–281. Lüdenscheid: RAM.Suche in Google Scholar
Poppe, Nikolas. 2006. Grammar of written Mongolian. Wiesbaden: Harrassowitz.Suche in Google Scholar
Rheinländer, Nicole. 2001. Die Wortlängenhäufigkeit im Niederländischen. In Karl-Heinz Best (ed.), Häufigkeitsverteilungen in Texten, 142–152. Göttingen: Peust & Gutschmidt.Suche in Google Scholar
Saukkonen, Pauli, Marjatta Haipus, Antero Niemikorpi & Helena Sulkala. 1979. Suomen kielen taajuussanasto. Porvoo: Werner Söderström Osakeyhtiö.Suche in Google Scholar
Smith, Reginald. 2012. Distinct word length frequencies: Distributions and symbol entropies. Glottometrics 23. 7–22.Suche in Google Scholar
Steiner, Petra. 2012. Relations with monosyllables: A view from quantitative linguistics. In Thomas Stolz, Nicole Nau & Cornelia Stroh (eds.), Monosyllables. From phonology to typology, 173–190. Berlin: Akademie Verlag.10.1524/9783050060354.173Suche in Google Scholar
Strauss, Udo, Peter Grzybek & Gabriel Altmann. 2005. Word length and word frequency. In Peter Grzybek (ed.), Contributions to the science of language, 277–294. Dordrecht: Springer.10.1007/978-1-4020-4068-9_13Suche in Google Scholar
Wang, Lu. 2013. Word length in Chinese. In Reinhard Köhler & Gabriel Altmann (eds.), Issues in quantitative linguistics, vol. 3, 39–53. Lüdenscheid: RAM.Suche in Google Scholar
Wei, Aiyun, Qian Lu & Haitao Liu. 2021. Word length distribution in Zhuang language. Journal of Quantitative Linguistics 28. 195–222.10.1080/09296174.2019.1678225Suche in Google Scholar
Wichmann, Søren, Taraka Ramo & Eric W. Holman. 2011. Phonological diversity, word length, and population size across languages: The ASJP evidence. Linguistic Typology 15. 177–197. https://doi.org/10.1515/lity.2011.013.Suche in Google Scholar
Wimmer, Gejza, Reinhard Köhler, Rüdiger Grotjahn & Gabriel Altmann. 1994. Towards a theory of word length distributions. Journal of Quantitative Linguistics 1. 98–106. https://doi.org/10.1080/09296179408590003.Suche in Google Scholar
Ziegler, Arne. 1996. Word length distribution in Brazilian Portuguese texts. Journal of Quantitative Linguistics 3. 73–79. https://doi.org/10.1080/09296179608590065.Suche in Google Scholar
Zipf, George K. 1949. Human behavior and the principle of least effort. Reading, MA: Addison-Wesley.Suche in Google Scholar
Zipf, George K. 1965 [1935]. The psycho-biology of language. An introduction to dynamic philology. Cambridge, MA: MIT Press.Suche in Google Scholar
© 2022 the author(s), published by De Gruyter, Berlin/Boston
This work is licensed under the Creative Commons Attribution 4.0 International License.
Artikel in diesem Heft
- Frontmatter
- Articles
- Herausforderungen und Perspektiven der Wortschreibung: Tarifit auf Facebook und das Standard-Amazigh im Vergleich
- Dekodierung der Implizitheit des wertenden Urteils in Komplimenten (am Beispiel der cross-kulturellen Analyse von Gesprächen in männlichen geschlechtshomogenen Gruppen)
- The effects of type and token frequency on word length: a cross-linguistic study
- Book Review
- Gerd Hentschel, Jolanta Tambor & István Fekete: Das Schlesische und seine Sprecher/Śląski lekt i jego użytkownicy. Etablierung in der Gesellschaft, Attitüden, Vitalität der Germanismen/Rozpowszechnienie, postawy społeczne wobec śląszczyzny, żywotność germanizmów w lekcie śląskim