The effect of retirement on social relationships
-
Simona Lorena Comi

 ,
Elena Cottini
,
Elena Cottini

Abstract
We analyze the causal effect of retirement on individual social relationships using data from the Survey of Health, Ageing and Retirement in Europe. We find that retirement changes the composition of the individual’s social network, inducing a substitution between weak (friends or colleagues) and strong ties (family), along with an increase in the intensity of the surviving ties, and there is no effect on the network’s size. These changes in the social network’s composition are associated with a higher satisfaction and stronger relationships. Interestingly, females reduce the share of friends while males that of colleagues.
1 Introduction
Over the life-cycle individuals rely on each other to perform a large number of social activities, whether it be interactions with colleagues at the workplace, spending leisure time with friends and other acquaintances, or exchanging information, affection and help with family members (Jackson and Zenou 2013). The ensemble of social relationships, henceforth referred to as social network (
People tend to maintain a core and stable network of social relationships that escorts them over the life course like a convoy (Antonucci 2001). In late adulthood, close core relationships remain stable, while peripheral relationships decrease in number. As individuals grow old, motivated by emotional goals, they narrow the size of their network selecting fewer relationships among the existing ones (Carstensen 1993; Carstensen et al. 2003). Thus, emotional involvement becomes higher, and this adjustment is actively sought after and not merely passively experienced. Multiple reasons might explain the decline in social network size and changes in its structure. Weak ties are shown to be very important in gathering new and useful information, for example during a job search, thus were believed to be as important as strong ones (Granovetter 1973). Lately, some studies have shown that weak ties are not more helpful than strong ties but are simply more numerous (Gee et al. 2017). Social ties, those with a weak link in particular, are at a constant risk of being discontinued, frequent interactions are an important condition for a relationship continuation, the lack of meeting opportunities might place a relationship at risk (Mollenhorst et al. 2014; Kleinbaum 2018). It has been demonstrated that preferences for similarity also play a role when individuals choose with whom staying in contact (Small 2017). Furthermore, ties that are well-embedded in one’s network have been found to be stronger and more stable over time (Feld et al. 2007), probably because they are more likely to guarantee social support (Bloch et al. 2008).
Sociologists, demographers and gerontologists have studied how social networks evolve over the life course, while economists have paid less attention to how an individual adjusts his or her network after major life events. Indeed, economic contributions are mainly theoretical, focusing on models of network link formation and dynamics (see for example Ehrhardt et al. 2006; Bisin and Verdier 2011; Jackson and Zenou 2013), the prescriptions of which are often tested in labs (see for example Falk and Kosfeld 2012). Empirical evidence gathered in real life is rare and mainly concentrated on economic decisions in early life, such as going to college (see for example Marmaros and Sacerdote 2006), or changing neighborough (see for example Barnhardt et al. 2017) or on the reverse channel, i. e., the impact of social networks on retirement and other outcomes, like health, well-being, employment etc.[1]
A huge bulk of literature has been devoted to study the effect of retirement on consumption patterns, lifestyles, as well as in the health status of individuals (see for example Banks et al. 1998; Coe and Zamarro 2011).[2] Less attention has been devoted to the relationship between retirement decisions and individuals’ social network. Nonetheless, retirement is a major life shock, a point in which free time hugely increases, thus time use, and other activities patterns could be rearranged (Gauthier and Smeeding 2003). Transitions out of the labor force at older ages may have the potential to induce large changes in social networks, because after retirement, the opportunity to meet new people and interact with colleagues diminishes, while there is more time to invest and strengthen existing relationships.
In this paper, we fill this gap and address two questions. The first is whether there is a causal effect of retirement on individuals’ social network or the changes that occur are simple correlations. Our contribution is to complement the available evidence from lab experiments and improve knowledge on social network dynamics of older individuals when they exit from the labor market. Empirical evidence from existing studies that address the endogeneity of retirement is rather mixed. Using an IV approach with cross-sectional data, Fletcher (2014) finds no evidence of changes in social network due to retirement, while Börsch-Supan and Schuth (2014) find a reduction in the size of the networks associated with retirement. Patacchini and Engelhardt (2016) instead use a longitudinal approach and show, for the US, that retirement significantly reduces the size of the networks for women and the more educated.[3] Since retirement decisions are likely to depend on (unobservable) individual characteristics and time-varying shocks affecting the decision to retire early, the empirical strategy should account for individual time-invariant effects and a quasi-random assignment strategy for the timing of retirement. To our knowledge, this is the first study that attempts to identify the causal effect of retirement on social network using both longitudinal data, controlling for individual fixed-effects, and an IV strategy. In particular, we focus on EU countries and exploit the panel dimension of the Survey of Health, Ageing, and Retirement in Europe (SHARE) with information on labor market status, network characteristics and a wide range of socioeconomic and demographic characteristics. We exploit the different retirement eligibility ages (early and ordinary retirement ages), by gender, cohort and country to instrument individuals’ retirement decisions (Coe and Zamarro 2011).
The second question we address is, should retirement have a causal effect on social network, what are the main changes that occur? We investigate this issue using a comprehensive set of indicators of social networks and documenting how its structure is affected by retirement. We start with size (number of ties in the network) and composition (family members or kin, friends, or colleagues). We then focus on the emotional quality of the ties. As suggested by Granovetter (1973), “the strength of a tie depends on the amount of time, the emotional intensity, the intimacy and the reciprocal services which characterize the tie” (1973:1361), thus we proxy the strength and intensity of the relationship using information about the frequency of contacts, geographical proximity and emotional closeness. We also document the heterogeneous patterns of the effect of retirement by gender. Finally, we suggest potential explanations as to why individuals change their network after retirement, by investigating association between retirement, homophily and informal insurance within the network.
Our results suggest that retirement causally affects social networks and induces substantial changes. In particular, even though our results suggest that the absolute size of the network does not change, we find that retirement causes a reorganization of the active relationships, increasing the share of family members and reducing the share of friends and colleagues. Network’s changes are also shown to be associated with higher satisfaction and higher emotional closeness, while contact frequency and proximity within the network take longer to unfold and display their effect later on. Overall, our findings suggest that the changes in the social network caused by retirement can be explained in terms of substitution between weak (friends or colleagues) and strong ties (family), along with an increase in the intensity of the surviving ties. Interestingly this substitution effect, between weak and strong ties, differs by gender: females reduce the share of friends, while males reduce the share of colleagues. Moreover, after retirement males tend to feel emotionally closer to the alters listed in their network, while females show higher closeness in terms of frequency of contacts and proximity. The above results are found to be robust to several specification changes. Finally, we provide suggestive evidence that the adjustment of social networks after retirement is accompanied by an increase in informal support, namely, an exchange of care within the network.
The remainder of this paper is organized as follows. In Section 2, we describe the data, and the measures of social network size, composition and intensity we use. We also provide some descriptive evidence about social network changes over time and around retirement. Section 3 illustrates our empirical strategy. The main results are reported in Section 4, while Section 5 concludes and discusses the policy implications.
2 Data and descriptive statistics
We use data from Release 6 of the fourth and sixth waves (2011 and 2015) of the Survey of Health, Ageing and Retirement in Europe (SHARE), a multidisciplinary and cross-national bi-annual household panel survey coordinated by the Munich Center for the Economics of Aging (MEA) with the technical support of CentERdata at Tilburg University. The survey collects detailed information on socio-economic status, health, social and family networks for nationally representative samples of elderly people in the participating countries. The target population consists of individuals aged more than 50 and their spouses or partners irrespectively of their age. We include in the analysis those countries for which social networks data are available both in wave 4 and 6.[4] Our working sample consists of people aged 50 to 70 at the time of their first interview, who classified themselves as employed, unemployed or retired, and participated to both wave 4 and 6 of SHARE and have valid information in all the relevant variables in both waves.[5] These selection criteria result in a balanced panel of 15,752 individuals, each interviewed twice. As it can be seen, in Panel A of Table 1, in the first wave around half of the sample is already retired. This figure increases of about 15 % four years later. Slightly more than a half of the individual in the sample are female, the average age is 60, it naturally increases by 4 years in the second wave, and two out of three individuals are married while one out of three has a tertiary degree.
Descriptive statistics.
| Variables | (1) | (2) |
| Wave four | Wave six | |
| Panel A: individual characteristics | ||
| Retired | 0.49 (0.49) | 0.64 (0.48) |
| Distance from retirement | 2.93 (4.44) | 5.14 (5.74) |
| Employed | 0.46 (0.50) | 0.33 (0.47) |
| Unemployed | 0.04 (0.20) | 0.03 (0.17) |
| Female | 0.54 (0.49) | 0.54 (0.49) |
| Age | 60,7 (5.56) | 64,7 (5.56) |
| Married | 0.72 (0.44) | 0.70 (0.46) |
| Tertiary degree | 0.32 (0.47) | 0.32 (0.47) |
| Panel B: Social relationships characteristics | ||
| Size | 2.74 (1.58) | 2.88 (1.57) |
| Share of family ties | 0.75 (0.32) | 0.78 (0.29) |
| Share of friends | 0.19 (0.29) | 0.17 (0.27) |
| Share of colleagues | 0.03 (0.11) | 0.02 (0.09) |
| SN satisfaction | 8.9 (1.22) | 9.0 (1.15) |
| Behaving close | 0.01 (0.99) | −0.01 (1) |
| Feeling close | −0.10 (1.01) | 0.10 (0.97) |
| Observations | 15,752 | 15,752 |
-
Notes: Standard deviations in parentheses.
2.1 Social network variables
In wave 4 and 6 SHARE gathered information about egocentric social networks for each individual using the “name generator” approach. Each respondent (the “ego”) was asked to name members (the “alters”) of his/her social network, using the following script:
“Now I am going to ask some questions about your relationships with other people. Most people discuss with others the good or bad things that happen to them, problems they are having, or important concerns they may have. Looking back over the last 12 months, who are the people with whom you most often discussed important things? These people may include your family members, friends, neighbors, or other acquaintances. Please refer to these people by their first names.”
Survey participants were permitted to list up to seven names and reported information about the type of relationship (spouse, child etc.), the strength (emotional closeness),[6] the frequency of the contact[7] and the physical proximity of the alters.[8] Demographic information about “the alters” were also gathered, mainly their gender and age. These data are known as egocentric social network data, and they are usually referred to as “discussion networks”. Using these variables, we characterize networks’ structure using the size (numbers of ties), the share of family members, the share of friends and the share of colleagues. Usually, affinal kin is not dissimilar from genetic kin in terms of contact frequency and emotional closeness (Burton-Chellew and Dunbar 2011), therefore, we consider both genetic and affinal kin as “family”.
To describe the intensity or strength of the network, we try to mimic its two main components as they are documented in the literature: the “feeling close” and the “behaving close” (Aron and Smollan 1992). In doing so, we proxy the first with emotional closeness and the latter with frequency of contact and geographical proximity. While frequency of contact is an indicator of engagement in relationship maintenance, the latter can be viewed as a proxy for the easiness of spending time together and doing activities together. In SHARE, the relationships associated with ties living in the same household of the ego are imputed a “daily” frequency of contact. As these characteristics are asked for each alter, to summarize them and capture any existing asymmetry in the distribution within each network, we computed the average value across alters, the percentage of alters with the highest value, and the percentage of the second to the highest and highest value. In doing so, we end up with 9 items, summarized in Table A1 in the Online Appendix, and run a principal component analysis. We kept the first two components, which are those with an eigenvalue greater than one (4.9 and 1.9 respectively). This model explains 76 % of the total variance. Each item is strongly associated with at least one component (see Table A2 in the Online Appendix). The first component loads items related to the frequency of contact and the geographical proximity, while the second component loads items related to how close the ego is with the alters listed in her/his network. Hence, we interpret each component as capturing “behaving close” and “feeling close” across alters within each network, and name them accordingly.
Panel B of Table 1 shows the size and composition of the networks. The size is rather small on average and slightly higher in the second wave. Family members and friends mainly compose these egocentrics networks. It seems that while the behaving close factor decreased over the four years, the feeling close increased significantly.[9]
Figure 1 shows the evolution of the social network structure and intensity for individuals who are aged between 50 and 74 years. It exhibits a moderate declining trend in network size, an increase of the share of family members, together with an increase in overall satisfaction and feeling close.
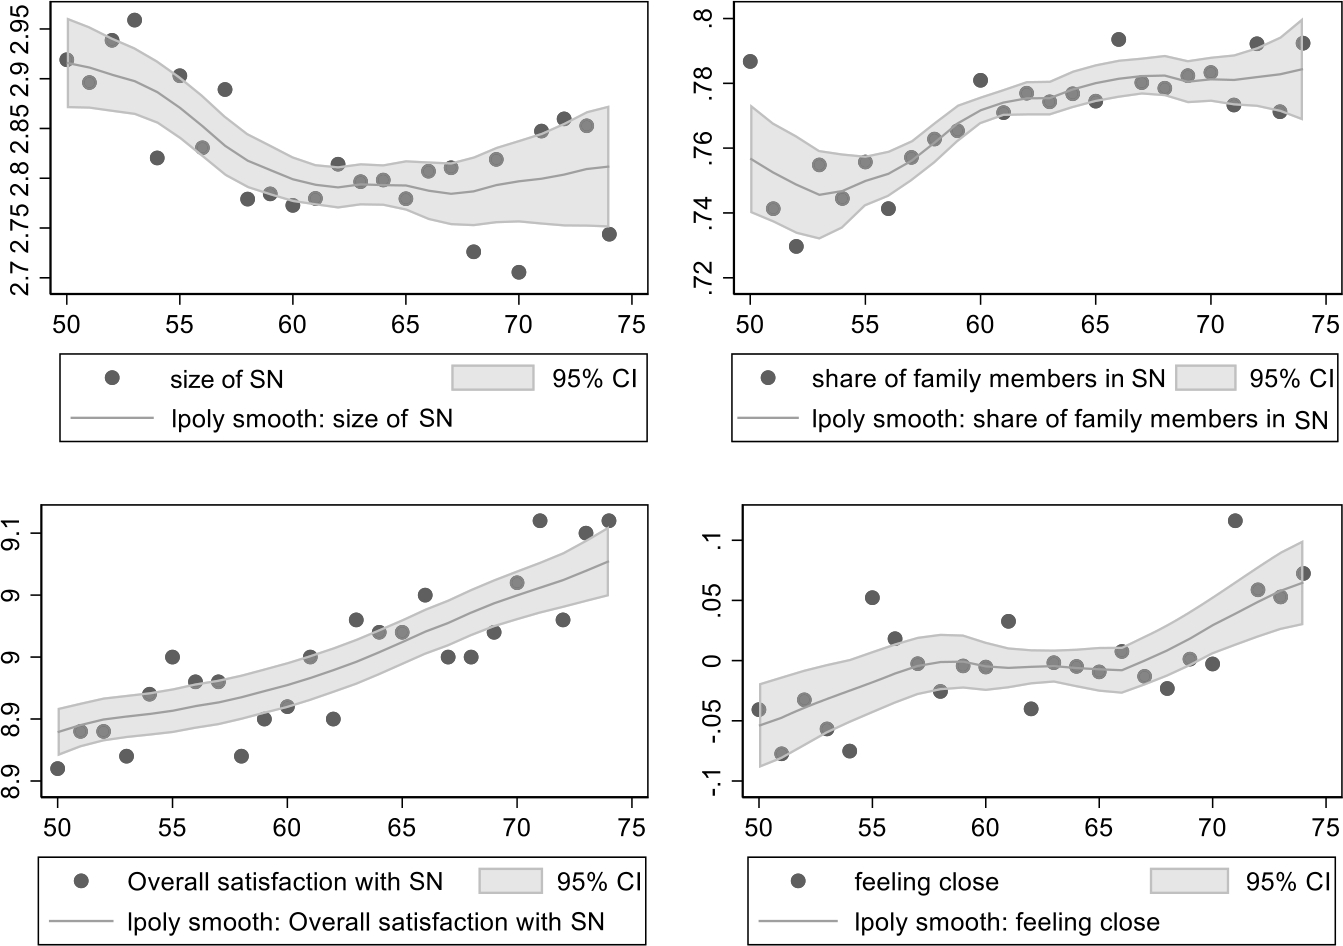
Evolution of Social Network composition and intensity in the late life (individuals aged 50 to 74).
3 Empirical strategy
Our empirical strategy uses the panel dimension of SHARE to control for individual time-invariant characteristics (such as gender, birth cohort, and level of education) and exploits institutional rules to replicate a quasi-random assignment of retirement decisions. In the baseline specification, we estimate the association between different dimensions of social networks and retirement status, as follows:
where
Notice that, estimating Equation (1) by OLS is likely to deliver biased coefficients due to the correlation between retirement choices and the unobservables. Indeed, not only time invariant individual unobservable characteristics, as personality traits, but also unobserved time varying factors, such as health shocks or informal care (Meng 2012) may be simultaneously correlated with the retirement decisions (
To address these problems, avoid the potential biases and estimate the causal effect of retirement on social relationships, we need an exogenous variation in the probability to retire. We follow the well-established literature on the effect of retirement on well-being outcomes and use the country specific age thresholds that determine the eligibility for early and normal retirement. Around these thresholds, the treatment, i. e., retirement, can be considered as good as randomly assigned, since age is a strictly exogenous characteristic. We are assuming that individuals below the thresholds represent a valid counterfactual for those above the thresholds.[10] We implement an empirical strategy that consists in FE-IV estimates.[11] We construct two instruments based on the legislated early and normal retirement ages. These are respectively the earliest age at which retirement benefits can be claimed, and the age at which the individual becomes eligible for full old-age pension. Specifically, we define two dummies that take value 1 if the individual age is above the gender-specific early retirement age, or normal retirement eligibility age in her country at the time of the interview (see the Appendix for details on retirement rules for the countries included in the analysis). Hence, our identification relies on the increase in the individual probability of retiring as individuals become eligible for pension benefits in their country of residence.[12] With this approach, we are estimating a Local Average Treatment Effect, and this means that our coefficients are identified on the subsample of individuals who comply with the age thresholds and retire once they pass through them (i. e., the so-called compliers, or those who retire because they become eligible). As usual, in estimating a LATE we are losing external validity, since our coefficients are valid only for compliers. Our baseline specification also includes country-specific linear trends in age, while standard errors are clustered at country-cohort-gender level.[13]
To disentangle the short-run adjustment and the long-run changes caused by retirement on social relationships, we also estimate a more flexible specification (see Equation (2) below). The first effect is captured by the Retired dummy, which identifies the effect of retiring. The second effect is captured by the DistR variable, which measures the longer-term adjustment proxied by number of years spent in retirement (i. e., from the date of the interview to the actual year of retirement and set to zero if the individual is not yet retired at wave t).
To estimate Equation (2), we use the same estimation methodology as before, though we now also need to instrument the DistR variable. By analogy we construct two instruments, as the positive distance between the actual age of individual i at time t and the eligibility ages for early and normal retirement that are relevant for individual i (Lucifora and Vigani 2018). Lastly, we explore the heterogeneous effect of retirement across gender. While social relationship is an important aspect of the ageing process for both sexes, men and women may react differently to retirement. Gender differences in social network’s characteristics for younger adults are documented in the literature, suggesting that women, who tend to report larger social networks compared to men, seem to exhibit slightly differently networks dynamics (Ajrouch et al. 2005).
4 Results
In this section we report the main results of the empirical analysis. Our baseline estimates of Equation (1) use a fixed-effect IV methodology to estimate the causal effect of retirement on several indicators of social network. We present the first-stage results, then we analyze the effect on network size and composition (Table 2), and finally we assess how satisfaction and closeness of social network are affected (Table 3). Using the same approach, we estimate the specification outlined in Equation (2) and compare the short-run adjustment, with the longer-run changes in social network (Table 4). Heterogeneity and Robustness checks are discussed next (Tables 5–8), and the suggestion and discussion of some potential mechanism closes this section.
Share of retirees by country – Male.
Share of retirees by country – female.
Figures 2 and 3 report the shares of retirees by country and gender with respect to early and ordinary retirement age thresholds. The age retirement profiles appear quite different across countries and gender. In many countries, the early retirement age threshold is lower for females, compared with males, which means that on average – conditional on social security contributions – females are eligible for retirement at an earlier age. First stage results show a sizable and statistically significant effect on retirement decisions. Instruments, based on early and normal pensions’ eligibility rules, are strong predictors of both the retirement dummy variable (Retired), as well as the variable on the number of years spent in retirement (DistR). Being older than statutory ages strongly affects the probability to retire (column 1, Table A5 in the Online Appendix).[14] Also, the distance from statutory early (normal) retirement age is negatively (positively) correlated with the probability of retiring and positively with the number of years spent in retirement (columns 2 and 3, Table A5).
Results from the second stage estimation are reported in Table 2.[15] We find no statistically significant effect of retirement on the size of the network (column 1). Conversely, retirement has a statistically significant positive effect on the share of family members in the network (column 2) and a negative effect on the share of friends and colleagues (columns 3 and 4). In terms of network composition, retirement increases by 7 % the share of family ties, while it reduces the share of friends and colleagues respectively by 4 % and 2 %. This pattern suggests that after retirement an immediate short-run reallocation of ties occurs, within the individual’s social network, from ‘weak’ to ‘strong’ ties (non-family versus family members). In other words, retired individuals seem to disengage from peripheral relationships, engaging more in core network relationships (i. e., family). While role-guided relationships, such as those with colleagues, can be important and affectionate, still they remain primarily tied to the role setting (i. e., the workplace) and survive only because of frequent interactions and meeting opportunities. This might limit them in terms of duration, strength and eventually emotional closeness (van Tilburg 2003).
Effect of retirement on social network structure. Fixed Effect IV estimates. 50–70.
| Variables | (1) | (2) | (3) | (4) |
| Size of the network | Share of family ties | Share of friends | Share of colleagues | |
| Retired | −0.0375 | 0.0719*** | −0.0397** | −0.0218*** |
| (0.147) | (0.0216) | (0.0200) | (0.0079) | |
| Observations | 31,504 | 31,504 | 31,504 | 31,504 |
| Number of ids | 15,752 | 15,752 | 15,752 | 15,752 |
| Country specific age trend | YES | YES | YES | YES |
-
Notes: *** p < 0.01, ** p < 0.05, * p < 0.1. Clustered Standard Errors by cohort-country-gender in parentheses.
In Table 3, we explore the effect of retirement on social network’s intensity. We find that, together with the changes in the composition of the network described above, retirement is also positively associated with an overall increase in satisfaction with the network (column 1) and in relationship intensity in terms of closeness (column 3). No effect is detected instead in terms of contact frequency and proximity – i. e., the behaving close factor (column 2).[16]
Our results might also explain the internal reallocation towards family ties, previously observed, which means that having more supportive and more emotionally connected people in the network might boost overall satisfaction (Lansford et al. 1998; Charles and Piazza 2007; Fingerman et al. 2004; Baetschmann 2014).
In Table 4, we report estimates from the more flexible specification that also includes a variable on the number of years spent in retirement (Equation (2)). The estimated short-run effects of retirement status (Retired dummy) are unchanged, in terms of magnitude and statistical significance, while the long-term adjustment, captured by the number of years since retirement (DistR variable), shows a negative and statistically significant association only with the behaving close factor (column 5). Overall, these results suggest that, short after retirement, individuals reallocate their social network ties towards family and away from friends and colleagues, and that they are more satisfied and have higher emotional intensity from the surviving ties. Conversely, contact frequency and proximity within the network (i. e., the behaving close factor) take longer to unfold and display their effect later on. Similar results have been documented in the literature for adults aged less than 85, while contact frequency will start to increase later on in life, when health begins to decline and the need for helpers and higher support increases (van Tilburg 1998).
Effect of retirement on social network intensity. Fixed Effect IV estimates. 50–70.
| Variables | (1) | (2) | (3) |
| Overall satisfaction | Behaving close | Feeling close | |
| Retired | 0.197** | 0.0863 | 0.154* |
| (0.0986) | (0.108) | (0.0847) | |
| Observations | 31,504 | 31,504 | 31,504 |
| Number of ids | 15,752 | 15,752 | 15,752 |
| Country specific age trend | YES | YES | YES |
-
Notes: *** p < 0.01, ** p < 0.05, * p < 0.1. Clustered Standard Errors by cohort-country-gender in parentheses.
Effect of retirement on social network (short- long-term effect). Fixed Effect IV estimates. 50–70.
| Variables | (1) | (2) | (3) | (4) | (5) | (6) | (7) |
| Size of the network | Share of family ties | Share of friends | Share of colleagues | Overall satisfaction | Behaving close | Feeling close | |
| Retired | −0.0519 | 0.0637*** | −0.0314 | −0.0182** | 0.174* | 0.101 | 0.135* |
| (0.138) | (0.0215) | (0.0201) | (0.00782) | (0.0987) | (0.0970) | (0.0822) | |
| DistR | 0.00995 | −0.00216 | 0.00134 | 0.000362 | −0.00243 | −0.019*** | −0.000876 |
| (0.0112) | (0.0022) | (0.0017) | (0.0007) | (0.00766) | (0.0058) | (0.0072) | |
| Observations | 31,504 | 31,504 | 31,504 | 31,504 | 31,504 | 31,504 | 31,504 |
| Number of ids | 15,752 | 15,752 | 15,752 | 15,752 | 15,752 | 15,752 | 15,752 |
| Country specific age trend | YES | YES | YES | YES | YES | YES | YES |
-
Notes: *** p < 0.01, ** p < 0.05, * p < 0.1. Clustered Standard Errors by cohort-country-gender in parentheses.
Effect of Retirement on social network, by gender. Fixed Effect IV estimates. 50–70.
| Variables | (1) | (2) | (3) | (4) | (5) | (6) | (7) |
| Size of the network | Share of family ties | Share of friends | Share of colleagues | Overall satisfaction | Behaving close | Feeling close | |
| Retired *Male | 0.0690 | 0.0768*** | −0.0300 | −0.034*** | 0.184 | −0.00818 | 0.216** |
| (0.187) | (0.0285) | (0.0249) | (0.0091) | (0.118) | (0.123) | (0.0881) | |
| Retired *Female | −0.186 | 0.0629*** | −0.0425** | −0.0101 | 0.227** | 0.201** | 0.0663 |
| (0.144) | (0.0214) | (0.0214) | (0.0075) | (0.113) | (0.102) | (0.0926) | |
| Observations | 31,504 | 31,504 | 31,504 | 31,504 | 31,504 | 31,504 | 31,504 |
| Number of ids | 15,752 | 15,752 | 15,752 | 15,752 | 15,752 | 15,752 | 15,752 |
| Country specific age trend | YES | YES | YES | YES | YES | YES | YES |
-
Notes: *** p < 0.01, ** p < 0.05, * p < 0.1. Clustered Standard Errors by cohort-country-gender in parentheses.
Does the evidence shown so far differ across gender?[17] Table 5 replicates results from the baseline specification by gender – i. e., interacting the Retired dummy with both a male and female dummy – on our indicators of social network’s size and composition (columns 1 to 4) as well as intensity (columns 5 to 7).[18]
The lack of any effect of retirement on network size is confirmed both for males and females, as it is the (positive) effect on the share of family members relative to the (negative) effect on the share of friends and colleagues. Interestingly, the substitution between weak and strong ties upon retirement takes a different form by gender: females reduce friends, while males mainly lose colleagues (column 3 and 4, respectively). The effect on satisfaction with the social network (column 5) seems to be entirely driven by females (i. e., for males it positive but not statistically significant). In line with previous finding in the literature, we also detect differences in social network behavior between men and women. As far as emotional intensity is concerned, males tend to feel closer to their alters after retirement, while females tend to behave closer (columns 6 and 7, respectively). The continuity of social roles and routines that characterizes the behavior of males, particularly in late life, makes them more likely to maintain previous schedules also after retirement (Barer 1994). Furthermore, when gender roles are traditional, men tend to invest more in professional relationships, and invest less in social ties (Smith-Lovin and McPherson 1993; Kalmijn 2012). With retirement the first tie is dissipated, leaving men more time to invest emotionally in family ties (Rusbult et al. 1998). Conversely, after retirement the likelihood of being informal homecare providers increases substantially more for women than for men, this might explain why the frequency of contact towards family members increases for females and remains stable for males (Eurostat 2019).
We present two robustness checks. First, we check the sensitivity of our results with respect to the specification of the running variable (see Table 6). Since a linear-in-age specification for the running variable may be overly restrictive, we replace it with a more flexible specification that includes country specific age squared trends. Results from this exercise are qualitatively unchanged both in coefficient size and statistical significance.
Effect of Retirement on social network, alternative specification. Fixed Effect IV estimates. 50–70.
| Variables | (1) | (2) | (3) | (4) | (5) | (6) | (7) |
| Size of the network | Share of family ties | Share of friends | Share of colleagues | Overall satisfaction | Behaving close | Feeling close | |
| Retired | −0.026 | 0.0636*** | −0.0391* | −0.020** | 0.164* | 0.0522 | 0.147* |
| (0.146) | (0.0209) | (0.0200) | (0.0079) | (0.0993) | (0.106) | (0.0867) | |
| Observations | 31,504 | 31,504 | 31,504 | 31,504 | 31,504 | 31,504 | 31,504 |
| Number of ids | 15,752 | 15,752 | 15,752 | 15,752 | 15,752 | 15,752 | 15,752 |
| Country specific age trend | YES | YES | YES | YES | YES | YES | YES |
| Country specific age squared trend | YES | YES | YES | YES | YES | YES | YES |
| Individual fixed effect | YES | YES | YES | YES | YES | YES | YES |
-
Notes: *** p < 0.01, ** p < 0.05, * p < 0.1. Clustered Standard Errors by cohort-country-gender in parentheses.
Effect of Retirement on social network. Fixed Effect IV estimates and IPW Fixed Effect IV. 50–70.
| Variables | (1) | (2) | (3) | (4) | (5) | (6) | (7) |
| Size of the network | Share of family ties | Share of friends | Share of colleagues | Overall satisfaction | Behaving close | Feeling close | |
| Panel A: Baseline regression | |||||||
| Retired | −0.0375 | 0.0719*** | −0.0397** | −0.0218*** | 0.197** | 0.0860 | 0.153* |
| (0.147) | (0.0216) | (0.0200) | (0.008) | (0.0986) | (0.107) | (0.0841) | |
| Observations | 31,504 | 31,504 | 31,504 | 31,504 | 31,504 | 31,504 | 31,504 |
| Number of ids | 15,752 | 15,752 | 15,752 | 15,752 | 15,752 | 15,752 | 15,752 |
| Country specific age trend | YES | YES | YES | YES | YES | YES | YES |
| Panel B: Weighted regression | |||||||
| Retired | −0.0340 | 0.0711*** | −0.0388* | −0.0219*** | 0.200** | 0.0860 | 0.154* |
| (0.145) | (0.0215) | (0.0199) | (0.00797) | (0.0986) | (0.107) | (0.0838) | |
| Observations | 31,504 | 31,504 | 31,504 | 31,504 | 31,504 | 31,504 | 31,504 |
| Number of ids | 15,752 | 15,752 | 15,752 | 15,752 | 15,752 | 15,752 | 15,752 |
| Country specific age trend | YES | YES | YES | YES | YES | YES | YES |
-
Notes: *** p < 0.01, ** p < 0.05, * p < 0.1. Clustered Standard Errors by cohort-country-gender in parentheses.
Second, because attrition has been acknowledged as a potential problem in SHARE data (Börsch-Supan and Jürges 2005), we investigated whether nonrandom attrition may be a source of bias. Notice that our FE strategy can already control for panel attrition that originates from time-invariant characteristics (Wooldridge 2010). As a further robustness check, we use an inverse probability weighting approach (Lucifora and Vigani 2018) to check for the presence of attrition bias.[19] Table 7 compares the unweighted and the weighted estimates and shows that they are very similar. We thus conclude that unobservable factors driving the attrition process may not strongly correlate with our outcomes and key independent variables.
Effect of Retirement on informal care exchange (short- long-term effect). Fixed Effect IV estimates. 50–70.
| (1) | (2) | (3) | |
| Financial help received | Gift received | Care received | |
| Retired | −0.0116 | 0.00170 | −0.00859 |
| (0.00824) | (0.00218) | (0.0179) | |
| DistR | −2.06e-05 | 0.000136 | 0.00626*** |
| (0.000594) | (0.000190) | (0.00128) | |
| Observations | 31,504 | 31,504 | 31,504 |
| Number of ids | 15,752 | 15,752 | 15,752 |
| Country specific age trend | YES | YES | YES |
-
Notes: *** p < 0.01, ** p < 0.05, * p < 0.1. Clustered Standard Errors by cohort-country-gender in parentheses.
Finally, we suggest a potential motivation associated with the changes in social networks caused by retirement:[20] the increasing need for informal support as individuals age, which may be obtained within the network. Individual may prepare themselves around retirement, and adjust their networks accordingly, and we may find that retirement also affects the probability of receiving financial aid, gifts, and care within the network. To explore these associations, we exploit the information provided by SHARE data about the intensity of financial aid, gift and care provision within the network and compute the percentage of ties that provide such supports and estimate the effect of retirement on these variables. We estimate Equation (2) including both the dummy Retired, to capture the short-run adjustment, and the variable DistR, to estimate the long-run changes caused by retirement on the provision of support. As dependent variables we use the probability of receiving financial aid, gifts, and care. Results (in Table 8, columns 1–3) show that the probability of receiving informal care increases as years are spent in retirement (DistR), while it is not immediately affected upon retirement (Retired). We interpret this result as a suggestion that the substitution of nonfamily ties with family ones may be actively sought around retirement by forward looking individuals who anticipate a greater need for care they expect to need in the future. The exchange of financial aid and gift is not affected by retirement.
5 Conclusions
In this paper, we address two research questions. First, we investigate whether there exists a causal effect of retirement on social network, and second how the composition and intensity of the social network change when individuals exit from the labour market upon retirement. We find that retirement decisions do affect individuals’ choice of social network mainly in terms of composition and intensity of contacts, while we find no evidence on social network size. In particular, the main changes involve an increase in the share of family members, and a lower share of colleagues and friends. Moreover, we show that these changes are associated with a higher overall satisfaction and stronger and more intense emotional relationships, especially in terms of a higher feeling of closeness with alters in the network.
We interpret the above findings as indication of a substitution between weak (friends or colleagues) and strong ties (family), along with an increase in the intensity of the relationship with the surviving ties. Interestingly, this substitution appears to occur differently by gender. Females reduce the share of friends, while males that of colleagues. Moreover, in terms of intensity of the surviving ties, males, after retirement, feel closer to their alters in the social network, while females increase the frequency of contacts and the proximity with their alters. These effects mostly occur in the short run after retirement, while only contact frequency and proximity within the network take longer to unfold, as years spent in retirement pass by. Finally, we show that the changes documented in the structure of social networks are associated with an increase in informal care provided inside the social network.
A final consideration concerns the policy implications of our research. Results show that retirement does not alter social network’s size, the main effect is in terms of reallocation of core network ties towards family members, along with a higher intensity of the surviving relationships. The absence of major changes in the size of individual’s social network seem to suggest that, after retirement, individuals quickly adjust to the new situation, modifying their network to increase the perceived quality of their social network, probably anticipating a greater need for informal care. In this respect, more formal welfare assistance to people’s social needs upon retirement could prove beneficial to support individuals’ demand for greater care in the transition from work to non-employment, also reducing the load on informal care within the family network. Future research should try to better understand whether the coping strategies we have highlighted in our research are also likely to be effective in the longer run, especially for those individuals that are isolated or become isolated with age. Another open question left unanswered by our research is how the substitution between weak and strong ties does impact on the wellbeing of the individual over the ageing process.
Funding source: Università Cattolica del Sacro Cuore
Award Identifier / Grant number: D 3.2 HALM
Funding statement: The authors are grateful to Università Cattolica del Sacro Cuore which contributed to the funding of this research project (with the project D 3.2 HALM).
Acknowledgements
We thank participants at the following workshops and conferences for their useful comments: Healthy Ageing and the Labour Market Workshop at Catholic University Milan in 2015; AIEL Conference, Ancona, 2018; ICEE Conference, Lecce, 2019; HEMAW Workshop at Catholic University in Rome, 2019. All remaining errors are ours. This paper uses data from SHARE Waves 4 and 6. The SHARE data collection has been funded by the European Commission through FP5 (QLK6-CT-2001-00360), FP6 (SHARE-I3: RII-CT-2006-062193, COMPARE: CIT5-CT-2005-028857, SHARELIFE: CIT4-CT-2006-028812), FP7 (SHARE-PREP: GA N° 211909, SHARE-LEAP: GA N° 227822, SHARE M4: GA N° 261982) and Horizon 2020 (SHARE-DEV3: GA N° 676536, SERISS: GA N° 654221) and by DG Employment, Social Affairs & Inclusion. Additional funding from the German Ministry of Education and Research, the Max Planck Society for the Advancement of Science, the U.S. National Institute on Aging (U01_AG09740-13S2, P01_AG005842, P01_AG08291, P30_AG12815, R21_AG025169, Y1-AG-4553-01, IAG_BSR06-11, OGHA_04-064, HHSN271201300071C) and from various national funding sources is gratefully acknowledged (see www.share-project.org).
References
Ajrouch, K., A. Blandon, and T. Antonucci. 2005. “Social Networks Among Men and Women: The Effects of Age and Socioeconomic Status.” Journal of Gerontology: Social Sciences 60: S311–S317. 10.1093/geronb/60.6.S311Suche in Google Scholar
Antonucci, T. C. 2001. “Social Relations: an Examination of Social Networks, Social Support, and Sense of Control.” Fifth ed. In Handbook of the Psychology of Aging, edited by J. E. Birren and K. W. Schaie, 427–453. San Diego, California: Academic Press. Suche in Google Scholar
Aron, E., and D. Smollan. 1992. “Inclusion of Other in the Self-scale and the Structure of Interpersonal Closeness.” Journal of Personality and Social Psychology 63: 596–612. 10.1037/0022-3514.63.4.596Suche in Google Scholar
Baetschmann, G. 2014. “Heterogeneity in the Relationship Between Happiness and Age: Evidence from the German Socio-Economic Panel.” German Economic Review 15: 393–410. 10.1111/geer.12015Suche in Google Scholar
Barnhardt, S., E. Field, and R. Pande. 2017. “Moving to Opportunity or Isolation? Network Effects of a Randomized Housing Lottery in Urban India.” American Economic Journal: Applied Economics 9(1): 1–32. 10.3386/w21419Suche in Google Scholar
Banks, J., R. Blundell, and S. Tanner. 1998. “Is There a Retirement-savings Puzzle?” American Economic Review 88(4): 769–788. Suche in Google Scholar
Barer, B. 1994. “Men and Women Aging Differently.” International Journal of Aging and Human Development 38: 29–40. 10.2190/MCH0-VTER-DL6G-LECRSuche in Google Scholar
Bayer, P., S. Ross, and G. Topa. 2008. “Place of Work and Place of Residence: Informal Hiring Networks and Labor Market Outcomes.” Journal of Political Economy 116(6): 1150–1196. 10.3386/w11019Suche in Google Scholar
Bisin, A., and T. Verdier. 2011. “The Economics of Cultural Transmission and Socialization.” In Handbook of Social Economics, edited by J. Benhabib, A. Bisin, and M. Jackson. Vol. 1A, 339–416. Netherlands: North-Holland. 10.1016/B978-0-444-53187-2.00009-7Suche in Google Scholar
Bloch, F., G. Genicot, and D. Ray. 2008. “Informal Insurance in Social Networks.” Journal of Economic Theory 143(1): 36–58. 10.1016/j.jet.2008.01.008Suche in Google Scholar
Börsch-Supan, A., and H. Jürges. 2005. The Survey of Health, Aging, and Retirement in Europe – Methodology. Mannheim, Germany: Mannheim Research Institute for the Economics of aging (MEA). Suche in Google Scholar
Börsch-Supan, A., and M. Schuth. 2014. “Early Retirement, Mental Health, and Social Networks.” In Discoveries in the Economics of Aging, 225–250. National Bureau of Economic Research. 10.7208/chicago/9780226146126.003.0007Suche in Google Scholar
Bowling, A., M. Farquhar, and P. Browne. 1991. “Life Satisfaction and Associations with Social Network and Support Variables in Three Samples of Elderly People.” International Journal of Geriatric Psychiatry 6(8): 549–566. 10.1002/gps.930060803Suche in Google Scholar
Brown, W. M., N. S. Consedine, and C. Magai. 2005. “Altruism Relates to Health in an Ethnically Diverse Sample of Older Adults.” The Journals of Gerontology: Series B 60(3): 143–152. 10.1093/geronb/60.3.P143Suche in Google Scholar
Burton-Chellew, M. N., and R. I. M. Dunbar. 2011. “Are Affines Treated as Biological Kin?” Current Anthropology 52(5): 741–746. 10.1086/661288Suche in Google Scholar
Calvó-Armengol, A., and M. Jackson. 2004. “The Effects of Social Networks on Employment and Inequality.” American Economic Review 94(3): 426–454. 10.1257/0002828041464542Suche in Google Scholar
Carstensen, L. 1993. “Motivation for Social Contact Across the Life Span: a Theory of Socioemotional Selectivity.” In Nebraska Symposium on Motivation, edited by J. Jacobs. Vol. 40, 209–254. Lincoln, Nebraska: University of Nebraska Press. Suche in Google Scholar
Carstensen, L. L., H. H. Fung, and S. T. Charles. 2003. “Socioemotional Selectivity Theory and the Regulation of Emotion in the Second Half of Life.” Motivation and Emotion 27(2): 103–123. 10.1023/A:1024569803230Suche in Google Scholar
Charles, S. T., and J. R. Piazza. 2007. “Memories of Social Interactions: Age Differences in Emotional Intensity.” Psychology and Aging 22: 300–309. 10.1037/0882-7974.22.2.300Suche in Google Scholar
Coe, N., and G. Zamarro. 2011. “Retirement Effects on Health in Europe.” Journal of Health Economics 30(1): 77–86. 10.7249/WR588Suche in Google Scholar
Duflo, E., and E. Saez. 2003. “The Role of Information and Social Interactions in Retirement Plan Decisions: Evidence from a Randomized Experiment.” Quarterly Journal of Economics 118(3): 815–842. 10.3386/w8885Suche in Google Scholar
Ehrhardt, G., M. Marsili, and F. Vega-Redondo. 2006. “Diffusion and Growth in an Evolving Network.” International Journal of Game Theory 34(3): 383–397. 10.1007/s00182-006-0025-6Suche in Google Scholar
Eurostat. 2019. Ageing in Europe. Looking at the lives of older people in the EU. Suche in Google Scholar
Falk, A., and M. Kosfeld. 2012. “It’s All About Connections: Evidence on Network Formation.” Review of Network Economics 1(3): 1–36. 10.1515/1446-9022.1402Suche in Google Scholar
Feld, S., J. Suitor, and J. G. Hoegh. 2007. “Describing Changes in Personal Networks over Time.” Field Methods 19(2): 218–236. 10.1177/1525822X06299134Suche in Google Scholar
Fingerman, K., E. Hay, and K. Birditt. 2004. “The Best of Ties, the Worst of Ties: Close, Problematic, and Ambivalent Social Relationships.” Journal of Marriage and Family 66: 792–808. 10.1111/j.0022-2445.2004.00053.xSuche in Google Scholar
Fletcher, J. 2014. “Late Life Transitions and Social Networks: The Case of Retirement.” Economics Letters 125(3): 459–462. 10.1016/j.econlet.2014.10.004Suche in Google Scholar
Gauthier, A., and T. Smeeding. 2003. “Time Use at Older Ages: Cross-national Differences.” Research on Aging 25(3): 247–274. 10.1177/0164027503025003003Suche in Google Scholar
Gee, L. K., J. J. Jones, C. J. Fariss, M. Burke, and J. H. Fowler. 2017. “The Paradox of Weak Ties in 55 Countries.” Journal of Economic Behavior & Organization 133: 362–372. 10.1016/j.jebo.2016.12.004Suche in Google Scholar
Granovetter, M. 1973. “The Strength of Weak Ties.” The American Journal of Sociology 78(6): 1360–1380. 10.1086/225469Suche in Google Scholar
House, J., D. Umberson, and K. Landis. 2003. “Structures and Processes of Social Support.” Annual Review of Sociology 14: 293–318. 10.1146/annurev.so.14.080188.001453Suche in Google Scholar
Ikkink, K., and T. van Tilburg. 1999. “Broken Ties: Reciprocity and Other Factors Affecting the Termination of Older Adults’ Relationships.” Social Networks 21: 131–146. 10.1016/S0378-8733(99)00005-2Suche in Google Scholar
Jackson, M., and A. Watts. 2002. “The Evolution of Social and Economic Networks.” Journal of Economic Theory 106(2): 265–295. 10.1006/jeth.2001.2903Suche in Google Scholar
Jackson, M., and Y. Zenou. 2013. Economic Analyses of Social Networks, Northampton, MA: Edward Elgar Publishing. 10.4337/9781784710354Suche in Google Scholar
Kalmijn, M. 2012. “Longitudinal Analyses of the Effects of Age, Marriage, and Parenthood on Social Contacts and Support.” Advances in Life Course Research 17(4): 177–190. 10.1016/j.alcr.2012.08.002Suche in Google Scholar
Kleinbaum, A. M. 2018. “Reorganization and Tie Decay Choices.” Management. Science 64(5): 1975–2471. 10.1287/mnsc.2016.2705Suche in Google Scholar
Lansford, J. E., A. M. Sherman, and T. C. Antonucci. 1998. “Satisfaction with Social Networks: An Examination of Socioemotional Selectivity Theory Across Cohorts.” Psychology and Aging 13(4): 544–552. 10.1037/0882-7974.13.4.544Suche in Google Scholar
Litwin, H., and A. Tur-Sinai. 2015. “The Role of the Social Network in Early Retirement Among Older Europeans.” Work, Aging and Retirement 1(4): 340–349. 10.1093/workar/wav013Suche in Google Scholar
Lucifora, C., and D. Vigani. 2018. “Health Care Utilization at Retirement: The Role of the Opportunity Cost of Time.” Health Economics 27(12): 2030–2050. 10.1002/hec.3819Suche in Google Scholar
Marmaros, D., and B. Sacerdote. 2006. “How Do Friendships Form?” The Quarterly Journal of Economics 121(1): 79–119. 10.1093/qje/121.1.79Suche in Google Scholar
Meng, A. 2012. “Informal Caregiving and the Retirement Decision.” German Economic Review 13: 307–330. 10.1111/j.1468-0475.2011.00559.xSuche in Google Scholar
Mollenhorst, G., B. Volker, and H. Flap. 2014. “Changes in Personal Relationships: How Social Contexts Affect the Emergence and Discontinuation of Relationships.” Social Networks 37: 65–80. 10.1016/j.socnet.2013.12.003Suche in Google Scholar
Montgomery, J. 1991. “Social Networks and Labor-Market Outcomes: Toward and.” Economic Analysis. American Economic Review 81(5): 1408–1418. Suche in Google Scholar
Patacchini, E., and G. Engelhardt. 2016. Work, Retirement, and Social Networks at Older Ages. CRR WP 2016-15. 10.2139/ssrn.2867594Suche in Google Scholar
Pinquart, M., and S. Sörensen. 2000. “Influences of Socioeconomic Status, Social Network, and Competence on Subjective Well-Being in Later Life: A Meta-Analysis.” Psychology and aging 15: 187–224. 10.1037/0882-7974.15.2.187Suche in Google Scholar
Rupert, P., and G. Zanella. 2018. “Grandchildren and Their Grandparents’ Labor Supply.” Journal of Public Economics 159: 89–103. 10.1016/j.jpubeco.2017.12.013Suche in Google Scholar
Rusbult, C. E., J. M. Martz, and C. R. Agnew. 1998. “The Investment Model Scale: Measuring Commitment Level, Satisfaction Level, Quality of Alternatives, and Investment Size.” Personal Relationships 5(4): 357–391. 10.1111/j.1475-6811.1998.tb00177.xSuche in Google Scholar
Small, M. L. 2017. Someone to Talk to. New York: Oxford University Press. 10.1093/oso/9780190661427.001.0001Suche in Google Scholar
Smith-Lovin, L., and J. M. McPherson. 1993. “You Are Who You Know: A Network Approach to Gender.” In Theory on Gender: Feminism on Theory, edited by P. England, 223–251. New York: Aldine de Gruyter. Suche in Google Scholar
Stancanelli, E. 2017. “Couples’ Retirement Under Individual Pension Design: A Regression Discontinuity Study for France.” Labour Economics 49: 14–26. 10.1016/j.labeco.2017.08.009Suche in Google Scholar
van Tilburg, T. G. 1998. “Losing and Gaining in Old Age: Changes in Personal Network Size and Social Support in a Four-year Longitudinal Study.” Journals of Gerontology. Series B: Psychological Sciences and Social Sciences 53: 313–323. 10.1093/geronb/53B.6.S313Suche in Google Scholar
van Tilburg, T. G. 2003. “Consequences of Men’s Retirement for the Continuation of Work-related Personal Relationships.” Ageing International 28(4): 345–358. 10.1007/s12126-003-1008-6Suche in Google Scholar
Wooldridge, J. M. 2010. Econometric Analysis of Cross Section and Panel Data. Cambridge, MA: MIT press. Suche in Google Scholar
Supplemental Material
The online version of this article offers supplementary material (https://doi.org/10.1515/ger-2020-0109),
which includes the Appendix.
© 2022 Comi et al., published by De Gruyter
This work is licensed under the Creative Commons Attribution 4.0 International License.
Artikel in diesem Heft
- Frontmatter
- Original Articles
- Do balanced-budget fiscal stimuli of investment increase its economic value?
- A macro-level analysis of language learning and migration
- Skill complementarity in production technology: New empirical evidence and implications
- The effect of retirement on social relationships
- The estimation of reaction functions under tax competition