Balancing Risk and Learning Opportunities in Corporate Venture Capital Investments: Evidence from the Biopharmaceutical Industry
-
Francesco Baldi
 ,
Daniela Baglieri
,
Daniela Baglieri

Abstract
When seizing new investment opportunities, CVC investors face a tension between learning rewards and risks in the form of market and technological uncertainties. Based on an inductive qualitative study relying upon a unique, longitudinal dataset of 260 CVC deals carried out by the top CVC investors in the biopharmaceutical industry between 2003 and 2013, we argue that the extent to which a CVC investor (and its corporate sponsor) may learn from new ventures depends on the nature of its risk attitude and, more in general, on its portfolio diversification (low risk) or concentration (high risk) strategy. In so doing, we identify four typologies of CVC portfolio strategies that allow for growth and learning options available to the parent sponsor, showing that there is a curvilinear (U-shaped) relationship between learning propensity and portfolio diversification. We also develop a tool for determining a CVC opportunity set that may help a fund to optimally allocate capital based on its own risk-return preferences. Theory for CVC decision-making is advanced by furthering two propositions requiring future empirical validation.
1 Introduction
The strategic fit between corporate venture capital (CVC) investing and the parent companies’ business has increased over time, with corporate investments being at least as successful as independent venture capital (VC) investments (Gompers 2002). It is widely recognized that corporate investments in emerging ventures can play an important role in the development of new technologies. Indeed, in technology-intensive industries firms are required to explore new technological trajectories and pursue their strategic renewal through external initiatives such as CVC investing (Zahra and Covin 1995; Zahra 1996; Keil 2002, 2004; Schildt, Maula, and Keil 2005; Dushnitsky and Lenox 2005a, 2005b), strategic alliances and acquisitions. While acquisitions and alliances have been extensively examined, research on CVC has only recently gained renewed interest (Dushnitsky 2006). In this article, we analyze CVC as an attractive mode for firms to create exploratory relationships and boundary-spanning ties with new highly innovative ventures. These ties refer to equity investments made by established firms in privately held entrepreneurial start-ups to get access to new markets and technologies, identify acquisition targets and leverage market extension opportunities (Gompers and Lerner 1997). Unlike investments made for financial purposes, CVC investments are dominated by strategic goals entailing beneficial learning processes and the development of managerial capabilities in new technological domains, which in turn nurture corporate growth opportunities.
The relevance of CVC investments finds evidence across the business community. CVC funds have invested more than $ 3 billion in the U.S. market only in the first quarter of 2014. About 130 “Fortune 500” corporations have so far established CVC programs (and related investment funds) including Intel, Cisco, Microsoft, and Disney. [1] A list of CVC initiatives recently launched or rejuvenated by leading companies is provided in Table 1.
Recent launches of CVC initiatives by top corporations.
| Launch date | Parent sponsor | CVC fund | Focus | Size |
| November 2013 | KPMG | KPMG Capital | Data and analytics businesses | $ 100 million |
| December 2013 | Dell | Dell Ventures | Early-to-growth-stage companies in emerging technology areas (e.g., cloud computing) | $ 300 million |
| February 2014 | Google Capital | Solid businesses with new technologies | $ 300 million | |
| April 2014 | Cisco | Cisco Investments | Early-stage companies accelerating development of technology markets in India (e.g., big data) | $ 250 million |
| April 2014 | Intel | Intel Capital >> “Intel Capital China Smart Device Innovation Fund” | Companies developing smart devices in China | $ 100 million |
| May 2014 | Nokia | Nokia Growth Partners >> “The Connected Car Fund” | Companies developing solutions for connected and intelligent vehicles | $ 100 million |
The interest in CVC has also spread in the biopharmaceutical industry. In 2011, CVC funds were involved in 25% of deals aimed at financing early-stage U.S. biotechnology, compared with 15% in 2010 (PricewaterhouseCoopers 2012). Tracy T. Lefteroff (2012), Global Managing Partner at PricewaterhouseCoopers, says that “it’s not surprising to see corporate venture capitalists becoming even more active in the biotech sector….bringing corporate venture capitalists to the table early in the company’s development helps ensure that there will be interest in the drugs being developed and identify a potential acquirer early on, thus allowing the VCs to deliver more expedient returns to their investors.” [2] On one hand, large pharmaceutical firms keep devoting their attention to early-stage biotech investments despite the increasing U.S. regulatory and marketing hurdles. On the other hand, large biotech firms have recognized that their expertise does not lie in early stage R&D, but smaller, more nimble venture-backed companies may be more efficient at drug development. Accordingly, large biopharmaceutical firms seek to establish CVC funds to invest into these smaller biotech companies with the aim of helping them fill and fund their R&D project pipelines and leverage the benefits of a prosperous ecosystem.
CVC investments play a key role in fostering exploration activities in emerging technologies across various industries (big data and cloud computing, drug discovery and delivery), enabling firms to overcome competence traps and lock-in risks (Wadhwa and Kotha 2006) and at the same time to activate business opportunities.
In light of the above, some efforts have been made in recent management literature to better understand the option features of CVC activity and its related risks.
From a real option perspective (Trigeorgis 1996; Vassolo, Anand, and Folta 2004), CVC investments may generate a variety of growth options, which offer entrepreneurial opportunities (Ozcan and Eisenhardt 2009), positively influence a venture’s financial performance (Mouri, Sarkar, and Frye 2012), and innovation outcomes (Faems et al. 2010; Srivastava and Gnyawali 2011). Tong and Li (2011) have focused on the notion of risk at industry level highlighting that growth options are embedded in new ventures under different degrees of uncertainty. Accordingly, CVC investors must properly select their target ventures so that the total value of their investment portfolio can be maximized by accepting a certain level of risk exposure. More specifically, CVC investors face higher uncertainty when their investment objectives involve greater exploration. However, greater exploration also leads investors to increasingly learn from their portfolio ventures. Hence, when seizing new investment opportunities, CVC investors face (and have to solve) a tension between learning rewards and risks in the form of market and technological uncertainties.
While CVC investments may often create growth opportunities and drive firm performance (Mouri, Sarkar, and Frye 2012; Park and Steensma 2013), how CVC investors should strike such a balance between learning rewards and market and technological uncertainties has not yet been systematically examined. The risk-based rationale suggests that resources should be lowered in the presence of uncertainty regarding strategic benefits; conversely, the learning view emphasizes that an increase in resource commitments may be essential for building trust and quality relationships that expedite learning. Despite the growing interest CVC attracts in practice, it is still unclear in what ways these contrasting views may be reconciled, especially in industries – such as the biopharmaceutical one – where the development of new drugs requires a lengthy, risky process. As a result, in this article we address the following general research question: What is the optimal type of venture portfolio that a CVC investor should construct and manage so as to balance uncertainties and strategic benefits (e.g. learning) associated with its investments?
To answer this question, we perform an inductive study based upon a unique, longitudinal dataset of 260 CVC deals carried out in the biopharmaceutical industry between 2003 and 2013. Typically, in all these transactions the target is a biotechnology company and the sponsor is a pharmaceutical firm through its owned CVC fund arm (chosen among the top 26 CVC initiatives established in the sector). In line with prior exploratory studies about new phenomena in CVC (Ernst, Witt, and Brachtendorf 2005), this article seeks to make a first step toward an analytical understanding of CVC activity in the biopharmaceutical industry and provide a somewhat clearer picture of the CVC dynamics during the stages of the innovation process (i.e. Pre-clinical, Phase I, Phase II, Phase III, Drug Approval, Marketing).
To do so, we extend the research on VC staged investment decision process taking a real options perspective and argue that CVC portfolio strategies need to be considered in terms of the follow-on learning opportunities that sponsoring parent firms might exploit in addition to transaction and agency costs. Furthermore, CVC investors may select homogeneous venture investments in order to enhance their market or technical knowledge, reduce managerial challenges and nurture their experience in a specific technological domain. Such an approach leads to venture portfolio concentration raising the risk exposure of the investment strategy. Conversely, the selection of heterogeneous venture investments increases portfolio diversification lowering related riskiness. Accordingly, we argue that the extent to which a CVC investor (and its corporate sponsor) may learn from new ventures depends on the nature of its risk attitude and, more in general, on its portfolio diversification (low risk) or concentration (high risk) strategy. This allows us to better analyze CVC portfolio strategies in terms of higher or lower technological heterogeneity and risk characteristics.
The aim of this study is twofold. First, we develop a tool for estimating the risk-return trade-off of CVC investments by combining a financial and a strategic approach to viewing early-stage venture investing. This enables us to derive a CVC opportunity set along which a CVC fund may choose to position itself by selecting its optimal venture portfolio. Second, drawing on the notions of learning and portfolio diversification, we suggest four typologies of CVC portfolio strategies that may be beneficial for an investing firm’s future growth potential.
The article is structured as follows. Section 2 briefly reviews the prior management literature on CVC looking at the two distinct streams of research on real options and (inter)organizational learning. Section 3 illustrates the research design and setting as well as the data collection and sampling procedure. It also offers a descriptive analysis of the key empirical patterns observed across the CVC investments included in the dataset. Section 4 contains a discussion of the empirical findings by proposing a risk-return frontier for CVC investments and a conceptual CVC option map allowing to outline four typologies of CVC strategies. Section 5 concludes highlighting the limitations of the study and its main implications for researchers and managers.
2 Prior Literature
The involvement of CVC units in new business development and venture creation is not new. Corporations established their first venturing initiatives following the extraordinary success of pioneering independent VC funds in the mid-1960s (Rind 1981; Landström 2007). Since then, the CVC activity in the U.S. market has been cyclical undergoing three “boom and bust” waves (late 1960s-early 1970s; late 1970s-early 1980s; late 1990s) that closely tracked the VC industry and was often halted before fully realizing the fruits of investments (Gompers 2002). In the attempt to equalize financial returns and strategic objectives, corporations have conducted their CVC activities adopting ineffective organizational solutions that often caused them to fail to reach their ultimate goals.
Early-stage technological investments are notoriously difficult to value because of their inherent, high level of both technical and market uncertainty. However, such value measurement complexities are counterbalanced by the learning benefits arising from these investments. Maula, Keil, and Zahra (2003) suggest that incumbents benefit from investing in start-ups in so far they enhance their capability to recognize emerging technological trajectories faster than rivals who fail to make such investments. In this sense, learning opportunities represent real options that may contribute to value creation associated with CVC investments by allowing for an increase in flexibility and a reduction in uncertainty. In this regard, real option theory (Trigeorgis 1996; Vassolo, Anand, and Folta 2004) suggests that the valuation of a firm’s new investment, such as a CVC initiative, requires the use of an expanded net present value (NPV) criterion, which accounts for the value of the embedded flexibility. In the real options context, option creation and option exercise are two distinctive, necessary stages. While the former refers to the identification of the investment opportunity, the latter represents the choice to undertake the investment decision by exercising the option created in the first stage. Once uncertainty has decreased to an acceptable level through the CVC investment, parent firms can decide to increase their level of commitment (option exercise). In the CVC setting, firms may embark on small initial investments at earlier stages due to the high levels of uncertainties affecting the new technological paradigm, and exercise subsequent options later on through engaging in follow-on investments (Folta 1998). Prior work on staged VC investment decisions (Li 2008) contends that the timing of financing depends on market uncertainty, competition and project-specific uncertainty. More specifically, market uncertainty urges VC funds to delay investments while competition and endogenous project-specific uncertainty lead them to invest sooner so as to either avoid losing the option to invest subsequently or to obtain information about the costs and benefits of the new ventures at stake. As the VC investor proceeds to the next stage, costs typically decrease while resource commitments increase due to a reduction in technological uncertainty (Sorenson and Stuart 2001). In following a staged investment process, CVC investors may create a portfolio of ventures embedding various strategic options and a different degree of riskiness. If certain technologies turn out to be promising, the CVC investor may decide to exploit single venture assets comprised in its portfolio by engaging in a strategic alliance or fully acquiring the venture. The rest of ventures associated with failing technologies will be divested at a loss.
Learning mostly depends on a firm’s prior knowledge stock. Hence, based on their accumulated knowledge, firms may decide to focus on a certain technological domain so as to become a specialist or a technological leader in that area or to invest into multiple technologies so as to potentially recombine internal knowledge and, ultimately, maximize the chances of a market success in exchange for a lower investment risk. In this context, captive CVC funds may add value at corporate level through leveraging and upgrading core competencies (e.g., specialist), reserving the “right to play” in emerging technologies (e.g., technological leader) (Henderson 2009) or, alternatively, diverging from current knowledge via portfolio diversification (Yang et al. 2014).
Evidence on the learning effects of CVC initiatives at corporate level is somewhat mixed. Using the lens of organizational learning, CVC activity represents a strategic approach that incumbent firms employ to overcome the competency trap (Levitt and March 1988) and the lock-in effects in a specific technological domain (Arthur 1989; Kogut and Zander 1992), while also enhancing both explorative and exploitative learning. In line with this reasoning, Dushnitsky and Lenox (2005b) show that CVC investments foster corporate innovation, with such a direct relationship being moderated by industry-level (e.g., intellectual property regimes) and firm-level (e.g., absorptive capacity) factors. Conversely, other scholars demonstrate that learning benefits associated with CVC investments are less effective compared to what occurs in other external growth initiatives with learning opportunities, such as alliances, joint ventures and acquisitions (Schildt, Maula, and Keil 2005).
Overall, CVC investments can be viewed as a way to expedite learning at corporate level by targeting firms that conduct R&D activities in new and unexplored technological domains (Wadhwa and Kotha 2006; Benson and Ziedonis 2009). While new business development is a risky and uncertain process, investing early on in emerging technologies may be crucial to get timely access to new knowledge, which in turn can allow for first-mover advantages. These studies invoke arguments from an inter-organizational learning view, which emphasizes the use of complementary resources to foster value creation in R&D alliances (Rothaermel and Deeds 2004; Wadhwa and Kotha 2006).
Furthermore, extant work on CVC has pointed out that information asymmetry and associated agency problems are crucial concerns in VC investments (Gompers 1995). Current understanding of how the above various factors – such as learning, agency costs and flexibility – impact on the staged provision of capital by CVC investors and the construction of their optimal venture portfolios is affected by some critical gaps which our article attempts to fill.
3 Method
3.1 Research Design and Setting
To address the research question on the optimality of CVC venture portfolios in terms of risk-learning balance under scrutiny, we apply a qualitative, inductive field analysis. Such investigation is followed by the identification of several elements favoring the combination of risk exposures and learning benefits (Glaser and Strauss 1967; Eisenhardt 1989; Yin 1994). CVC deals represent our unit of analysis. More specifically, we collect secondary data on CVC transactions mostly drawn from Medtrack and Global Corporate Venturing. Conceptual variables are operationalized by measuring and mapping the empirical properties of collected data through scaling indicators (mainly at ordinal level) and subsequent scoring (or statistical) techniques.
Given the scarce empirical evidence on VC staging which permits to balance risk exposures and learning benefits, we follow the logic of grounded theory (Glaser and Strauss 1967; Yin 1994). Based on the observation of pattern matching across CVC transactions, theory is inductively advanced by proposing two propositions that, if empirically corroborated in future scholarly research, may suggest prescriptive ways of constructing CVC portfolios to accomplish (non)learning and/or risk mitigation (maximization) objectives. The adoption of a qualitative methodology is also consistent with the fact that the timing of CVC investment decision stages involves choices that are embedded in nature (Strauss and Corbin 1990; Langley 1999).
The research setting is the biopharmaceutical industry, which represents the confluence of the business activity of those large pharmaceutical firms active in the biotechnology sector, with specific geographic focus in U.S. and Europe. Such a setting is suitable for two main reasons. First, this industry has been identified as being characterized by radical innovation (Rothaermel 2001), making it an ideal context to analyze risk and VC staging (Li 2008). Second, knowledge innovation is dispersed within this industry, being shared by big pharmaceutical firms and new biotechnology firms (NBFs). This implies that innovation processes are driven by intense alliance (Rotheaermel and Deeds 2004; Cockburn 2004) and CVC activities (Zahra 1996; Henderson 2009). Although many studies have looked at the impact of CVC on innovation performance in the biopharmaceutical industry (Dushnitsky and Lenox 2005a), none has so far examined how the risk-learning balance may shape CVC investment portfolios.
3.2 Data Collection
Based on Medtrack [3] database, a unique dataset was constructed by collecting relevant information on global CVC deals mainly involving U.S. and European biotechnology firms in the 2003–2013 periods. More specifically, our focus is on CVC financing devoted to sponsoring new investments made by biotech companies to advance the internal development of outstanding compounds with a potential to become marketable drugs. Starting from a massive database of 5.138 transactions announced and/or completed by active CVC funds over the past 25 years (1989–2013) and available within Medtrack, three criteria were applied to make the selection of the final sample of our study. First, all deals for which CVC investors are undisclosed were eliminated so as to allow for the identification of all parties involved. Second, all deals involving biotech firms, for which the current R&D stage of the compound targeted by CVC financing could not be recognized, were disregarded. Third, out of the transactions fulfilling the above criteria, only those carried out by the major 26 CVC funds mostly operated by leading pharmaceutical or biotech firms were kept in. [4]
Unambiguously, the most active CVC funds operating in the biopharmaceutical industry were identified based on the ranking performed by Global Corporate Venturing (GCV) (June 2010). More specifically, only those deals involving biotech firms targeted by 22 funds (included in the top 30 CVC funds ranked by GCV) and other 4 funds (ranked among the top 60 CVC funds by GCV) operated by branded pharmaceutical companies, were actually selected. The list of CVC funds (with their relative GCV ranking) acting as investors in biotech companies included in our dataset is shown in Table 2.
List of top CVC funds providing capital to biotech firms selected in the dataset (Global Corporate Venturing, June 2010).
| Rank | CVC name |
| 1 | Novartis |
| 2 | Johnson & Johnson |
| 3 | Wellcome Trust |
| 4 | Novo |
| 5 | GlaxoSmithKline |
| 6 | F. Hoffmann-La Roche |
| 7 | Pfizer |
| 9 | Eli Lilly |
| 11 | Dow Chemical |
| 12 | Mitsubishi Tanabe Pharma + Mitsubishi Chemical |
| 13 | Takeda Pharmaceutical |
| 14 | AstraZeneca |
| 16 | Boehringer Ingelheim |
| 18 | Amgen |
| 20 | Biogen Idec |
| 22 | Astellas Pharma |
| 23 | Siemens |
| 24 | Clarian Health |
| 25 | Kaiser Permanente |
| 27 | Cleveland Clinic |
| 29 | Sanofi-Aventis |
| 30 | Daiichi Sankyo |
| 37 | Novo Nordisk |
| 38 | Merck KGaA |
| 54 | Bristol-Myers Squibb |
| 60 | Abbott Medical Optics |
The final sample of transactions completed by leading CVC funds targeting biotech companies and their relevant investments in a compound at current R&D stage is made of 260 deals spanning the period between 2003 and 2013.
3.3 Data Analysis
Our dataset corroborates the publicly available evidence (recalled in section 1) that CVC financing was a growing phenomenon in the biotech industry over the last decade, with a remarkable rise recorded from 2010 onward, which merits further investigation. Starting from the closing of only 11 deals in 2003, there was a steady increase of CVC activity worldwide – despite a slump in the number of CVC deals accomplished in 2008–2009 due to the severity of the financial crisis, followed by a sharp escalation in 2010 – that reached a peak in 2012 with the successful completion of 37 transactions (Figure 1).

Number of CVC deals per year (2003–2013).
The degree of intensity of CVC activity in the biotech sector is also reflected in the total and average size of deal-making across the 2003–2013 period. In this respect, the total yearly amount of CVC financing steadily increases from $ 359 million to $ 1.139 million in the pre-financial crisis period (2003–2007) mimicking the increasing pattern in the number of transactions over the same years (Figure 2, Panel A). A decline in the total value of annual CVC deal-making is instead observed in the post-financial crisis (2008–2013) with a reversion to the initial bottom amount of $ 378 million in 2013. The pattern of average CVC deal values mirrors that observed at aggregate level. While the average market value of transactions carried out by CVC funds gradually increases in the pre-financial crisis period (2003–2007) rising from $ 32.6 million in 2003 to $ 35.6 million in 2007, the post-financial crisis period (2008–2013) is characterized by a sharp decline in the average deal value that drops to $ 21 million in 2013 (Figure 2, Panel B). If such a trend in the average value of deal-making is combined with the escalation of CVC activity in terms of number of transactions completed, it is fairly clear that in the past five years (since 2009) CVC funds show a preference to engage in an increasingly higher number of low capital-absorbing investments by investing less equity capital on average per single transaction. This corresponds to a risk-adverse, diversification approach to venture portfolio construction.

Total and average CVC deal value per year ($ million) (2003–2013).
An in-depth analysis of the information on CVC transactions included in our dataset reveals some interesting peculiarities of the investment strategies pursued by the leading funds in the industry and of their target biotech firms.
First, the current R&D stage of the molecule being developed by each biotech firm, when targeted by the CVC fund, is examined with the aim of detecting the predominant CVC investment strategy. For this purpose, all molecules under development associated with each CVC transaction included in our dataset are grouped into six categories: Pre-Clinic Phase, Phase I, Phase II, Phase III, Drug Approval (e.g., compounds gradually developed into candidate drugs waiting to obtain approval from the national competent authority, such as the Food & Drug Administration – FDA in the United States), Market (e.g., approved drugs launched into the market). [5]
As shown in Figure 3, the number of CVC-funded molecules that are in early R&D stages (Pre-Clinic, Phase I) (75) at the time of the respective fund’s intervention is much lower relative to that of compounds positioned instead at later R&D stages (Phase II, Phase III, Drug Approval, Market) (185). More specifically, biotech companies conducting R&D activity on molecules at Phase II are mostly preferred as target investments by CVC funds, as 118 transactions (45% of the molecules underlying the deals included in our sample) are completed on such compounds. Molecules at Phase III, Drug Approval and Market are jointly considered as next best (67 transactions; 26% of the sample). Clearly, compounds that are at Phase II (or at a later stage) are more likely to become blockbuster drugs in the marketplace and should be thus regarded as less risky as compared to molecules still laying behind in their development process (e.g., those at research/discovery or Phase I stage). Consistently with Lo and Naraharisetti (2013), such evidence implies that over the 2003–2013 span CVC funds in the biopharmaceutical sector, through directing most of their capital at firms with a Phase II-compound under development, pursued a more risk-adverse approach to venture investing.
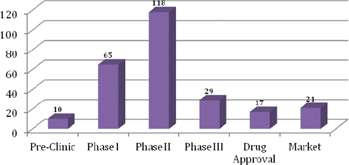
Molecules per R&D stage financed by CVC (#; %) (2003–2013).
Second, the R&D targeting focus of CVC investment strategies is also analyzed across time (Figure 4). While in 2003–2005 CVC investors are not yet able to pursue a clear investment strategy in the biotech sector, starting from 2006 CVC funds adopt a dominant safe Phase II-focused investment strategy, which stands still throughout the remaining period. The construction of such principal risk-adverse portfolios is thus started by leading CVC funds since 2006 and mounts up over the most recent years.
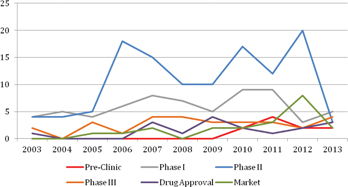
Number of molecules per year and R&D stage (2003–2013).
Third, most CVC investment strategies scrutinized in our sample are concentrated on U.S.-based biotech companies (195 investments), with U.K.-based ones being considered as next best targets (16 investments) (Figure 5). This indicates that leading CVC funds that are active in the biopharmaceutical industry tend to poorly leverage geographic diversification in their portfolio construction.
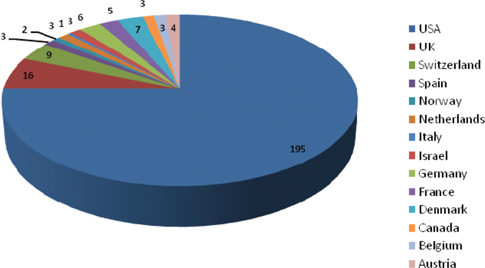
Geographic distribution of CVC deals (2003–2013).
Fourth, the number of stages through which capital of CVC investors is typically infused into the biotech industry is also examined. CVC funds, and more in general VC investors, rarely finance target firms by providing all of the capital required by the venture upfront. Rather, investments are staged with periodic capital provided to the entrepreneurial firm subject to milestones being met (Gompers 1995). In the VC jargon, these subsequent stages of financing are named as “rounds” and labeled by a letter of the alphabet. For instance, the round of financing defined as “A” corresponds to the earliest event of capital provision, followed by rounds B, C, D and so forth. [6] The frequency of staged capital commitments may range between 6 months and 2 years. More frequent staging is impractical due to the legal and time costs of writing and negotiating contracts (transactions costs) and the monitoring activity being required to verify whether or not milestones have been met (monitoring costs). The stages of capital infusion are usually agreed upon between the CVC fund and the target firm based on the business plan projections. If the predetermined milestones cannot be met by the portfolio firm, it does not necessarily imply that the investment is ceased. It may simply mean that future capital provision will be revalued and the portfolio firm’s management must expect an increasing monitoring activity by the CVC investor.
One of the main explanations for the existence of VC funds – along with the risk-sharing (Amit, Glosten, and Muller 1990) and the skills learning (Chan, Siegel, and Thakor 1990) arguments – is the presence of agency problems (Amit, Brander, and Zott 1998). Due to agency costs, start-up firms without a track record and little or no collateral face extreme difficulty obtaining capital from banks. VC funds with expertise in carrying out due diligence for entrepreneurial start-ups with great asset specificity (industry-specific or firm-specific) are capable of mitigating problems of adverse selection and writing contracts to monitor investments and attenuating moral hazard and other agency problems that might adversely affect firm value (Cumming and Johan 2014). By staging capital injections, the CVC fund keeps the portfolio company on track with its committed business plan so as to minimize its own financial risk. In this sense, while staging capital infusion facilitates monitoring of portfolio companies and thereby reduces agency problems, it also forces the CVC investor to face a tradeoff between mitigating agency costs and incurring transactions costs (e.g., associated with issuances of new financing instruments) (Gompers 1995). Hence, in a world with both agency and transactions costs, a moderate degree of staging – that is, a clenched series (or number) of rounds of financing – is expected as optimal staging frequency would depend on the magnitude of monitoring and legal costs of contracting relative to the extent by which staged capital investment reduces agency problems. [7]
Consistently with Gompers and Lerner (1999), our evidence shows that CVC funds active in the biopharmaceutical sector are inclined to invest their own capital via use of up to three subsequent rounds (A, B, C) encompassing 175 transactions (67%). Interestingly, round B represents the mode of the rounds’ distribution (78 deals; 30%) implying that CVC funds of the above kind prefer to make follow-on, equity investments no more than twice into the same project (Figure 6). Agency problems (and related costs) are less pronounced in transactions that involve biotech companies as targets and pharmaceutical firms as parent entities of the fund given the proximity of their businesses, thus restraining the need for staged financing.
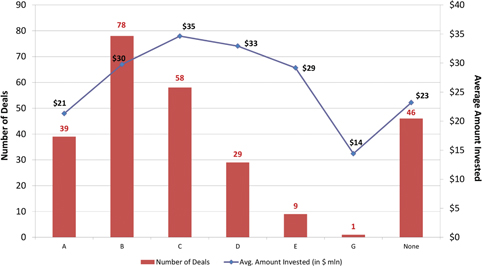
Relationship between the amount of equity capital invested and the frequency of staged investments (number of rounds of financing) (2003–2013).
Moreover, there exists a positive relationship between the average amount of equity capital invested by the CVC fund and the timing of the round of financing (Figure 6). The earlier the round of financing, the lower the average amount of capital injected by the CVC investor into the target portfolio venture. In the VC world, the agency problems that staged investment practices seek to solve are motivated by the presence of significant information asymmetries between the investor and its target firm especially when the investment process is initiated. The size of staged VC capital injections is thus proportional to the degree of learning about the across-time, market potential of the target firm’s business plan that the investor gains as it progresses in the investment process. In the biopharmaceutical sector, as the CVC investor continues to financially support the R&D operations of the target firm, it can incrementally acquire new information on how likely the successful approval and subsequent commercialization of the molecule under development are. Indeed, the market launch of the candidate drug is the only source of cash flows for the target company, which in turn implies a high return at exit for the CVC investor. Our evidence confirms such industry practice as CVC investors tend to increase on average the amount of staged capital commitments as the number of rounds advances by infusing the uppermost amount of capital into the venture at the intermediate round C ($ 35 million). In so doing, CVC investors seek to minimize the agency problems posed by target biotech firms in their portfolios so as to keep their R&D operations on track toward the full development of the molecule that may become a marketable drug.
We finally inquire into the level of business maturity targeted by CVC investors. To do so, we refer to Maurer and Ebers (2006)s findings according to which a target portfolio venture in operation for no more than 4 years is considered as a startup. [8] Contrary to what CVC investors are expected to do, investment strategies pursued by funds operating in the biotech sector are – to some extent – aimed at targeting safer non-startups (141) rather than younger firms (119), whose R&D operations at earlier stages are affected by a higher risk of failure.
Conclusively, the descriptive examination of our sample provides a strong overall empirical evidence that in the 2003–2013 period CVC funds take a predominantly risk-adverse approach to constructing their venture portfolios by implementing risk mitigation strategies and engaging in the completion of less risky deals.
4 Discussion
4.1 A Risk-Return Frontier for CVC Investments in the Biopharmaceutical Sector
Given the attention paid to risk in deal-making and portfolio construction by CVC funds, their investment strategies in the biopharmaceutical sector may be appropriately analyzed looking at the risk-return trade-off involved in the business venture selection process and, more in general, defined in the investment policy at the outset. Borrowing from finance and modern portfolio theory (Markowitz 1952, 1959), we thus develop a risk-return, efficient frontier for CVC investments that may serve as a tool for helping fund managers to locate new venture opportunities and measure their contributions to the overall portfolio risk and return.
To this end, we propose a measure for the attribution of a risk class (or score) to a stand-alone or portfolio-based CVC investment strategy. Such a risk score is defined by accounting for the relevant, current R&D phase of the compound being financed by the CVC investor by means of equity capital provision. More specifically, using Likert scaling (1932), [9] a notch of 1 is assigned to the commercialization stage (Market Launch phase), thus increasing by 1 point the notch attributable to any subsequent riskier stage so as to allot a notch of 6 (the highest) to the Pre-Clinical Phase, which should be considered as the riskiest stage in drug development. Indeed, a drug ready for commercial launch in the marketplace, having received the competent authority’s approval, is an ideal target for a potential, risk-adverse CVC investor due its very low intrinsic risk exposure. To the other extreme, a molecule at a Pre-Clinic stage is presumably highly risky because of its high probability of failing to succeed to next phases. As a result, each molecule in our sample is assigned a notch ranging from 1 to 6 that is inversely related to the underlying technical and/or market and thus financing risk assessed by the CVC investor.
A typical risk-return frontier is thus built by plotting the expected returns in the vertical axis and the associated units of riskiness in the horizontal axis for all investments collectively realized by CVC funds included in our sample. The expected return of each deal is derived by quantifying the cost of equity commonly required by VC investors and multiplying it by the size of the equity underwritten by the CVC fund. A rate range for the cost of equity used in the VC-backed biotech context is available from the empirical estimations provided by Cockburn (2004) and Cockburn and Lerner (2009). It follows that for molecules with a risk score of 4 (statistical mode) the cost of equity is based on an implied expected return of 21.5%. For molecules of lower riskiness (risk score of 3, 2 and 1) a decreasing cost of equity of 15.5%, 9.5% and 3.5%, respectively, is determined. For molecules of higher riskiness (risk score of 5 and 6) an increasing cost of equity of 27.5% and 33.5%, respectively, is estimated. The units of riskiness of each CVC deal of our sample in the horizontal axis are measured on the basis of the risk class (or score) derived above. The combination of expected returns and risk scores for all CVC market transactions available in our sample yields the mean-variance, efficient frontier (solid line) shown in Figure 7. If portfolios of venture investments, rather than single transactions, are considered, then the frontier arises from plotting aggregate expected returns and risk scores. Aggregate risk scores are derived from averaging out notches assigned to each specific deal.
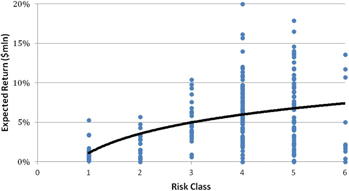
CVC Risk-Return Frontier.
Such a frontier represents a sort of CVC opportunity set along which a CVC fund can move to choose the optimal portfolio of investments as a function of its degree of risk aversion and its return expectations. Our proposed CVC efficient frontier may help CVC investors to optimally allocate their own equity capital based on the notion of an inherent risk-return trade-off.
4.2 A Typology of Option-Based Investment Strategies for CVC Funds
The main motivations driving companies to arrange CVC programs are the obtainment of attractive financial returns and the exploitation of strategic synergies and/or benefits resulting from the full integration (or a select knowledge spillover) of the new venture into the corporate entity that promotes the CVC activity (Chesbrough 2002). Among the benefits of CVC investments is the creation of new learning opportunities. However, as discussed in Sections 1 and 2, the extent to which a corporation may learn from new ventures acquired and nurtured by the captive CVC fund and the types of associated growth options subsequently exercisable at corporate level depends on the degree of overall risk exposure chosen by the latter for its investments through the pursuit of a portfolio diversification (low risk) or concentration (high risk) strategy.
To establish a relationship between learning propensity and risk exposure of CVC investors, we rely on our dataset to build two scores that, if properly combined, can be used to differentiate among CVC investment strategies. By analyzing the interplay between these two dimensions, we can identify a broad range of strategic options available to CVC investors and leading to a proactive venture portfolio management. A conceptual map, called as “CVC option map”, is next proposed to classify four typologies of CVC strategies (Figure 8).
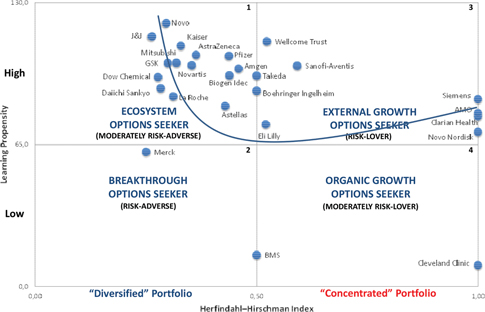
CVC option map.
Along the vertical axis is what we call the learning propensity score, which is calculated by multiplying – for each CVC fund included in our sample – the average deal value (in $ million) by the average number of rounds of financing executed for all portfolio transactions (where greater sub-scores are attributed to more frequent rounds such as A and B, that is the assigned sub-score decreases as incremental capital is injected into a portfolio venture by the CVC investor at the next round). On one hand, the average amount of equity capital provided by a CVC fund to its all portfolio companies reflects the degree of learning achieved by staging capital commitments and increasing them at each subsequent round across all transactions (in line with the evidence discussed in Section 3; see Figure 6). The higher the average value of transactions, the greater the level of knowledge acquired by the CVC investor on each of its portfolio firms. On the other hand, the average frequency of staged capital investments represents an adjustment to the average deal value to account for the fact that learning (from portfolio companies) must be moderated by the trade-off between the mitigation of agency problems and the disbursement of the costs of contracting (e.g., monitoring, negotiation). Consistently with Gompers (1995), while staging capital investments reduces the exposure to agency problems, it also involves frequent, costly transactions and monitoring activities. This favors a round frequency limited to the A-B-C sequence as opposed to a longer series (down to G). In this way, learning and monitoring (with associated contracting costs) are reconciled.
The learning propensity of a CVC investor is thus high when both the average deal value and the average number of financing rounds completed for all deals are high; intermediate, when the average number of financing rounds completed for all deals is high, but the average value of such transactions is low (or vice versa); low, when both quantities are low. A CVC fund showing a high learning propensity implies that it tends to maximize the learning process associated with the new venture investment by disbursing a large (and increasing) amount of equity capital through an optimally clenched series of financing rounds. When the timeline of rounds is more stretched and equity tickets are smaller, learning propensity diminishes. The values of the learning propensity score have a lower bound in 0 and are potentially limitless.
Along the horizontal axis is the Herfindahl–Hirschman Index (HHI) [10] measured on the basis of the molecule-picking (or selection) strategy and associated risk exposure pursued by CVC funds included in our sample. More specifically, the HHI, ranging from 0 to 1, quantifies the level of (portfolio) diversification (0) or concentration (1) for CVC investment portfolios.
As a result of the combination of the above two dimensions, CVC funds may be classified as (moderately) risk-lover or (moderately) risk-adverse when seeking to pursue four, option-based investment strategies. Starting from the most straightforward investment behavior, CVC funds positioned in the quadrant 4 of the CVC option map are less prone to learning from acquired ventures by tending to invest on average small equity tickets within a long series of rounds, with the purpose of constructing a concentrated venture portfolio. Those funds are focused and specialized organizations seeking to leverage their deal-making to allow parent firms to grow internally. For this reason, investments are concentrated into ventures associated with the discovery and development of molecules of the same type of those being developed by the parent firm. This entails less learning needs at corporate level, which translates into lower spillover efforts by the CVC investor. Target portfolio companies embed growth options exercisable by the parent firm to merely enhance and/or integrate its current business operations. The exercise of such growth options occurs via the pursuit of exploitation strategies mostly based on licensing agreements. The way the parent firm may benefit from its CVC initiatives is through learning associated with the establishment of licensing agreements with the portfolio company. CVC funds of this kind are labeled as “organic growth options seekers”. Due to a portfolio investment concentration on ventures mostly engaged in developing molecules of the same risk class through small equity capital infusion, such CVC funds are also classified as moderately risk-lover in terms of their overall risk profile.
CVC funds positioned in the quadrant 3 of the CVC option map are, similarly to those of quadrant 4, still engaged in building a concentrated venture portfolio but are more likely to be willing to learn by investing large equity tickets through a clenched series of rounds. Indeed, our sample-based empirical evidence shows that the value of market transactions completed by these types of CVC funds is above average and related financing occurs with less frequent staging. Their investment strategies are targeted at compounds featuring those development stages that are predominant in the parent firm’s R&D pipeline. The large size of the investment outlay allocated within an optimally compressed sequence of rounds maximizes learning, thereby facilitating subsequent knowledge absorption at the parent firm level through follow-on acquisitions of portfolio companies. Parent firms seek to capture growth options embedded in CVC-targeted new ventures that, given their high potential for value creation, require larger equity tickets paid in anticipation of an ensuing business integration. CVC funds of this kind may be defined as “external growth options seekers”. Blending a narrow, predominantly single-molecule focus of portfolio venture investments with a large value of the equity stake elevates the risk exposure of CVC initiatives, which may be then classified as risk-lover.
At the intersection of a low average deal value and a diversified venture portfolio investment strategy (quadrant 2), CVC funds are inclined to identify and potentially exercise (real) options to explore new markets and/or products by searching for breakthrough drugs or medical device technologies among several projects. Given their nature of unexplored territories, such CVC investment opportunities would have little potential to enhance the parent firm’s current business operations. However, if the CVC arm of a corporation succeeds in detecting – among the numerous ventures included in its portfolio – the innovative content of a distinct company that is capable of making (and bringing to approval) an important discovery advancing the pharmaceutical practice, the option to learn from such innovation may be exercised at parent level by transforming its future business operations with a novel and unique technology. In this context, learning is an exceptional event and the related process quite discontinuous. This renders learning propensity a less important attribute for these funds. The inherent riskiness of such explorative mode typically requires a small equity capital investment. CVC funds of this kind are classified as “breakthrough options seekers”. Risk-wise, these CVC investment strategies are of risk-adverse nature.
Finally, if a diversified approach to venture portfolio investing is combined with a great learning propensity, the strategic rationale of CVC initiatives situated in quadrant 1 is that of disbursing large amounts of equity capital across a broad spectrum of ventures in market transactions requiring an optimally compressed series of rounds so as to maximize the identification and potential, subsequent exercise of growth options available within the parent firm’s ecosystem. Parent corporations may be motivated to utilize CVC investments to stimulate the advancement of the ecosystem in which they operate. Such ecosystem is typically made of rival biotech companies engaged in research that is complementary to outstanding R&D pipelines conducted within the parent firm. A captive CVC program that leads to the purchase of equity stakes in these ventures by taking over their on-going research projects may give the parent firm an option to stimulate market demand for its existing or would-be drugs. Such CVC investment strategies may also be aimed at sponsoring competitive initiatives (e.g., technologies, devices, molecules) that would help parent firms to streamline their existing business operations. The learning potential of such CVC strategies is enormous as knowledge and skill spillovers from target ventures can be leveraged to enhance internal exploration at parent level in exchange for a moderate risk exposure due to portfolio diversification. CVC funds positioned in quadrant 1 of the CVC option map are thus classifiable as “ecosystem options seekers” and moderately risk-adverse.
The majority of CVC funds surveyed in our sample are positioned in the quadrant 1 of our conceptual map, which confirms the shift of CVC strategies toward a more risk-adverse approach to venture investing. This strategic change of CVC activity conducted in the biopharmaceutical sector may be explained by the recognition that corporate value creation may be improved if an explorative attitude is followed in venture scouting. Overall, the biopharmaceutical industry seems to be dominated by CVC programs featuring relatively high learning propensity regardless of risk attitudes (quadrants 1 and 3).
More interestingly, the conceptual option map constructed on the basis of our evidence shows that learning propensity and portfolio diversification are tied up by a curvilinear, U-shaped relationship. As CVC funds in the biopharmaceutical industry decrease the level of their portfolio diversification by heightening investment concentration, their learning propensity declines due to a lower number of available ventures that the parent entity can leverage to nurture its ecosystem and absorb knowledge. Their risk profile gets also exacerbated by more concentrated investments. After reaching a local minimum, learning propensity bounces back if risk-loving, focused portfolio investment strategies are pursued. R&D complementarity, massive equity investment and optimal fund staging help parent firms to target ventures that, if acquired, can accelerate value-creating knowledge transfer. Such a U-shaped relationship between learning propensity and the degree of portfolio diversification of CVC initiatives sponsored by pharmaceutical firms with the aim of targeting biotech ventures can be named as “CVC smile”. According to the above evidence, we suggest the following proposition:
Proposition 1: There is a curvilinear (U-shaped) relationship between CVC portfolio diversification and learning propensity.
Furthermore, learning-driven growth options embedded in CVC investment strategies mapped in our conceptual framework can be more generally grouped into two distinct categories. Learning options that are pursued by CVC funds of quadrants 3 and 4 to grow organically or externally may be classified as (real) options to expand parent business operations. Learning options associated with CVC initiatives comprised in quadrants 1 and 2 may be classified as (real) options to extend parent business operations. When exercising the former types of options, parent firms reach the objective of enlarging the dimension of their current business activities via CVC investment. Under this circumstance, learning is a purposeful activity aimed at reinforcing current R&D programs. When exercising the latter types of options, parent firms get access to unexplored markets or products so as to stretch their existing business lines by learning about novel technologies via CVC investment.
Depending on the amount of equity capital injections, the frequency of staged financing and the narrower or wider extent of portfolio investment (concentration vs. diversification), CVC funds may decide which risk/learning strategy to pursue by positioning themselves in one of the four quadrants of our CVC options map.
Portfolio concentration is the result of exploitation-based, focused investment strategies pursued to leverage CVC transactions to allow parent firms to grow internally or externally. Organic or external growth creates less valuable options as opposed to an explorative and diversified mode of investing. An investment in a breakthrough venture or a rival firm whose internalization could restructure the parent’s business may add more value to CVC portfolios (and, in turn, to corporate sponsors) than other types of assets. In the presence of portfolio diversification, growth and learning options are more numerous and of higher value impact.
Using our data on CVC deals in the biopharmaceutical sector, the combination of such dimensions as the level of portfolio diversification/concentration measured by the Herfindahl–Hirschman Index (HHI) and the value of the fund’s venture assets currently under management [11] provides empirical evidence on the negative relationship between these two factors and leads us to suggest the following further proposition:
Proposition 2: The level of a CVC portfolio concentration (and associated risk exposure) is negatively associated with the value of the investing firm's venture assets under management.
As shown in Figure 9, the higher the degree of portfolio concentration, the lower the value of the CVC firm’s venture asset portfolio.
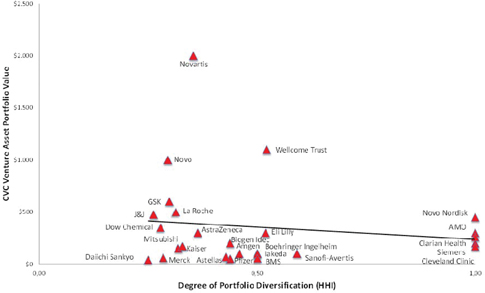
Relationship between portfolio concentration and CVC venture asset portfolio value.
5 Conclusions
Based on a sample of 260 deals carried out within the top CVC programs mostly active in the U.S. and European biopharmaceutical industry over the past decade, we extend prior work on CVC portfolio strategies (Chesbrough 2002) providing a better understanding of how CVC investors may solve the tension between learning rewards and risks arising from market and technological uncertainties associated with their target venture investments. The observation and thorough analysis of empirical patterns across such transactions leads us to contend that that portfolio diversification (and associated risk attitude) interacts with the CVC investor’s propensity to learn (and promote further learning at parent level), fostering a variety of option-driven investment behaviors.
The main contribution of our study is to identify and describe four typologies of CVC funds that pursue alternative optimal strategies enabling them to reconcile learning opportunities with risk attitudes, especially when operations are conducted in dynamic environments. To do so, we integrate the (inter)organizational learning literature with that on real options, thus enriching CVC research.
We utilize a qualitative, inductive field analysis to dig into our select empirical dataset, which enables us to develop two propositions (Propositions 1 and 2) that may be further validated by researchers in the future. Their supplementary, empirical corroboration may advance theory on CVC strategies suggesting prescriptive ways of building venture portfolios to achieve (non)learning and/or risk mitigation (maximization) objectives.
Our work has two key implications for CVC managers. First, we develop a sort of CVC opportunity set in the biopharmaceutical industry. Such a frontier may be a useful tool to help CVC fund managers to position their own single venture investments or total portfolios in the mean-variance space based on their risk-return preferences similarly to what investors in risky assets (e.g., stocks) do using standard portfolio theory. CVC funds would then be able to move along the (risk-return) convex set by switching from a risk-loving investment strategy (high risk/high return with funding committed to biotech firms mostly developing compounds in early R&D stages) to a more risk-adverse one (low risk/low return with funding dedicated to biotech firms mostly developing compounds in late R&D stages) or vice versa.
Second, we formulate a conceptual framework which – depending upon the amount of equity capital injections, the frequency of staged financing and the degree of portfolio diversification – allows CVC investors to choose the risk-learning trade-off featuring their overall venture investment strategy and the associated blending of follow-on, real (growth and learning) options available to sponsoring parent firms. Our empirical analysis prescribes that the relationship between portfolio diversification and learning is non-linear and a concentrated, exploitation-driven investment portfolio may adversely influence the value of venture assets.
Despite the above contributions, our study has several limitations. First, since our analysis focuses on the sole biopharmaceutical industry, the generalizability to other industries may be limited. Additional limitations may stem from the use of a purposive sample rather than a random sample. While we focus on the top CVC firms deals selected from Global Corporate Venturing, a source widely used in strategy research, we acknowledge that our results may not be generalized to the population of established companies that are at risk of CVC investing. Additional evidence relying on data from different industries and time periods is needed to further validate our findings.
Conclusively, our hope is to have advanced theory on CVC providing “food for thoughts” for a more complex view of CVC decision-making, whereby financial and strategic motivations are enriched by a potentially value-creating tension between learning propensity and risk attitude.
References
Amit, R., J.Brander, and C.Zott. 1998. “Why Do Venture Capital Firms Exist? Theory and Canadian Evidence.” Journal of Business Venturing13:441–66.10.1016/S0883-9026(97)00061-XSearch in Google Scholar
Amit, R., L.Glosten, and E.Muller. 1990. “Entrepreneurial Ability, Venture Investments, and Risk Sharing.” Management Science36:1232–45.10.1287/mnsc.36.10.1233Search in Google Scholar
Arthur, B. W.1989. “Competing Technologies, Increasing Returns, and Lock-in by Historical Events.” The Economic Journal99 (394):116–31.10.2307/2234208Search in Google Scholar
Benson, D., and R. H.Ziedonis. 2009. “Corporate Venture Capital as a Window on New Technologies: Implications for the Performance of Corporate Investors When Acquiring Startups.” Organization Science20 (2):329–51.10.1287/orsc.1080.0386Search in Google Scholar
Bernstein, I. H.2005. “Likert Scale Analysis.” Encyclopedia of Social Measurement2:497–504.10.1016/B0-12-369398-5/00104-3Search in Google Scholar
Chan, Y. S., D. R.Siegel, and A. V.Thakor. 1990. “Learning, Corporate Control and Performance Requirements in Venture Capital Contracts.” International Economic Review31:365–82.10.2307/2526845Search in Google Scholar
Chesbrough, H. W.2002. “Making Sense of Corporate Venture Capital.” Harvard Business Review80 (3):90–9.Search in Google Scholar
Cockburn, I.2004. “The Changing Structure of the Pharmaceutical Industry.” Health Affairs23 (1):10–22.10.1377/hlthaff.23.1.10Search in Google Scholar
Cockburn, I., and J.Lerner. 2009. “The cost of capital for early-stage biotechnology ventures”. Unpublished working paper.Search in Google Scholar
Cumming, D. J., and S. A.Johan. 2014. Venture Capital and Private Equity Contracting, 2nd edn.Elsevier.Search in Google Scholar
Dushnitsky, G.2006. “Corporate Venture Capital: Past Evidence and Future Directions.” Oxford Handbook of Entrepreneurship. 387–431.10.1093/oxfordhb/9780199546992.003.0015Search in Google Scholar
Dushnitsky, G., and M. J.Lenox. 2005a. “When Do Firms Undertake R&D by Investing in New Ventures?” Strategic Management Journal26 (10):947–65.10.1002/smj.488Search in Google Scholar
Dushnitsky, G., and M. J.Lenox. 2005b. “When Do Incumbents Learn From Entrepreneurial Ventures?: Corporate Venture Capital and Investing Firm Innovation Rates.” Research Policy34 (5):615–39.10.1016/j.respol.2005.01.017Search in Google Scholar
Eisenhardt, K. M.1989. “Building Theories From Case Study Research.” The Academy of Management Review14:532–50.10.2307/258557Search in Google Scholar
Ernst, H., P.Witt, and G.Brachtendorf. 2005. “Corporate Venture Capital as a Strategy for External Innovation: An Exploratory Empirical Study.” R&D Management35 (3):233–42.10.1111/j.1467-9310.2005.00386.xSearch in Google Scholar
Faems, D., M.De Visser, P.Andries, and B.Van Looy. 2010. “Technology Alliance Portfolios and Financial Performance: Value-Enhancing and Cost-Increasing Effects of Open Innovation.” Journal of Product Innovation Management27 (6):785–96.10.1111/j.1540-5885.2010.00752.xSearch in Google Scholar
Folta, T. B.1998. “Governance and Uncertainty: The Tradeoff Between Administrative Control and Commitment.” Strategic Management Journal19 (11):1007–28.10.1002/(SICI)1097-0266(1998110)19:11<1007::AID-SMJ999>3.0.CO;2-8Search in Google Scholar
Glaser, B. G., and A. L. Strauss.1967. The Discovery of Grounded Theory: Strategies for Qualitative Research. Chicago: Aldine Publishing Company.Search in Google Scholar
Gompers, P.1995. “Optimal Investment, Monitoring, and the Staging of Venture Capital.” The Journal of Finance50:1461–89.10.1111/j.1540-6261.1995.tb05185.xSearch in Google Scholar
Gompers, P.2002. “Corporations and the Financing of Innovation: The Corporate Venturing Experience.” Economic Review – Federal Reserve Bank of Atlanta87 (4):1–17.Search in Google Scholar
Gompers, P., and J.Lerner. 1997. “Venture Capital Distributions: Short‐Run and Long‐Run Reactions.” The Journal of Finance53 (6):2161–83.10.1111/0022-1082.00086Search in Google Scholar
Gompers, P., and J.Lerner. 1999. The Venture Capital Cycle. Boston: The MIT Press.Search in Google Scholar
Henderson, J.2009. “The Role of Corporate Venture Capital Funds in Financing Biotechnology and Healthcare: Differing Approaches and Performance Consequences.” International Journal of Technoentrepreneurship2 (1):29–44.10.1504/IJTE.2009.027544Search in Google Scholar
Keil, T.2002. External Corporate Venturing: Strategic Renewal in Rapidly Changing Industries. Greenwood Publishing Group.Search in Google Scholar
Keil, T.2004. “Building External Corporate Venturing Capability.” Journal of Management Studies41:799–825.10.1111/j.1467-6486.2004.00454.xSearch in Google Scholar
Kogut, B., and U.Zander. 1992. “Knowledge of the Firm, Combinative Capabilities, and the Replication of Technology.” Organization Science3 (3):383–97.10.1287/orsc.3.3.383Search in Google Scholar
Landström, H. ed. 2007. Handbook of Research on Venture Capital. UK: Edward Elgar Publishing.10.4337/9781847208781Search in Google Scholar
Langley, A.1999. “Strategies for Theorizing From Process Data.” Academy of Management Review24:691–710.10.5465/amr.1999.2553248Search in Google Scholar
Levitt, B., and J. G.March. 1988. “Organizational Learning.” Annual Review of Sociology14:319–40.10.1146/annurev.so.14.080188.001535Search in Google Scholar
Li, Y.2008. “Duration Analysis of Venture Capital Staging: A Real Options Perspective.” Journal of Business Venturing23 (5):497–512.10.1016/j.jbusvent.2007.10.004Search in Google Scholar
Likert, R.1932. “Technique for the Measure of Attitudes.” Archives of Psychology22 (140):1–55.Search in Google Scholar
Lo, A., and S. V.Naraharisetti. 2014. “New Financing Methods in the Biopharma Industry: A Case Study of Royalty Pharma, Inc.” Journal of Investment Management12 (1):4–19.Search in Google Scholar
Markowitz, H.1952. “Portfolio Selection.” Journal of Finance7 (1):77–91.Search in Google Scholar
Markowitz, H.1959. Portfolio Selection: Efficient Diversification of Investments. New York: John Wiley & Sons.Search in Google Scholar
Maula, M., T.Keil, and S. A.Zahra. 2003. Corporate venture capital and recognition of technological discontinuities In Academy of Management Annual Meeting, Seattle, WA, August: 1–6.Search in Google Scholar
Maurer, I., and M.Ebers. 2006. “Dynamics of Social Capital and Their Performance Implications: Lessons from Biotechnology Start-Ups.” Administrative Science Quarterly51 (2):262–92.10.2189/asqu.51.2.262Search in Google Scholar
Mouri, N., M. B.Sarkar, and M.Frye. 2012. “Alliance Portfolios and Shareholder Value in Post-IPO Firms: The Moderating Roles of Portfolio Structure and Firm-Level Uncertainty.” Journal of Business Venturing27 (3):355–71.10.1016/j.jbusvent.2011.02.002Search in Google Scholar
Ozcan, P., and K. M.Eisenhardt. 2009. “Origin of Alliance Portfolios: Entrepreneurs, Network Strategies, and Firm Performance.” Academy of Management Journal52 (2):246–79.10.5465/amj.2009.37308021Search in Google Scholar
Park, H. D., and H. K.Steensma. 2013. “The Selection and Nurturing Effects of Corporate Investors on New Venture Innovativeness.” Strategic Entrepreneurship Journal7 (4):311–30.10.1002/sej.1165Search in Google Scholar
PriceWaterHouseCoopers. 2012. The MoneyTreeTM Report.Search in Google Scholar
Rind, K. W.1981. “The Role of Venture Capital in Corporate Development.” Strategic Management Journal2 (2):169–80.10.1002/smj.4250020206Search in Google Scholar
Rothaermel, F. T.2001. “Complementary Assets, Strategic Alliances, and the Incumbent’s Advantage: An Empirical Study of Industry and Firm Effects in the Biopharmaceutical Industry.” Research Policy30 (8):1235–51.10.1016/S0048-7333(00)00142-6Search in Google Scholar
Rothaermel, F. T., and D. L.Deeds. 2004. “Exploration and Exploitation Alliances in Biotechnology: A System of New Product Development.” Strategic Management Journal25 (3):201–21.10.1002/smj.376Search in Google Scholar
Schildt, H. A., M. V. J.Maula, and T.Keil. 2005. “Explorative and Exploitative Learning from External Corporate Ventures.” Entrepreneurship Theory and Practice29 (4):493–515.10.1111/j.1540-6520.2005.00095.xSearch in Google Scholar
Sorenson, O., and T. E.Stuart. 2001. “Syndication Networks and the Spatial Distribution of Venture Capital Investments.” American Journal of Sociology106 (6):1546–88.10.1086/321301Search in Google Scholar
Srivastava, M. K., and D. R.Gnyawali. 2011. “When Do Relational Resources Matter? Leveraging Portfolio Technological Resources for Breakthrough Innovation.” Academy of Management Journal54 (4):797–810.10.5465/amj.2011.64870140Search in Google Scholar
Strauss, A., and J.Corbin. 1990. Basics of Qualitative Research: Grounded Theory Procedures and Techniques. Newbury Park, CA: Sage.Search in Google Scholar
Tong, T. W., and Y.Li. 2011. “Real Options and Investment Mode: Evidence from Corporate Venture Capital and Acquisition.” Organization Science22 (3):659–74.10.1287/orsc.1100.0551Search in Google Scholar
Trigeorgis, L.1996. Real Options: Managerial Flexibility and Strategy in Resource Allocation. Boston: MIT press.Search in Google Scholar
Vassolo, R. S., J.Anand, and T. B.Folta. 2004. “Non-Additivity in Portfolios of Exploration Activities: A Real Options-Based Analysis of Equity Alliances in Biotechnology.” Strategic Management Journal25:1045–61.10.1002/smj.414Search in Google Scholar
Wadhwa, A., and S.Kotha. 2006. “Knowledge Creation through External Venturing: Evidence From the Telecommunications Equipment Manufacturing Industry.” Academy of Management Journal49 (4):819–35.10.5465/amj.2006.22083132Search in Google Scholar
Yang, Y., V. K.Narayanan, and D. M.De Carolis. 2014. “The Relationship between Portfolio Diversification and Firm Value: The Evidence From Corporate Venture Capital Activity.” Strategic Management Journal35:1993–2011.10.1002/smj.2190Search in Google Scholar
Yin, R. K.1994. Case Study Research – Design and Methods, 2nd Edn. Thousand Oaks, CA: Sage.Search in Google Scholar
Zahra, S. A.1996. “Technology Strategy and New Venture Performance: A Study of Corporate-Sponsored and Independent Biotechnology Ventures.” Journal of Business Venturing11 (4):289–321.10.1016/0883-9026(95)00128-XSearch in Google Scholar
Zahra, S. A., and J. G.Covin. 1995. “Contextual Influences on the Corporate Entrepreneurship-Performance Relationship: A Longitudinal Analysis.” Journal of Business Venturing10 (1):43–58.10.1016/0883-9026(94)00004-ESearch in Google Scholar
©2015 by De Gruyter
Articles in the same Issue
- Frontmatter
- Editors’ Corner
- The Role of Sunk Cost and Slack Resources in Innovation: A Conceptual Reading in an Entrepreneurial Perspective
- Competitive Research Articles
- Identify Innovative Business Models: Can Innovative Business Models Enable Players to React to Ongoing or Unpredictable Trends?
- Public Research Support for an Innovative Integrated Payment Model of Service Delivery
- Balancing Risk and Learning Opportunities in Corporate Venture Capital Investments: Evidence from the Biopharmaceutical Industry