Effect of various formulation ingredients on thermal characteristics of PVC/clay nanocomposite foams: experimental and modeling
-
Mehdi Moghri
 ,
Elena Niculina Dragoi
,
Elena Niculina Dragoi

Abstract
The effect of various ingredients – nanoclay (NC), azodicarbonamaide (ADCA), paraloeid K-400 and calcium stearate (Ca.St) – on thermal behavior of melt blended poly (vinyl chloride)/NC nanocomposites was investigated. Combinations of two artificial intelligence algorithms were performed for modeling of the systems. The formulation ingredients affect the thermal features of the compounds. Upon increasing the effect of various ingredients, i.e. NC, ADCA, K-400 and Ca.St, an increase in ash content was observed, hence, the thermal stability increased. The effect of ingredients on initial degradation temperature (T5%) and half degradation temperature (T50%) was not obvious. The artificial neural network (model) and the clonal selection algorithm (optimizer) were performed for proper modeling of the systems. These models were used to determine the role of T5%, T50% and char based on the contents of ingredients. The result successfully modeled the process parameters.
1 Introduction
Poly (vinyl chloride) (PVC), a thermoplastic material, is intensively used because of its low cost and valuable properties. PVC-based foamed products can be produced by melt extrusion with inclusion of a chemical blowing agent, which produces a gas such as nitrogen or carbon dioxide. Polymer-layered silicate nanocomposites with nanoscale dispersion of nanoclay (NC) show very large improvements in different properties, even at small amounts of NC.
Many approaches have been developed to examine the thermal stability of polymer/clay nanocomposites in general (1), (2), (3), (4), (5), and in particular, of PVC/clay nanocomposite (6), (7), (8), (9). For example, Gong et al. (10) and Liang et al. (11) reported that organo-montmorillonite (OMMT) enhance decomposition. Moreover, they indicated that the maximum decomposition (Tmax) and the onset decomposition temperature (Tonset) are reduced. Quaternary ammonium in the nanocomposites was found to be responsible for the acceleration of the polymer decomposition (12), (13). The stability of PVC/OMMT nanocomposites revealed that upon increasing OMMT loading, the processing stability deteriorates because of initiation of PVC degradation (14), (15), (16). This indicates the catalytic effect of clay. In general, cationic intercalants were found to accelerate the dehydrochlorination of PVC whereas the non-ionic did not affect thermal degradation (17). However, some non-ionic intercalants showed poor dispersion capacity. As shown in the literature, the degree of dispersion (18), MMT content (19), synthesis method (20), and the level of interaction (either intercalation or exfoliation) (21) can affect the property profiles of nanocomposites.
Artificial intelligence (AI) is the knowledge required to make intelligent machines (22). It is used in engineering to solve complicated problems normally requiring human intelligence. Expert system (ES), genetic algorithm (GA), fuzzy logic (FL), artificial neural network (ANN), simulated annealing (SA), ant colony optimization (ACO), particle swarm optimization (PSO) are some examples of AI subgroups. An artificial intelligence system (AIS) is inspired from the response of mammalian organisms when attacked. There are four mechanisms commonly used in the AIS approaches: negative selection, positive selection, clonal selection (CS), and immune network (23). From these mechanisms, CSs are used to perform the optimization. The main immunological elements are: i) memory set maintenance; ii) selection and cloning of most stimulated antibodies; iii) removal of worst antibodies; iv) affinity maturation; v) generation and maintenance of an antibody set.
ANNs are inspired from the biological brain and can estimate a process behavior even when incomplete information is available (24). They have a strong generalization capability and are an effective way to solve complex non-linear mapping problems (25). Although easy to use, ANNs are difficult to set-up, their optimal structure depending on the problems being solved. In addition, the rules generated for setting and ANN are sometimes contradictory and not always applicable. An approach to overcome this problem is to employ an optimization procedure for automatically setting up all the ANN parameters. Many applications of ANN have been reported. Among them, chemometrics and intelligent laboratory systems for modeling of machining process (22), sensors (26), synthesis (24), (27), behavior (28), fusion (29) and extraction (30), (31) are practically investigated.
In the current study, the effect of vital formulation parameters (NC, blowing agent, processing aid, and internal lubricant content) on the thermal properties of melt-blended rigid PVC/NC nanocomposite foams using thermogravimetric analysis (TGA) were investigated. The ANN was used in order to predict maximum degradation temperature (T5%), T50% and char using experimental data. Moreover, AISs are used for performing this task.
2 Experimental
2.1 Materials and sample preparation
Suspension grade PVC – K-value 65, Vestolite S6558, Mw=90,000, Mn=40,000 and PDI=2.25 – was provided by Bandar-e-Imam Petrochemical (Mahshahr, Khozestan, Iran). An acrylic processing aid, Paraloid K-400, was purchased from Rohm and Haas (PHL, PA, USA). The NC (Cloisite 30B) was supplied from Southern Clay Products (Gonzaless, TX, USA). All other ingredients were commercial grade products.
Table 1 shows the nanocomposites formulation were prepared using a laboratory high speed mixer. Primarily, the ingredients were loaded into the mixer containing PVC for ~20 min to obtain dry blends. The fusion behavior of each dry blend was melted in a Brabender Plasticorder, PL 2000, equipped with a 65 cm3 mixing chamber, at 165°C and 60 rpm, for 3 min.
PVC formulation.
| Ingredient | Parts |
|---|---|
| PVC-S (K-65) | 100 |
| Dibasic Pb stearate | 3 |
| Neutral Pb stearate | 0.7 |
| Calcium stearate | 0.2–0.6 |
| Stearic acid | 0.5 |
| Impact modifier | 0.5 |
| Nanoclay | 2–6 |
| ADCA | 0.2–0.6 |
| Wax | 0.2 |
| K-400 | 4–8 |
2.2 Characterization
The X-ray diffraction (XRD) patterns of the samples were obtained in the 2θ range of 5–70° using a Philips MPDx pert X-ray. The thermogravimetric analysis was conducted using a TG-DTA Perkin-Elmer TGA (USA) at heating rates of 20°C/min, under nitrogen atmosphere.
2.3 Artificial intelligence modeling
In the current study, for creating an efficient model, ANNs and CS-ANN were used. CS is the optimizer added for determining the optimal parameters of the ANN. CS was chosen to solve the problems (23).
The main steps of the CS algorithm are initialization, selection of the set of antibodies for cloning, hypermutation of clones in order to create new individuals with improved capabilities and receptor editing. In the initialization step, a set of antibodies is generated using uniform distribution probability. In order to improve this step, the opposition based learning (OBL) principle is applied. OBL was developed by Tizhoosh (32) as a new scheme for machine intelligence. It is based on the idea that the probability of an individual x to be better than its opposite
The antibodies with the best affinity select for cloning. The clones are then hypermutated using a hypermutation operator. This operator is based on three types of hypermuations (Gaussian, non-uniform and pair wise). Using a random number generator, each time after hypermutation, one of the operators is randomly chosen. The main idea behind this approach is to explore the multiple search directions, and to reduce the probability of getting stuck in local minima.
In the receptor-editing step of the algorithm, the selection of the antibodies for the new generation is performed. The remaining antibodies are replaced with new ones, hence, diversity is being introduced into the population.
Finally, the best solution found by randomly applying the back propagation (BK) or random search algorithm. This variant is an improvement of previously proposed CS-ANN combination called the normalized clonal selection multilayer perceptron neural network and back propagation (nCS-MBK). Differential evolution approaches lead to appropriate results as applied to the model of siloxane organic polyazomethine synthesis process.
The algorithm scheme performed for modeling the process is presented in Figure 1.
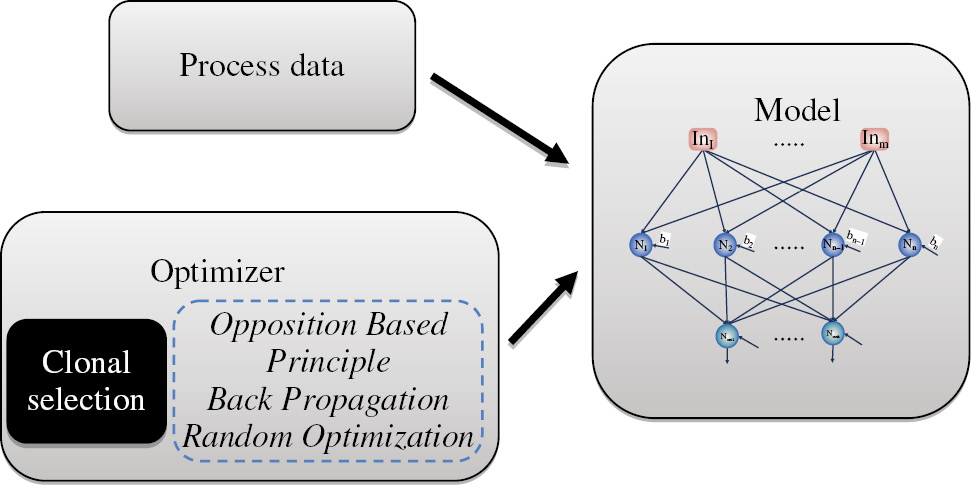
Simplified schema of the modeling methodology.
In the literature, various sorts of parameters are reported to be optimized by algorithms such as connection weights, architecture, learning rules and node behavior (23). In the current study, three categories are evolved; weights, architecture and node behavior.
Optimizing the weights is related to the training procedure, optimizing the architecture implies the identification of the best structure of the ANN (number of hidden layers and number of neurons in each hidden layer), and node behavior is related to the functionality of the nodes (transfer functions). Here, the node can be one of the following transfer functions: linear, bipolar sigmoid, logarithmic sigmoid, tangent sigmoid, sinus, radial basis, triangular basis and logistic. Although, it is possible to explore the multitude of the functions based on a series of practical considerations.
There are various types of ANN models. Among them, the multilayer perceptron feed forward artificial neural network (MLP) has generated great interest. It is a fully coupled ANN, and each input activates all the hidden nodes. The MLP usually has one or more hidden layers, which enable the network to model non-linear and complex functions. Nevertheless, the number of hidden layers is difficult to decide. One hidden layer is normally adequate to provide an accurate prediction and can be the first choice for any practical feed-forward network design.
It is crucial to highlight that the determination of the number of neurons in hidden layers is very important as it affects the training time and generalization property of neural networks. A higher value of neurons in the hidden layer may force the network to memorize (as opposed to generalize) the patterns which have been observed during the training, whereas a lower value of neurons in the hidden layer will waste a great deal of training time in finding its optimal representation. However, there is no general rule used in selecting the number of neurons in a hidden layer. Thus, it is dependent on the complexity of the study system being modeled.
As the dimensionality of the model (number of hidden layers and neurons in the hidden layer) influences the computational costs and there must be a correlation between the training/testing exemplars and model complexity, a series of limitations were imposed on the architecture of the model, which is automatically determined by the optimization procedure. Consequently, the model can have a maximum of two layers with a maximum of 15 and 10 neurons, respectively. On the other hand, in this work, the number of inputs and outputs is determined by the process characteristics, the inputs being represented by NC, ADCA, K-400 and Ca.St and the outputs by T5%, T50% and char.
3 Results and discussion
3.1 X-ray diffraction analysis
The extent of interactions and formation of nanocomposites were measured using XRD. Among all samples, 14 samples were selected for XRD analysis. As shown in Figure 2, the XRD diffractograms of all the samples are almost the same. A broad peak at around 2θ=25° is due to PVC (Figure 2–inset). A very intense peak at 2θ=10° and 28 in some samples (4), (8), (11) is due to a low interaction between NC and PVC. However, samples 13, 14, 15 and 18 are mostly exfoliated.
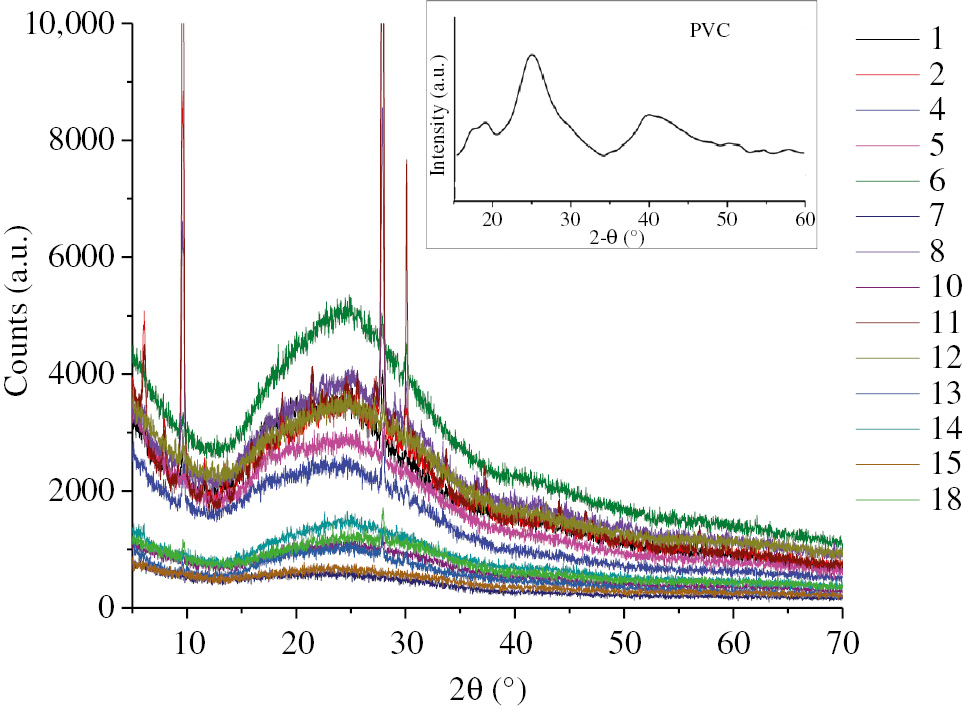
XRD patterns of PVC and PVC/NC nanocomposites.
3.2 The effect of incorporated ingredients on ash content
Figure 3A shows an obvious increase in ash content versus NC. Upon increasing NC content from 2 to 4 phr, an increase in ash content can be observed. This is due to the barrier effect of the silicate layer, which further affect flame retardancy of the system (5). However, because of clay aggregation in the polymer matrix, further increase in clay content up to 6 phr does not influence the amount of ash content. The so-called phenomenon indicates that the sample with 4 phr clay can be considered as an optimum point.
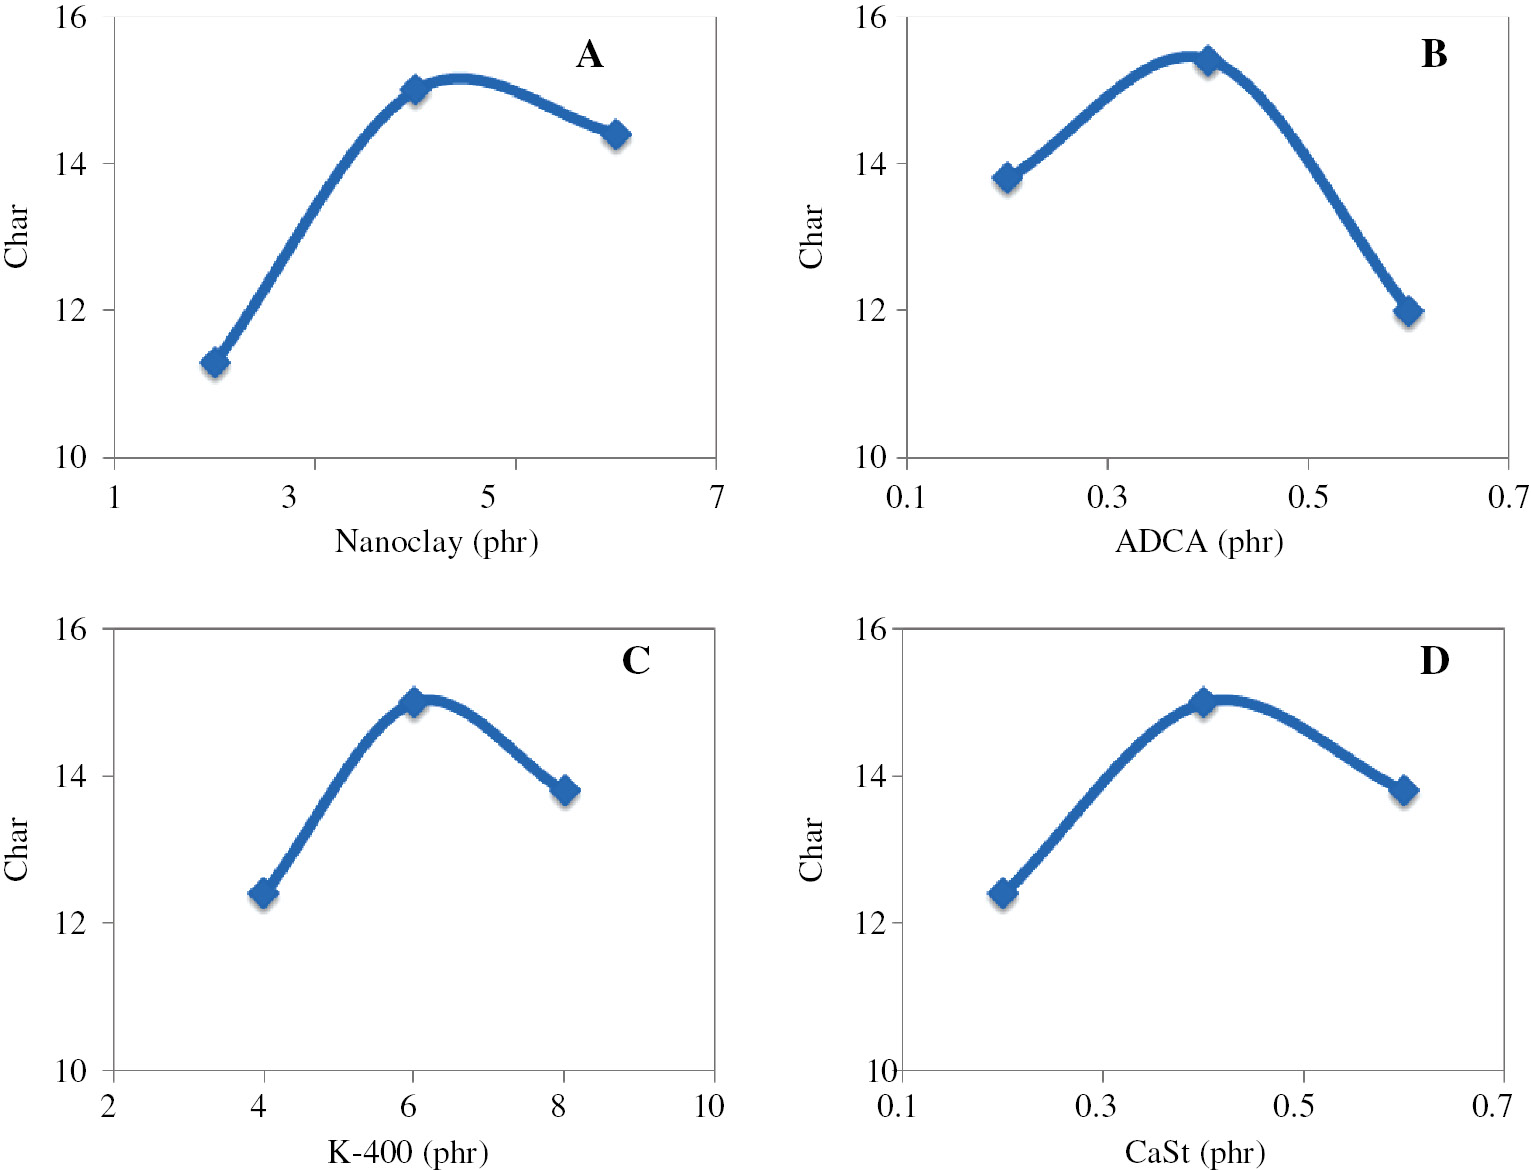
The effect of nanocomposite ingredients on the ash content yielded from TG analysis; (A) clay content (phr), (B) ADCA (phr), (C) K-400 (phr), (D) Ca.St. (phr).
The NC may impart two opposite functions into the thermal properties of nanocomposites; barrier effect which improve the thermal stability and a catalytic effect that can impair stability (33). In the current study, a proper incorporation of PVC chain into the silicate layers shows diminution in degradation maxima and reaction profile as compared to the neat PVC. The authors assume that this phenomenon is due to the catalytic effect of Lewis acid sites in silicate layers by catalyzing the hydrolysis of polymer linkages. Moreover, Bordes et al. (34) expressed that the surfactants enhance the degradation of polymer according to the Hoffmann elimination reaction or a nucleophilic attack of ammonium counter-ion. Moreover, the silicate layers can act as a heat source by holding accumulated heat to accelerate the decomposition of the polymer.
Interestingly, by comparison between the samples with various NC content but the same amount of other ingredients, i.e. ADCA, K-400, and Ca.St, the ash content gradually increases. This trend is directly related to the content of the other ingredients. Moreover, upon increasing the NC content, a reduction in Tmax is observed. This is true when the content of other ingredients in the samples are the same. This is most probably due to the catalytic effect of NC in the nanocomposites (19), (35). The results are listed in Table 2.
Differential thermographic curve parameters of various samples.
| Ingredients | NC/ADCA/K-400/Ca.St (phr) | Tmax1 (°C) | Tmax2 (°C) | Tmax3 (°C) |
|---|---|---|---|---|
| NC | 2/0.2/8/0.6 and 6/0.2/8/0.6 | 225–85 | 297–224 | 457–492 |
| 2/0.2/8/0.2 and 6/0.2/8/0.2 | 225–219 | 298–292 | 457–457 | |
| 2/0.6/4/0.2 and 6/0.6/4/0.2 | 226–218 | 297–291 | 463–457 | |
| 6/0.2/4/0.6 and 4/0.2/4/0.6 | 224–217 | 294–285 | 452–446 | |
| 2/0.6/8/0.6 and 6/0.6/8/0.6 | 218–212 | 293–283 | 451–442 | |
| 2/0.4/6/0.4 and 6/0.4/6/0.4 | 221–214 | 294–292 | 453–457 | |
| 2/0.6/8/0.2 and 6/0.6/8/0.2 | 217–213 | 289–288 | 456–451 | |
| ADCA | 2/0.2/8/0.6 and 2/0.6/8/0.6 | 225–218 | 297–293 | 457–451 |
| 4/0.6/4/0.4 and 4/0.4/4/0.4 | 222–221 | 293–294 | 457–459 | |
| 6/0.2/8/0.2 and 6/0.6/8/0.2 | 219–213 | 292–288 | 457–451 | |
| K–400 | 6/0.6/4/0.6 and 6/0.6/8/0.6 | 221–212 | 290–283 | 458–442 |
| 6/0.2/4/0.2 and 6/0.2/4/0.2 | 216–219 | 285–292 | 441–457 | |
| 2/0.6/8/0.6 and 2/0.6/4/0.6 | 218–224 | 293–295 | 451–457 | |
| Ca.St | 2/0.2/8/0.6 and 2/0.2/8/0.2 | 225–225 | 297–298 | 457–457 |
| 2/0.6/4/0.2 and 2/0.6/4/0.6 | 226–224 | 297–295 | 463–457 | |
| 6/0.2/4/0.6 and 6/0.2/4/0.2 | 217–216 | 285–285 | 446–441 | |
| 2/0.6/8/0.6 and 2/0.6/8/0.2 | 218–217 | 293–289 | 451–456 |
Upon increasing ADCA (Figure 3B), the ash content first increases in the sample with 0.2–0.4 phr ADCA. However, this trend decreases in the sample containing 0.6 phr of ADCA. It must be mentioned that an optimal trend can be obtained in 0.4 phr. The ascending order in the low-to-middle region can be attributed to the population of cells due to ADCA foaming agent. This decreasing trend is typically associated with the formation of large cells having thin skins. These cells can be easily cracked ending in enhanced burning of neat PVC.
In a study on the samples with the same NC, K-400 and Ca.St content and different ADCA content, the ash content gradually increased (Table 2). Thus, a decrease in the thermal degradation profile, i.e. Tmax can be also observed in most of the as mentioned samples.
The effect of Ca.St on the ash content of the blends is shown in Figure 3C. The results indicate that upon increasing Ca.St, the ash content increases. However, this trend is not linear. The first increase in ash content could be due to enhanced interlayer distance, or the complicated mechanism of polymeric chain decomposition by Ca.St, whereas, a decrease in ash content might be due to the retardation effect at elevated concentrations of Ca.St (36).
A comparison between the samples containing various K-400 contents shows that in these samples, the ash content gradually increases from 6.1 to 16.9 mg, 3.1 to 17.4 mg and 9.92 to 15.8 mg. Moreover, the increase of K-400 leads to a slight decrease of Tmax1, Tmax2 and Tmax3.
Likewise, the trend in ash content passes an optimum in the case of K-400 (Figure 3D). This would be a characteristic of enhanced dispersion of NC in a polymer matrix, which can be due to the complete interaction. Moreover, it was found that upon increasing the Ca.St content in the samples with the same NC, ADCA, and K-400, the char gradually increases. Based on maximum degradation temperatures, upon increasing Ca.St content, Tmax1, Tmax2 and Tmax3 are decreased.
3.3 The effect of incorporated ingredients on T5%
Figure 4 shows the effect of the concentrations of ingredients on the initial mass loss (T5%) of PVC/NC nanocomposites. Analyzing the results based on this criterion, contradictory behaviors considering fluctuations over ingredient concentrations are observed. The optimal trend over NC content (Figure 4A) can be caused by surface modifier concentration attached on the clay surface. In general, the decomposition initiates due to surface modifier degradation at around 200°C.
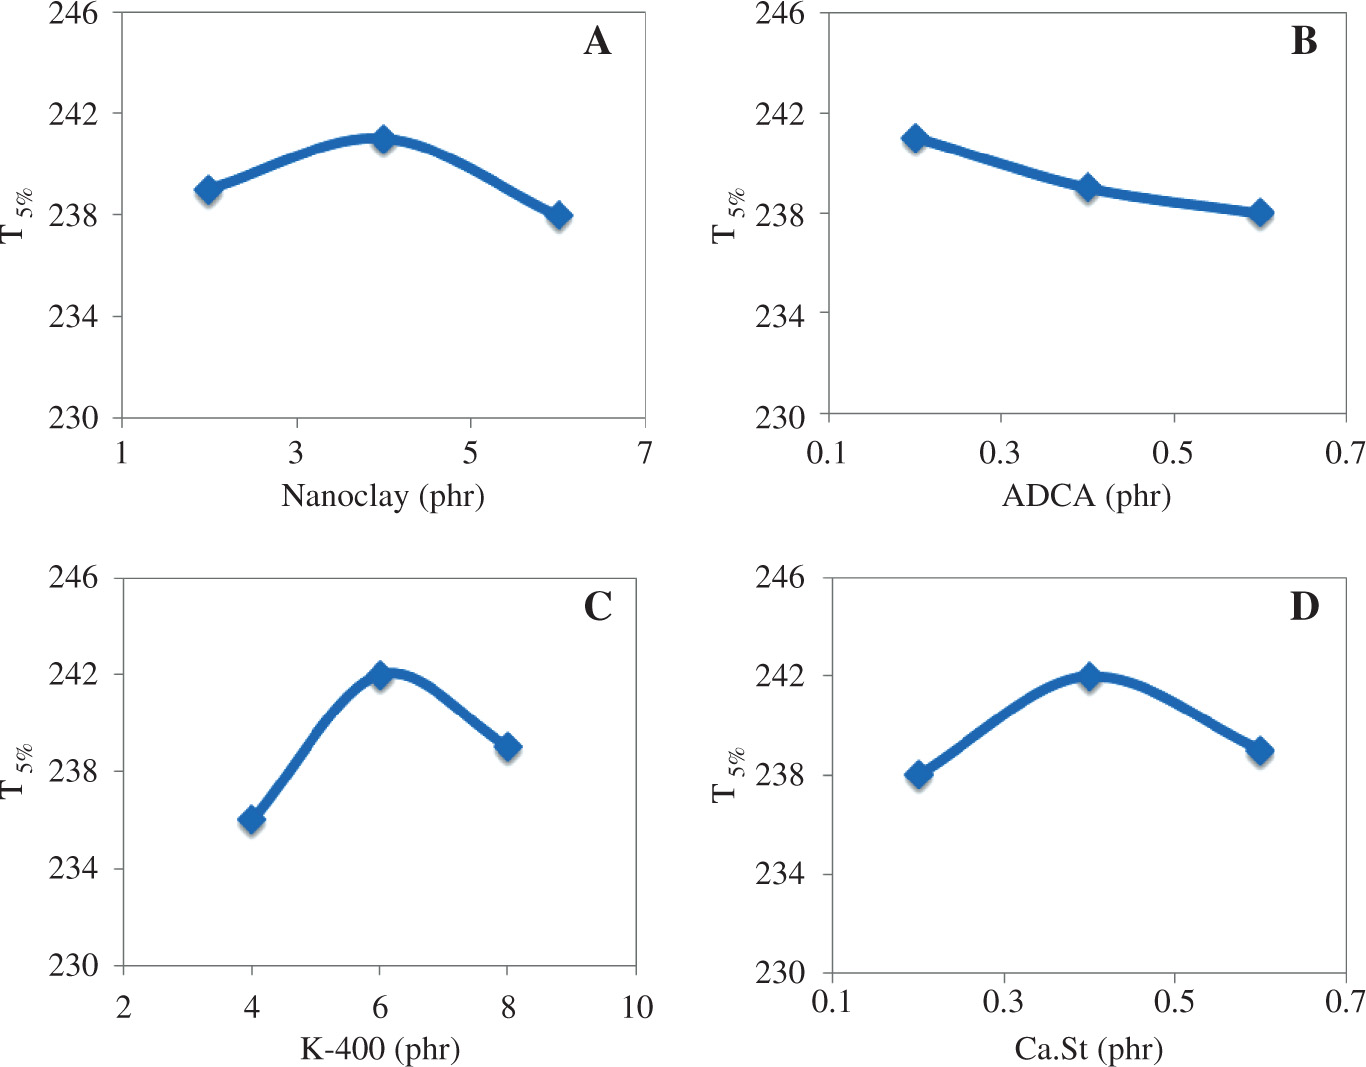
The effect of nanocomposite ingredients on the T5% yielded from TG analysis; (A) clay content (phr), (B) ADCA (phr), (C) K-400 (phr), (D) Ca.St. (phr).
In the early step, by increasing ADCA from 0.2 to 0.4 phr, T5% is not influenced as thermal decomposition affects mainly cell walls. A further increase of ADCA concentration causes a decrease in thermal decomposition degree, most probably due to the effect of ADCA in the intercalation of clay platelets (Figure 4B). As illustrated in Figure 4C and D, a similar trend was observed, i.e. an increase in K-400 and Ca.St leads to the alteration of ash content.
The results indicate that the presence of ADCA, K-400 and Ca.St affect the dispersion of clay in the polymer matrix. Moreover, the barrier effect is much greater and dominates the catalytic effect of clay. However, a decrease in T5% is observed almost in all the PVC/NC samples, most probably due to the un-interacted modifiers presence on the surface of silicate layers.
3.4 The effect of incorporated ingredients on T50%
Figure 5A and B show the relation between NC and ADCA incorporated in polymer matrix versus T50%. The trend is almost linear due to the irrespective effect of NC and ADCA on T50%. It can be concluded that at T50% the polymer degradation is higher than in other ingredients. A linear trend with a positive slope indicates that T50% increases upon the increase of K-400 content (Figure 5C). This phenomenon was observed in the range of 4–8 phr of K-400. In fact, K-400 increases the uniformity and stability of the cells. In the case of Ca.St, the trend is not linear. The results indicate that upon increasing Ca.St, approximately a similar trend of degradation can be observed in both 50% (Figure 5D) and 5% mass loss. Here, the initial increase indicates homogenous dispersion of nano particles in the polymer matrix. The better dispersion affects the strength properties of the systems by controlling the easy motion of the polymer. However, this decreasing trend associated with higher Ca.St content maybe due to the incomplete interaction over formation of agglomeration.
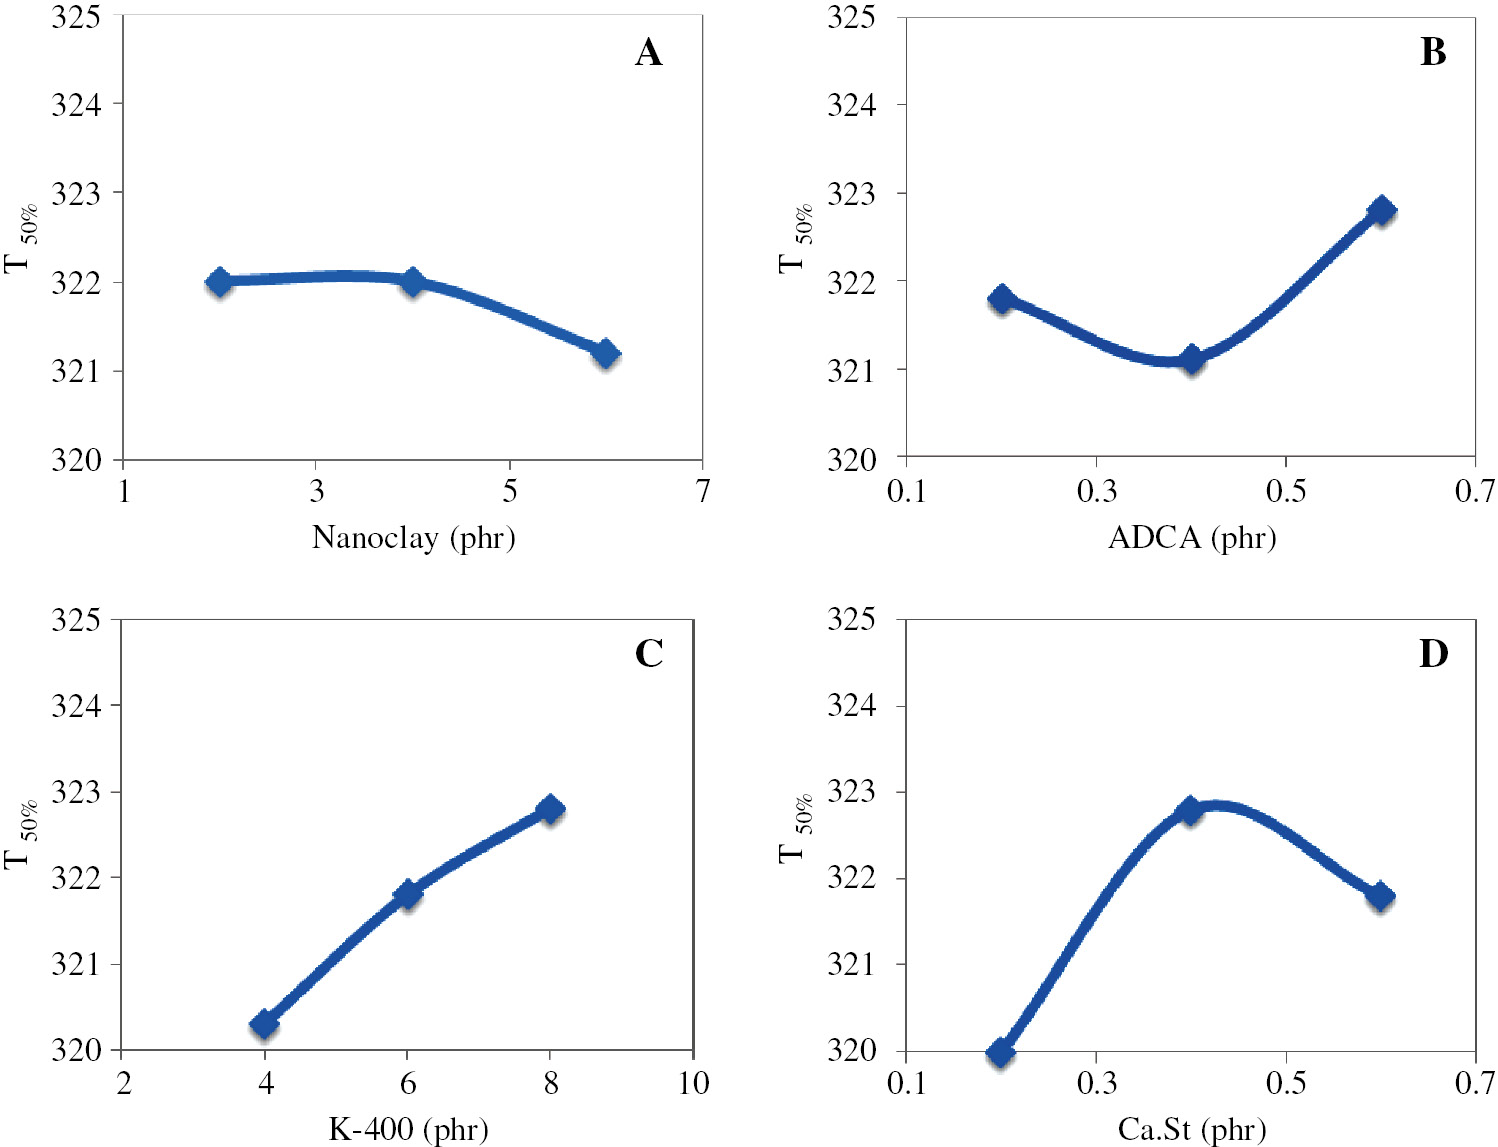
The effect of nanocomposite ingredients on T50% yielded from TGA analysis; (A) clay content (phr), (B) ADCA (phr), (C) K-400 (phr), (D) Ca.St (phr).
3.5 Modeling
In order to model the process, the experimental data was divided into training (75%) and testing (25%). These percentages were chosen based on practical considerations, and based on ANN. A set of 10 simulations were performed based on the CS approach, the preliminary results indicating that, due to the different influences of the inputs on the outputs, generating a single model with all the three outputs is not feasible. Therefore, the initial model with four inputs and three outputs split into three models, each having four inputs and one output. The average results for 50 simulations and the best model (based on fitness function) for the model structure is presented in Table 3. The architecture is denoted with x, y and z indicating the number of inputs, neurons in the hidden layer and outputs, respectively.
Simulations results for the models corresponding to the three parameters.
| Parameter | Model | Fitness | MSE training | MSE testing | Architecture |
|---|---|---|---|---|---|
| T5% | Best | 22.36534 | 0.044712 | 0.193413 | 4:6:5:1 |
| Worst | 11.3628 | 0.088007 | 0.199746 | 4:8:2:1 | |
| Average | 13.01117 | 0.079735 | 0.196097 | – | |
| T50% | Best | 21.63917 | 0.046213 | 0.12844 | 4:7:4:1 |
| Worst | 10.39663 | 0.096185 | 0.192967 | 4:3:1 | |
| Average | 11.7777 | 0.087189 | 0.187332 | – | |
| Char | Best | 14.59768 | 0.068504 | 0.098263 | 4:8:5:1 |
| Worst | 8.226412 | 0.12156 | 0.123007 | 4:10:1 | |
| Average | 9.344392 | 0.108373 | 0.131512 | – |
The fitness function used to determine the best ANN model for each parameter is based on the MSE in the training phase (Eq. 1),
The methodology determines one and two hidden layer models; however, the best one is neural networks with two hidden layers. This indicates that the inner relations between process conditions and the output parameters are complicated to model the process with simple relations.
The main parameters of three ANN models considered for T50% and char are listed in Table 4. Each model is referred to its architecture. The neuron is denoted as H(a.b) in the hidden layer (a is the number of hidden layers and b is the number of neurons in the layer). The activation functions corresponding to neurons are denoted as li for linear, tanh for bipolar sigmoid, logsig for logarithmic sigmoid, tansig for tangent sigmoid, sin for sinus, radbas for radial basis, tribas for triangular basis and logi for logistic.
Neuron characteristics for the best models determined for the process parameters.
| Model | Type of layer | Bias | Activation function |
|---|---|---|---|
| 4:6:5:1 | First hidden layer | H(1.1): 0.262 H(1.2): 0.606 | H(1.1): tansig H(1.2): tansig |
| H(1.3): 0.544 H(1.4): 0.131 | H(1.3): tansig H(1.4): logsig | ||
| H(1.5): –1.272 H(1.6): –0.113 | H(1.5): tansig H(1.6): tansig | ||
| Second hidden layer | H(2.1): –0.106 H(2.2): 0.031 | H(2.1): logsig H(2.2): tansig | |
| H(2.3): 0.033 H(2.4): 1.241 | H(2.3): tansig H(2.4): tansig | ||
| H(2.5): 0.099 | H(2.5): tansig | ||
| Output | O(1): 0.462 | O(1): tansig | |
| 4:7:4:1 | First hidden layer | H(1.1): –0.513 H(1.2): 0.390 | H(1.1): logsig H(1.2): logsig |
| H(1.3): –0.165 H(1.4): 0.703 | H(1.3): tansig H(1.4): tansig | ||
| H(1.5): 0.685 H(1.6): –0.165 | H(1.5): logsig H(1.6): tansig | ||
| H(1.7): –0.216 | H(1.7): logsig | ||
| Second hidden layer | H(2.1): –0.105 H(2.2): –0.113 | H(2.1): tansig H(2.2): tansig | |
| H(2.3): –0.184 H(2.4): –1.816 | H(2.3): tansig H(2.4): logsig | ||
| Output | O(1): –0.001 | O(1): tansig | |
| 4:8:5:1 | First hidden layer | H(1.1): –0.397 H(1.2): –1.018 | H(1.1): tansig H(1.2): tansig |
| H(1.3): 0.113 H(1.4): 0.334 | H(1.3): tansig H(1.4): logsig | ||
| H(1.5): –0.214 H(1.6): 0.666 | H(1.5): tansig H(1.6): tansig | ||
| H(1.7): –0.098 H(1.8): –1.069 | H(1.7): logsig H(1.8): tansig | ||
| Second hidden layer | H(2.1): –0.246 H(2.2): 0.730 | H(2.1): logsig H(2.2): tansig | |
| H(2.3): 0.259 H(2.4): 0.178 | H(2.3): logsig H(2.4): logsig | ||
| H(2.5): –0.524 | H(2.5): logsig | ||
| Output | O(1): –0.011 | O(1): logsig |
Although, the neurons can bear one of the eight activation functions (Table 4). In all the models, the neurons have only logsig and tansig functions. Logsig converts the input and transforms it into the range (0,1), while, tansig transforms the input into (–1,1). One explanation for the automatic process favoring these non-linear functions is that prior to training and testing, the data is normalized in the interval (–1,–1). Consequently, the application of these functions keep the interval unchanged and the internal penalty function is eliminated.
The performance of three-parameter models is also assessed by comparing the predictions and the experimental data (Figure 6). In all three cases, for the testing data (which was randomly selected from the experimental set), the average absolute relative error (AARE) and correlation were computed, 2.65% and 0.49 (for T5%), 1.11% and 0.74 (for T50%), 11.14% and 0.70 (for char). In the case of T5%, the correlation is very low and the MSE in the testing phase is highest. The training phase and consequently its fitness achieve a good value. It can be deduced that the generalization capability of the model is low. On the other hand, for T50%, the AARE attains the lowest value but highest correlation.
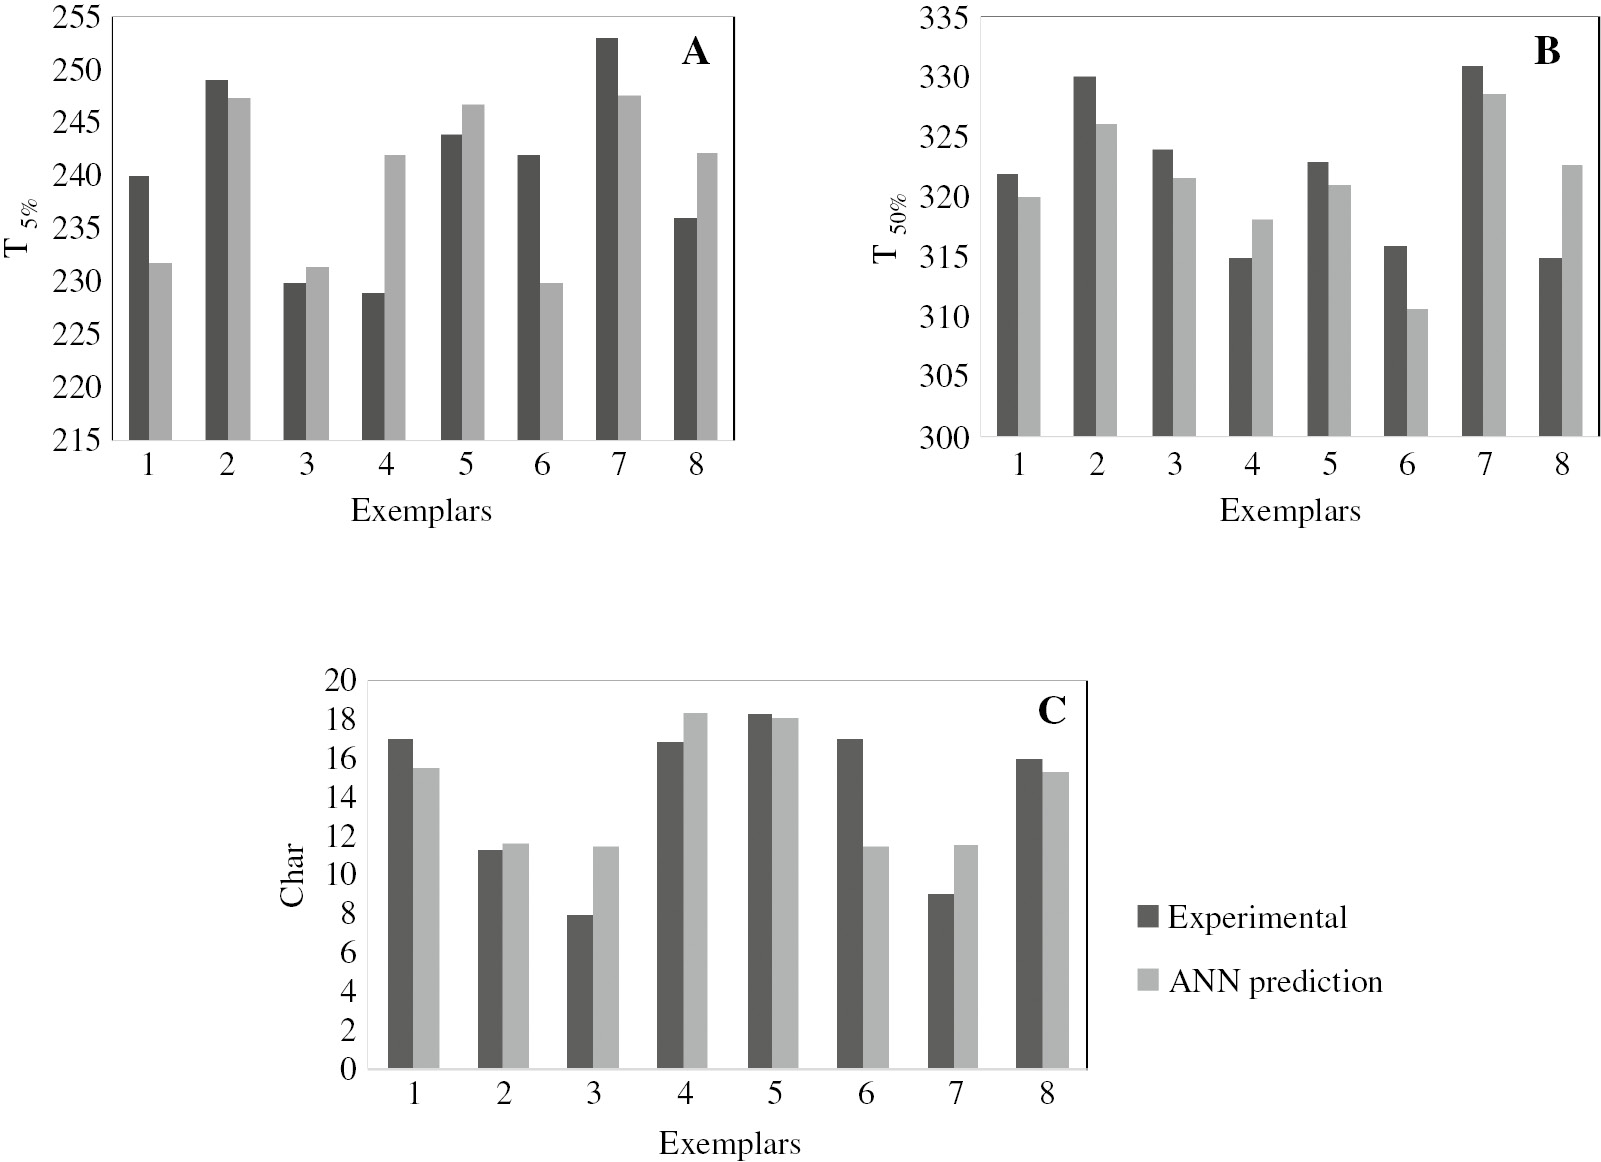
Comparison between the neural network predictions and the experimental data for the testing dataset; (A) T5%, (B) T50% and (C) Char vs. exemplars.
4 Conclusions
In this work, the thermal characteristics of rigid PVC nanocomposite foams were prepared via melt interaction by changing material variables (NC, ADCA, K-400, and Ca.St). The effect of incorporated ingredients on the ash content shows that upon increasing all ingredients content, the ash content also increased. Moreover, comparison between various couple of the samples with one variable but the same amount of other ingredients confirmed this assumption (increase in ash content). Further investigation on the effect of incorporated ingredients on T5% and T50% showed that a decrease in T5% in PVC nanocomposites upon increase in NC and ADCA content is most probably due to the un-interacted modifiers presence on the surface of silicate layers. However, this trend is linear in T50% for the samples containing NC and ADCA due to the indirect effect of NC and ADCA on T50%. Meanwhile, a linear trend with a positive slope indicates that T50% increases upon increasing K-400 content. Overall, it can be concluded that the thermal stability of the samples improved upon increasing ingredients.
In order to model this process, a technique combining ANNs and CS was used. The role of the ANN was to model the process, while the role of CS was to determine the structural and parametric configuration that leads to optimal results.T5%, T50% and char (outputs) were determined based on NS, ADCA, K-400 and Ca.St (inputs), for each of the three outputs a separate model being determined. The best ANN model found for T5% had a 4:6:5:1 topology and a MSE in the testing phase of 0.193. For T50%, the ANN had a 4:7:4:1 topology and 0.128 MSE in the testing phase. For char, the topology determined was 4:8:5:1 and MSE was 0.098. In all cases, the models have an acceptable error for the predicted data, the approach used for model determination providing good results.
Funding source: Iran Nanotechnology Initiative Council
Award Identifier / Grant number: 12456/92
Funding statement: The authors wish to thank P. Kiany for his support in characterization of the samples and analyzing the data. Iran Nanotechnology Initiative Council, (Grant/Award Number: 12456/92).
Acknowledgments
The authors wish to thank P. Kiany for his support in characterization of the samples and analyzing the data. Iran Nanotechnology Initiative Council, (Grant/Award Number: 12456/92).
References
1. Shaked Y, Dodiuk H, Kenig S, Mccarthy S. The effect of hyperbranched polymers on processing and thermal stability of biodegradable polyesters. Polym Eng Sci. 2009;49(3):559–66.10.1002/pen.21266Search in Google Scholar
2. Mousavioun P, Doherty WOS, George G. Thermal stability and miscibility of poly(hydroxybutyrate) and soda lignin blends. Ind Crops Prod. 2010;32(3):656–61.10.1016/j.indcrop.2010.08.001Search in Google Scholar
3. Gilman JW. Flammability and thermal stability studies of polymer layered-silicate ž clay/nanocomposites. Appl Polym Sci. 1999;15(1–2):31–49.10.1016/S0169-1317(99)00019-8Search in Google Scholar
4. Salehabadi A. Effect Of Organomodified Nanoclay In Poly (3-Hydroxybutyrate)(Phb)-,Epoxidized Natural Rubber (Enr-50) And Phb/Enr-50 Blend Nanocomposites. PhD thesis, University Sains Malaysia; 2014. Available from: http://eprints.usm.my/28958/.Search in Google Scholar
5. Salehabadi A, Abu Bakar M. Epoxidized natural rubber-organomodified montmorillonite nanohybrids; interaction and thermal decomposition. Mater Sci Forum [Internet]. 2013 May [cited 2013 Jun 27];756:119–26. Available from: http://www.scientific.net/MSF.756.119.10.4028/www.scientific.net/MSF.756.119Search in Google Scholar
6. Pagacz J, Pielichowski K. Preparation and characterization of PVC/montmorillonite nanocomposites – a review. J Vinyl Addit Technol. 2009;1(10):61–76.10.1002/vnl.20186Search in Google Scholar
7. Wang Q, Zhang X, Jin Y, Gui H, Dong W, Lai J, Liu Y, Gao J, Huang F, Song Z. Preparation and properties of PVC ternary nanocomposites containing elastomeric nanoscale particles and exfoliated sodium-montmorillonite. Macromol Mater Eng. 2006;291(6):655–60.10.1002/mame.200600023Search in Google Scholar
8. Ari GA, Aydin I. A study on fusion and rheological behaviors of PVC/SiO 2 microcomposites and nanocomposites: the effects of SiO 2 particle size. J Polym Eng Sci. 2011;10(2):1–6.10.1002/pen.21935Search in Google Scholar
9. Perera MC, Ishiaku U, Ishak ZA. Thermal degradation of PVC/NBR and PVC/ENR50 binary blends and PVC/ENR50/NBR ternary blends studied by DMA and solid state NMR. Polym Degrad Stab. 2000;68(3):393–402.10.1016/S0141-3910(00)00024-0Search in Google Scholar
10. Gong F, Feng M, Zhao C, Zhang S, Yang M. Thermal properties of poly (vinylchloride)/montmorillonite nanocomposites. Polym Degrad Stab. 2004;84(2):289–94.10.1016/j.polymdegradstab.2003.11.003Search in Google Scholar
11. Liang ZM, Yin J, Xu HJ. Polyimide/montmorillonite nanocomposites based on thermally stable, rigid-rod aromatic amine modifiers. Polymer. 2003;44(5):1391–9.10.1016/S0032-3861(02)00911-4Search in Google Scholar
12. Gao Z, Xie W, Hwu JM, Wells L, Pan W. The characterization of organic modified montmorillonite and its filled PMMA nanocomposite. J Therm Anal. 2001;64(2):467–75.10.1023/A:1011514110413Search in Google Scholar
13. Botana A, Mollo M, Eisenberg P, Torres Sanchez RM. Effect of modified montmorillonite on biodegradable PHB nanocomposites. Appl Clay Sci. 2010;47(3–4):263–70.10.1016/j.clay.2009.11.001Search in Google Scholar
14. Zheng X, Gilbert M. An investigation into the thermal stability of PVC/montmorillonite composites. J Vinyl Add Tech. 2011;17(2):71–84.10.1002/vnl.20258Search in Google Scholar
15. Zheng X, Gilbert M. Effects of processing on the structure of PVC/montmorillonite composites. I. Melt and solution processes. J Vinyl Add Tech. 2011;17(4):231–8.10.1002/vnl.20276Search in Google Scholar
16. Wang Q, Zhang X, Dong W, Gui H, Gao J, Lai J, Liu Y, Huang F, Song Z, Qiao J. Novel rigid poly(vinyl chloride) ternary nanocomposites containing ultrafine full-vulcanized powdered rubber and untreated nano-sized calcium carbonate. Mater Lett. 2007;61(4–5):1174–7.10.1016/j.matlet.2006.06.078Search in Google Scholar
17. Hemmati M, Fereidoon A, Shariatpanahi H, Ahangari MG, Narimani A. Effects of nanoclay on morphology, rheological, and mechanical properties of polyvinyl chloride/acrylonitrile-butadiene-styrene. Polym Plast Technol Eng. 2012;51(5):413–8.10.1080/03602559.2011.639837Search in Google Scholar
18. Lecouvet B, Gutierrez JG, Sclavons M, Bailly C. Structure e property relationships in polyamide 12/halloysite nanotube nanocomposites. Polym Degrad Stab. 2011;96(2):226–35.10.1016/j.polymdegradstab.2010.11.006Search in Google Scholar
19. Salehabadi A, Abu Bakar M, Abu Bakar NHH. Effect of organo-modified nanoclay on the thermal and bulk structural properties of poly(3-hydroxybutyrate)-epoxidized natural rubber blends: formation of multi-components biobased nanohybrids. Materials (Basel). 2014;7(6):4508–23.10.3390/ma7064508Search in Google Scholar PubMed PubMed Central
20. Tjong S. Structural and mechanical properties of polymer nanocomposites. Mater Sci Eng Reports. 2006;53(3–4):73–197.10.1016/j.mser.2006.06.001Search in Google Scholar
21. Theng BKG. Clay-polymer interactions: summary and perspectives. Clays Clay Miner. 1982;30(1):1–10.10.1346/CCMN.1982.0300101Search in Google Scholar
22. Mohd Adnan MRH, Sarkheyli A, Mohd Zain A, Haron H. Fuzzy logic for modeling machining process: a review. Artif Intell Rev. 2013;43(3):345–79.10.1007/s10462-012-9381-8Search in Google Scholar
23. Aickelin U, Dasgupta D. “Artificial immune systems tutorial.” A Bibliogr Comput Sci. 2010;60(4):1–29.Search in Google Scholar
24. Rizkalla N, Hildgen P. Artificial neural networks: comparison of two programs for modeling a process of nanoparticle preparation. Drug Dev Ind Pharm. 2005;31(10):1019–33.10.1080/03639040500306294Search in Google Scholar PubMed
25. Frey DD, Sudarsanam N. An adaptive one-factor-at-a-time method for robust parameter design: comparison with crossed arrays via case studies. J Mech Des. 1987;130(2):1–18.10.1115/DETC2006-99593Search in Google Scholar
26. Talaie A, Romagnoli J. Application of artificial intelligence methods in conducting polymer based sensors. Iran Polym J. 1997;6(1):53–61.Search in Google Scholar
27. Karimi MA, Pourhakkak P, Adabi M, Firoozi S, Adabi M, Naghibzadeh M. Using an artificial neural network for the evaluation of the parameters controlling PVA/chitosan electrospun nanofibers diameter. e-Polymers. 2015;15(2):71–8.10.1515/epoly-2014-0198Search in Google Scholar
28. Díaz Lantada A. Neural network approach to modelling the behaviour of ionic polymer-metal composites in dry environments. J Signal Inf Process. 2012;03(02):137–45.10.4236/jsip.2012.32018Search in Google Scholar
29. Tavana R, Moghri M, Esmaili M. Fuzzy logic model for prediction of fusion characteristics in rigid polyvinyl chloride nanocomposite. J Elastomers Plast. 2015; 17(2):1–11.10.1177/0095244315589654Search in Google Scholar
30. Khajeh M, Jahanbin E. Application of cuckoo optimization algorithm–artificial neural network method of zinc oxide nanoparticles–chitosan for extraction of uranium from water samples. Chemom Intell Lab Syst. 2014;135(2):70–5.10.1016/j.chemolab.2014.04.003Search in Google Scholar
31. Khajeh M, Moghaddam SA, Bohlooli M, Ghaffari-Moghaddam M. Application of the artificial neural network and imperialist competitive algorithm for optimization of molecularly imprinted solid phase extraction of methylene blue. e-Polymers. 2016;16(3):243–53.10.1515/epoly-2016-0009Search in Google Scholar
32. Tizhoosh HR, Rahnamayan S. Learning opposites with evolving rules. Fuzzy Systems [Internet]. 2015. p. 1–8. Available from: http://arxiv.org/abs/1504.05619/nhttp://www.arxiv.org/pdf/1504.05619.pdf.10.1109/FUZZ-IEEE.2015.7337880Search in Google Scholar
33. Tan WL, Salehabadi A, Mohd Isa MH, Abu Bakar M, Abu Bakar NHH. Synthesis and physicochemical characterization of organomodified halloysite/epoxidized natural rubber nanocomposites: a potential flame-resistant adhesive. J Mater Sci. 2016;51(2):1121–32.10.1007/s10853-015-9443-9Search in Google Scholar
34. Bordes P, Pollet E, Averous L. Nano-biocomposites: biodegradable polyester/nanoclay systems. Prog Polym Sci. 2009;34(2):125–55.10.1016/j.progpolymsci.2008.10.002Search in Google Scholar
35. Salehabadi A, Abu Bakar M. Poly(3-hydroxybutyrate)/organo modified montmorillonite nanohybrids; preparation and characterization. Adv Mater Res. 2013;623(2):263–70.10.4028/www.scientific.net/AMR.622-623.263Search in Google Scholar
36. Lu H, Song L, Hu Y. A review on flame retardant technology in China. Part II: flame retardant polymeric nanocomposites and coatings. Polym Adv Technol. 2011;22(4):39–394.10.1002/pat.1891Search in Google Scholar
©2017 Walter de Gruyter GmbH, Berlin/Boston
This article is distributed under the terms of the Creative Commons Attribution Non-Commercial License, which permits unrestricted non-commercial use, distribution, and reproduction in any medium, provided the original work is properly cited.
Articles in the same Issue
- Frontmatter
- In this Issue
- Full length articles
- Hexafluoroisopropylidene based sulfonated new copolytriazoles: investigation of proton exchange membrane properties
- Effect of various formulation ingredients on thermal characteristics of PVC/clay nanocomposite foams: experimental and modeling
- TFC polyamide NF membrane: characterization, application and evaluation of MTPs and MTC for simultaneous removal of hexavalent chromium and fluoride
- Functionalization of epoxy resin and the performance of the resultant magnesium-rich primer
- Preparation of a poly(DMAEMA-co-HEMA) self-supporting microfiltration membrane with high anionic permselectivity by electrospinning
- Mechanical properties of norbornene-based silane treated glass fiber reinforced polydicyclopentadiene composites manufactured by the S-RIM process
- Effect of dip time on the electrochemical behavior of PPy-Cu(OH)2 hybrid electrodes synthesized using pyrrole and CuSO4
- Interfacial interaction exploration and oxygen barrier potential of polyethylene/poly(ethylene-co-vinyl alcohol)/clay hybrid nanocomposites
- Prediction of tensile modulus of PA-6 nanocomposites using adaptive neuro-fuzzy inference system learned by the shuffled frog leaping algorithm
- Molecular design and synthesis of thermotropic liquid crystalline poly(amide imide)s with high thermal stability and solubility