
Evaluation of energy generation in Iraqi territory by solar photovoltaic power plants with a capacity of 20 MW
-
Qusay Hassan
 ,
Saadoon Abdul Hafedh
,
Saadoon Abdul Hafedh

Abstract
The study evaluates the visibility of solar photovoltaic power plant construction for electricity generation based on a 20 MW capacity. The assessment was performed for four main cities in Iraq by using hourly experimental weather data (solar irradiance, wind speed, and ambient temperature). The experimental data was measured for the period from 1st January to 31st December of the year 2019, where the simulation process was performed at a 1 h time step resolution at the same resolution as the experimental data. There are two positionings considered for solar photovoltaic modules: (i) annual optimum tilt angle and (ii) two-axis tracking system. The effect of the ambient temperature and wind on the overall system energy generated was taken into consideration. The study is targeted at evaluating the potential solar energy in Iraq and the viability of electricity generation using a 20 MW solar photovoltaic power plant. The results showed that the overall performance of the suggested power plant capacity is highly dependent on the solar irradiance intensity and the ambient temperature with wind speed. The current 20 MW solar photovoltaic power plant capacity shows the highest energy that can be generated in the mid-western region and the lowest in the northeast regions. The greatest influence of the ambient temperature on the energy genrated by power plants is observed in the southern regions.
Introduction
Solar photovoltaic (PV) and solar thermal system (STS) systems are used in renewable power plants. Photovoltaic energy is weather-dependent, resulting in considerable swings in grid feed. Solar energy for electricity generation connected to the grid creates grid stability challenges owing to its intermittent nature, since it reverses power flow during times of low demand, resulting in poor power quality (Weida, Kumar, and Madlener 2016). Therefore, before electricity is connected to the grid, standard parameters such as frequency, voltage, and power inverters used to convert renewable solar-generated Direct Current (DC) voltage to Alternating Current (AC) should be addressed. Voltage increases, voltage flicker, and voltage harmonics may all be used to quantify the degradation of power quality. In recent years, a significant boost in the construction of solar photovoltaic/solar thermal power plants has taken interest in the world (Haas et al. 2011). It is expected that solar energy production will be able to compete, at the utility level, with conventional electricity prices in many regions of the world. This expectation has led to an increase in the construction of new photovoltaic power stations on a large scale (International Energy Agency 2020). Photovoltaic modules are known to resist extreme climate conditions as they provide a long lifespan of approximately more than 20 years (Jaszczur and Hassan 2020). The construction of solar power plants necessitates the selection of the best site in the best conditions for obtaining the most energy. Power plants, solar and wind, in general, require a large area of land and they are often exploited in rural sites (Abdulateef et al. 2021).
According to the Energy Information Administration’s (IEA) 2020 report, the highest growth rates for electricity production by PV systems and solar concentrated power (SCP) were observed between 2001 and 2019 (refer to Figure 1). Furthermore, the global PV output has tripled for the period of 2006–2009 and has been growing dramatically since then (reaching 100 TWh in 2013). In particular, the year 2016 observed total PV production reaching about 260 TWh with more than 190 million units installed, and the total contemporary SCP capacity was 4.8 TWh (International Energy Agency 2020). The years 2017–2019 showed a significant increase in photovoltaic capacity, with an increase of 98 GW in 2019, representing a growth of more than half of renewable capacity. Moreover, the solar PV capacity has increased by about 50% from 2017 to 2018, which exceeded the 32% growth in 2019 (adding 573 TWh) (International Energy Agency 2020). This unprecedented global growth in PV energy has resulted in a significant contribution to electricity generation of more than 3%, and the global extrapolation shows its future capacity of about 1800 GW by 2030 (International Energy Agency 2014). In 2019, there will be a significant global addition of 700 MW of Thermal Concentrated Power (TCP) capacity, the largest yearly expansion since 2014 and a fivefold increase over 2018. For the years 2012–2018, the annual capacity of SCP increased by an average of 27%. Despite additions, global SCP production is estimated to have increased by only 9% in 2019 (International Energy Agency 2020). Therefore, the statistics briefly illustrate the increasing demand for solar energy, especially with PV systems’ preference, and promote requirements for reliable and accurate forecasting of PV (International Energy Agency 2020).
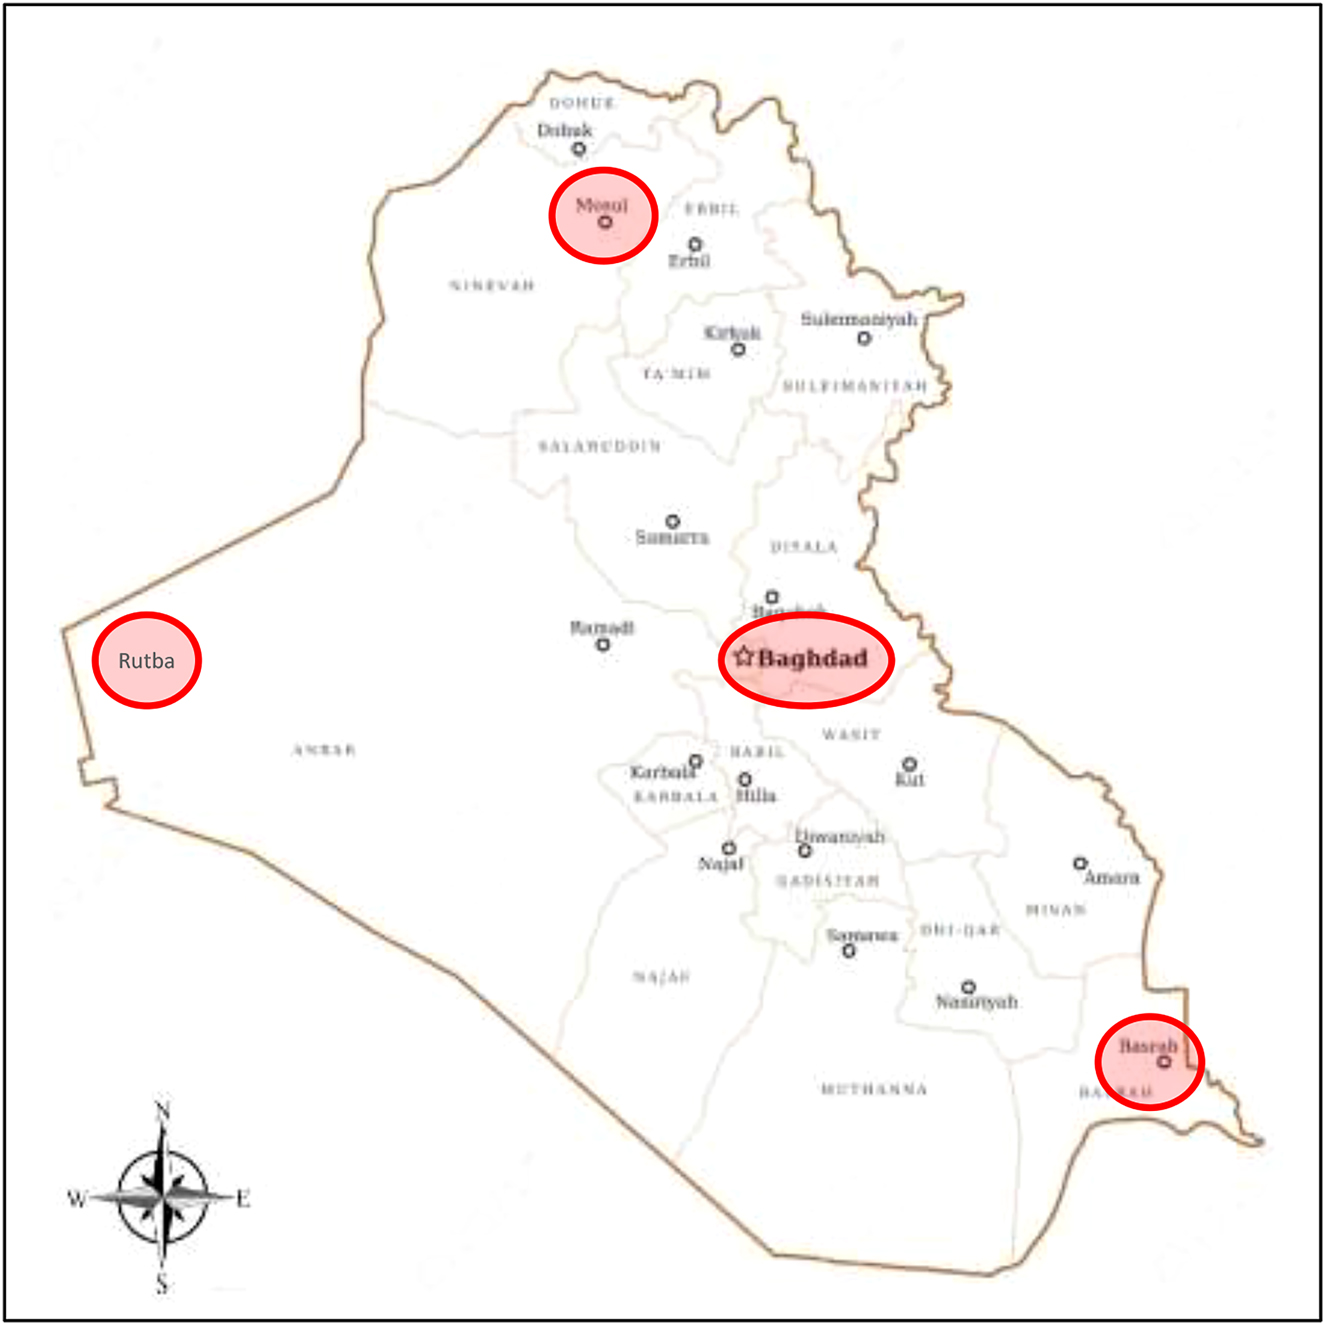
A map of Iraq with the main cities (Hassan et al. 2021).
At this time, Middle East countries have not invested to the extent required in renewable energy, especially in solar energy, due to natural gas availability, which is considered the second most polluting fuel after coal (Hassan 2021a). Government policies need to encourage investment in the field of solar energy because of the high solar irradiance intensity in the Middle East region. The annual daily average of solar irradiance on a horizontal plane has been measured to be 4.4 kWh/m2; Baghdad is 5.02 kWh/m2; Cairo is 5.32 kWh/m2 and Riyadh is 5.77 kWh/m2 (Hassan 2020; Kazem and Chaichan 2012). Globally, there are several articles that have investigated the solar energy capacity and assessment of the solar energy optimal site by using different methodologies and approaches.
Ramli, Twaha, and Alghamdi (2017) investigated the energy generation capacity and economic feasibility of grid-connected photovoltaic systems. A thorough system assessment was highlighted, as it is critical to appropriately analyse energy resources in terms of potential, technical needs, and economic feasibility prior to adopting systems. The goal was to replace fossil fuels used to generate power that create carbon dioxide with clean solar photovoltaic energy. The total net present cost, total emission cost, levelized cost of energy, and renewable energypenetration of various system configurations were determined using the Homer programme. Rehman et al. (2017) conducted a feasibility study on grid-connected 10 MW PV power plants installed in Saudi Arabia. The feasibility study utilized Retscreen software to concentrate on the technical, environmental, and economic aspects of selecting potential locations for constructing grid-connected PV power plants with a capacity of 10 MW. Imteyaz et al. (2021) conducted a techno-economic study of 67 and 144 MW solar power plants, using Retscreen software to account for module efficiency degradation caused by high temperatures. The authors assumed that each degree of temperature rise above 45 °C reduces efficiency by 0.4%. The study examined the feasibility of solar PV in the current grid configuration. Thotakura et al. (2020) evaluated the operational performance of megawatt-scale grid-connected rooftop solar photovoltaic systems in wet and dry tropical regions. The researchers used PVGIS, PVWatts, and PVsyst modelling tools for assessed energy output, yield factor, capacity factor, performance ratio, and error matrices. Mekonnen, Bhandari, and Ramayya (2021) used the HOMER pro tool in combination with PVGIS and PV Watts to model and optimise grid-connected solar photovoltaic power plants in Ethiopia. The system’s technical performance, as measured by PV GIS and PV Watts, was virtually identical to that of the Homer pro outputs. The analysis provided clear guidance to interested target groups and politicians on the growth of photovoltaic energy supply choices across the country’s technically feasible sites. The researcher, however, employed a separate bit of software since PVGIS and PV Watts were confined to assessing the technical feasibility of grid-connected photovoltaic systems.
Das (2020) displayed evolution for the output power of the 89.6 kW PV power plant capacity in India. The analysis was conducted at a 30 min simulation time step resolution by using experimental weather data for one year. The results indicated that the ambient temperature has a high effect on the power plant’s energy production, and they concluded with a realistic model to assess solar power for the Indian territories. Another article peppered by AlHakeem et al. (2015) is for photovoltaic power forecasting by wavelet decomposition of the combined temperature and solar irradiance. The research concluded with a polynomial model based on third-order degree prepared by the particle swarm optimization algorithm. Almonacid et al. (2014) used an artificial neural network for PV system power forecasting. The study concluded the polynomial model for predicted PV generated power at 1 h accurately based on the solar irradiance and PV cell temperature with root mean square error (RMSE) normalised of 3.39%. Zhang et al. (2015) investigated four scenarios for the optimum geographical location of a PV power plant with 495 GW capacity. The predicting obtained results with RMSE precision ranging from 1 to 13%.
Environmental variables, especially wind speed and direction, and ambient temperature have crucial inputs on PV power forecasting models during simulations and optimisation processes, in which the wind and PV cell temperatures are important and interrelated. Low wind speed and high ambient temperature create significant uncertainties in the PV models power production at the same solar irradiance intensity, which is considered the main factor for dissipating heat and reducing the temperature of PV cells (Jaszczur, Hassan, and Teneta 2018; Reddy 2017; Reddy and Bijwe 2015). Hassan, Jaszczur, and Przenzak (2017) prepared a mathematical model for forecasting solar power with/without the temperature effect from arbitrary positioning of PV panels. Al-Dahidi et al. (2019) investigated the wind speed and direction effect on the solar PV system located on the building roof by using artificial neural network models for PV Photovoltaic power forecasting. The results displayed that the wind speed at 8 m/s dropped by about 5° from the PV module cell temperature. A new model for predicting PV cell temperature by using nominal operation cell temperature was proposed by Hassan et al. (2016). The model was validated by using experimental data with RMSE precision <2.3%. Jaszczur et al. (2019a) and Jaszczur et al. (2020) presented a model for predicting PV cell temperature using three environmental variables (intensity of solar irradiance, atmospheric temperature, and wind speed) in addition to the Ross coefficient, which they used in the simulation process of their work. The authors used experimental data for all parameters, in addition to the module cell temperature during daytime and night. The prepared model displayed high accuracy prediction, which was validated by RMSE precision of 2.71%. Raza, Nadarajah, and Ekanayake (2016) proved the inspection determined that the output PV power path does not follow the wind speed path exactly. During the day, the output power of PV systems is at a higher level compared to the wind speed. As a result, increasing wind velocity reduces output power; however, no similar observations were made by others during the same time period. Therefore, the relationship between the PV output power and wind speed is matched sometimes but not always. Schwingshackl et al. (2013) investigated various methods for evaluating PV cell temperature and identified wind impact as a key factor. The cell temperature consideration is vital if the PV outputs power from different modules types to compare, for each type of PV cell differs in its response to the temperature change based on cell technology. As a function of PV cell technology, ambient temperature and solar irradiance operating variables at the real operating conditions, Paulescu et al. (2017) modelled PV cell temperature. Kumar and Sudhakar (2015) used PV SYST software and solar GIS to compare the performance of a 10 MW grid-connected solar photovoltaic power plant. The research gave insight into the optimal site and PV technology for large-scale solar photovoltaic system implementation. Imam and Al-Turki (2020) carried out the study on the use of an on-grid solar system to power the Cedars hotel in Jordan. The photovoltaic system was constructed taking into account the needed electrical demand and solar energy available. The simulation was conducted using a photovoltaic geographic information system and PVsyst and determined that an on-grid solar system was technically and economically feasible for electrifying residential hotel applications.
Identifying regions of potential solar energy is the first step to establishing solar power plants. Economic, environmental and social factors must be taken into consideration in order to determine suitable sites for solar power stations. Finding suitable sites for solar power plants can increase energy storage and reduce the cost of energy transmission. The geographic information system with multi-criteria decision analysis approaches has been used in a very wide application for obtaining the optimum site for renewable energy applications (Höfer et al. 2016). Most geographic information systems (GIS) help to find the potential solar irradiance sites but do not consider the effect of the environmental variables on the predicted energy. This leads to the weakness of this methodology for obtaining the best site to establish solar power plants because the evaluation is carried out from only one perspective (Yalcin and Gul 2017). Globally, several articles used geographical information systems tools for potential solar irradiance mapping. Assessing the potential solar radiation sites in Oman, a study prepared by Charabi and Gastli (2011). The authors used a geographic information system to obtain optimum sites for solar power farm construction. Janke (2010) carried out an investigation by combining the geographic information system and multi-criteria decision-making approach for obtaining the optimum sites of potential solar/wind farms in Colorado, USA. Uyan (2013) adopted an analytical hierarchy process method with a geographic information system to highlight the optimal sites for solar power plant construction in Konya, Turkey. The authors decided on the optimal sites based on the assessment of the highest solar radiation sites. Carrión et al. (2008) have obtained the optimal locations of the on-grid solar PV installations in the Huescar region, Spain by using a geographic information system. The authors have obtained only the highest potential solar irradiance. Yunna and Geng (2014) carried out a feasibility assessment by using the hierarchy process method with a geographic information system approach to investigate the optimal site for the establishment of a hybrid renewable energy system consisting of solar and wind. Tahri, Hakdaoui, and Maanan (2015) Ouarzazate, Morocco have used the hierarchy process method with a geographic information system approach. The authors indexed the optimal sites at the highest solar rations with the highest ambient temperatures, and they indicated the selection of the optimal site did not depend on the highest solar irradiance only; most considered other atmospheric variables. In addition to the above literature, Table 1 shows additions to research that investigated the optimal site selection for different countries by using a different methodology.
The considered provinces in this study (Behar, Khellaf, and Mohammedi 2013).
| No. | City | Governorate | Latitude (N) | Longitude (E) | Elevation (m) |
|---|---|---|---|---|---|
| 1 | Baghdad | Baghdad | 33.31 | 44.36 | 34 |
| 2 | Rutba | Anbar | 33.03 | 40.28 | 618 |
| 3 | Mosul | Nineveh | 36.34 | 43.15 | 223 |
| 4 | Basra | Basra | 30.52 | 47.77 | 5 |
In addition to the preceding literature, a review of the evolution of solar power plants optimal sites is presented in Ahmed et al. (2020) and Map of Iraq. Although there were several climates, an adequate number of constraints and criteria can be used in evaluating potential solar energy in general. This study considers three criteria (solar irradiance: total, direct, diffuse, ambient temperature and wind speed) for evaluating the potential solar energy in 19 Iraqi cities. This proposed investigation may not be the most innovative, but it has not been carried out for Iraq before as it is of importance for wide solar system applications. Thus, these kinds of investigations are considered to be in the interest of a wide community.
Methodology
Iraq is a country located in the Middle East, surrounded by Turkey (north), Iran (east), Kuwait, Saudi Arabia (south), Jordan, and Syria (west), with a total area of 437,072 km2 as it is located between longitudes of 30° and 38° North and latitudes 38° and 46° East. It consists of 18 administrative units called governorates. For each governorate, there is a capital called the capital of the province. The thought about investigations in the present work were conducted for 19 cities (governorate capitals) as well as the city Rutbacity. In fact, Rutba city is located in the western part of Iraq in the Anbar Governorate near the Jordan border, which is the most remote city in the western part of Iraq. Figure 1 and Table 1 show the entire sites of the 19 cities investigated in current work.
Experimental data collection
The hourly experimental data (solar irradiance, ambient temperature, and wind speed) for the selected 18 cities has been obtained by the Iraqi General Authority for Meteorology and Seismic Monitoring as these were collected from the 1st of January to the 31st of December 2019. According to the difficulties of presenting the results and figures for each city and in every step of the investigation, there have been only four main cities: Baghdad (middle east), Rutba (middle west), Basra (south) and Mosul (north), as can be seen in the green circles on the map of Figure 2.
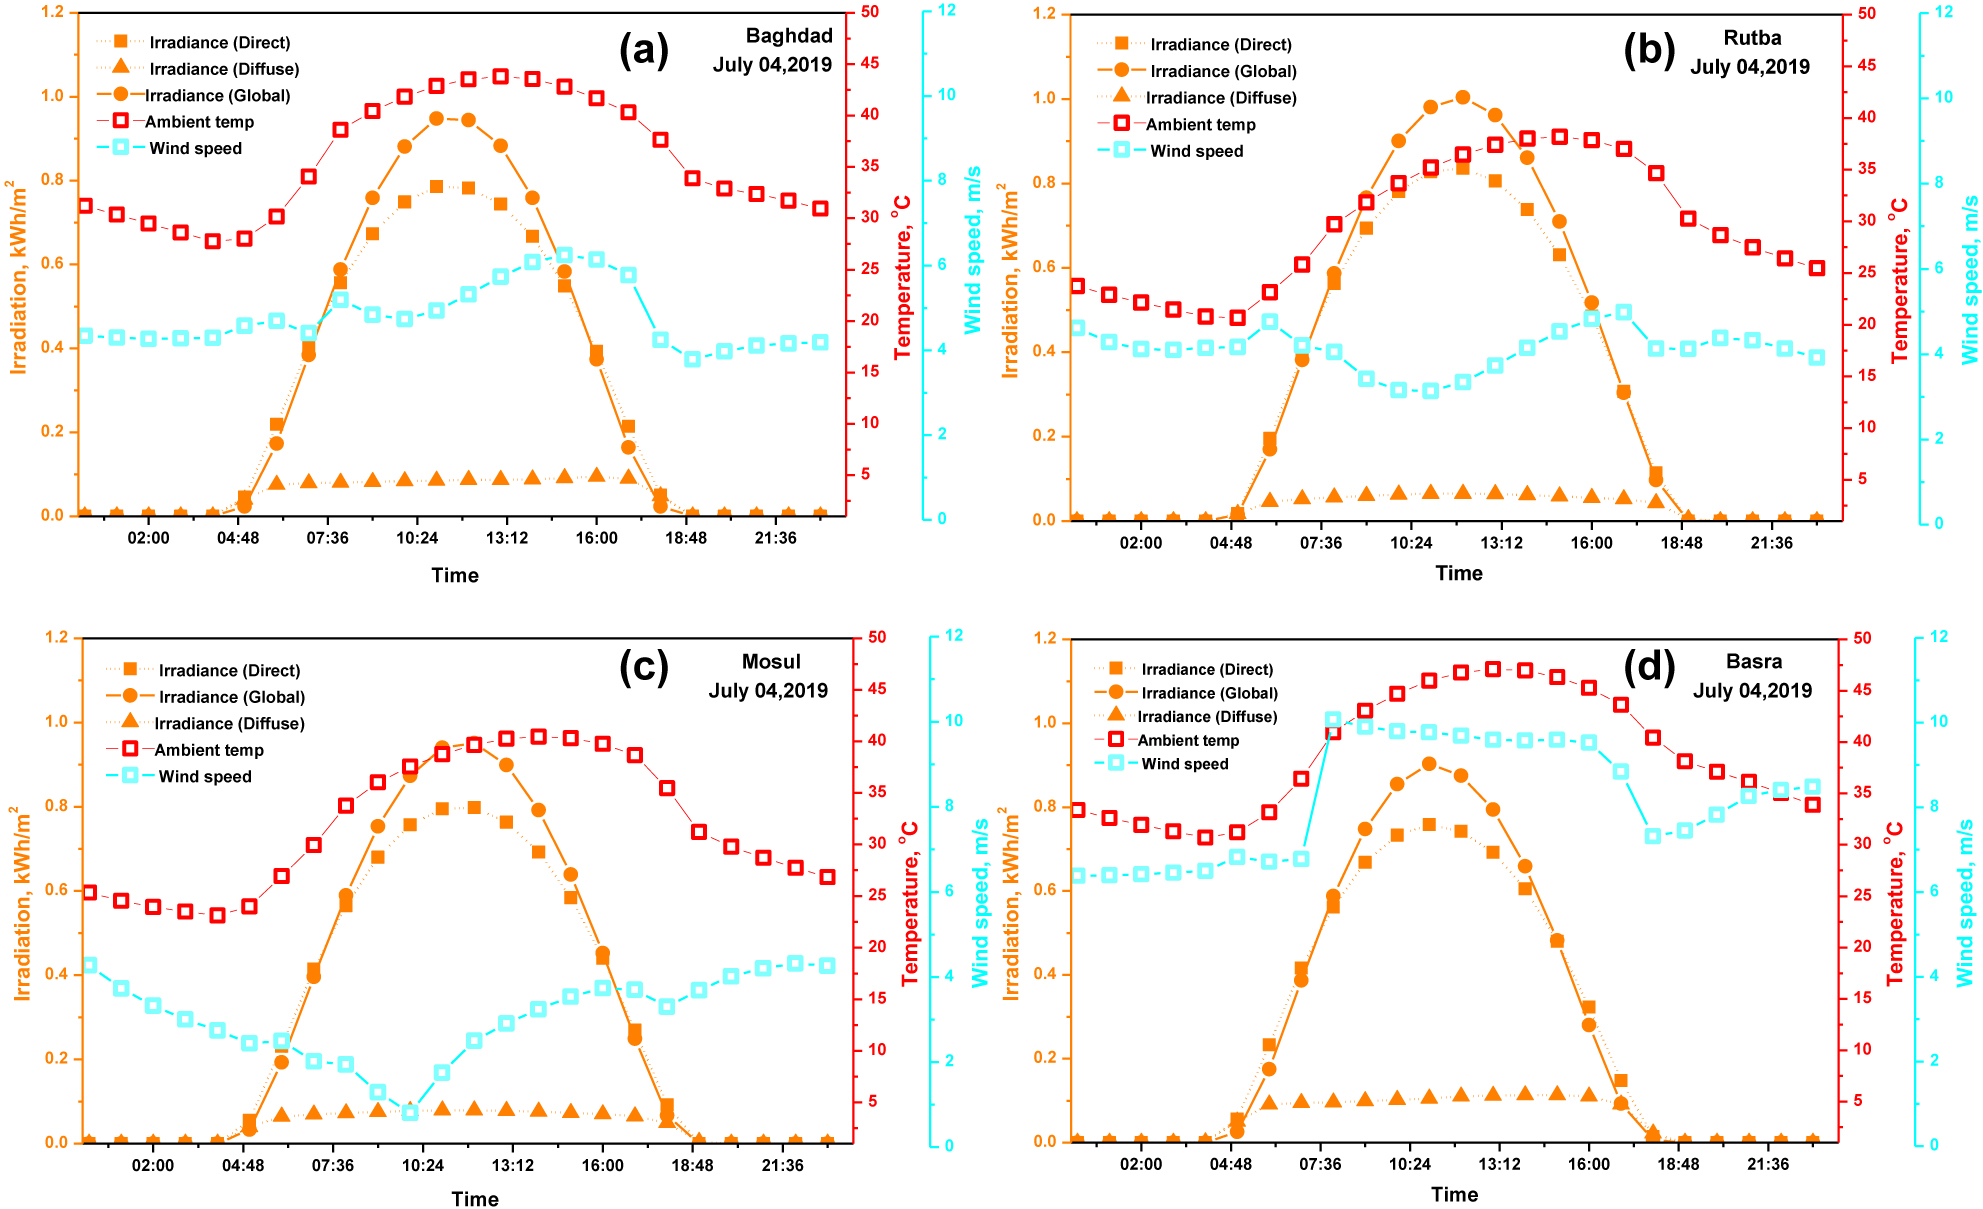
Hourly experimental data (solar irradiance, ambient temperature and wind speed) for four selected cities.
Figure 2 (a)–(d) show the daily distribution of solar irradiance (Direct, Diffuse, and Global) on the horizontal plane, along with the ambient temperature and wind speed for four selected cities: Baghdad (middle east), Rutba (middle west), Mosul (north) and Basra (south) respectively. Table 2 shows the average of the experimental weather data for the four selected cities for the day of July 04, 2020. The highest average of the global irradiance has been observed to be in Rutab by about 8.25 kWh/m2, whereas the lowest irradiance value was found to be in Basra city by about 4.09 kWh/m2 for the selected day. Baghdad has a yearly average daily irradiance of 4.76 kWh/m2, Rutba has a yearly average daily irradiance of 5.2 kWh/m2, Basra has a yearly average daily irradiance of 4.76 kWh/m2, and Mosul has a yearly average daily irradiance of 4.66 kWh/m2. Furthermore, the average of the highest wind speed has been located to be in Basra, which reaches 5.8 m/s, whereas the lowest value was in Mosul at 3.1 m/s for the selected day. The avarge of the highest ambient temperature has been obtained to be 35.9 °C in Baghdad as the lowest value of 29.5 °C was seen to be in Rutba. This might be explained due to the effect of the desert surrounding the region on the selected day.
The daily average of (solar irradiance, ambient temperature, and wind speed) for the selected sunny day of July 04, 2019 for four selected cities.
| City | Global irradiance (kWh/m2) | Direct irradiance (kWh/m2) | Diffuse irradiance (kWh/m2) | Ambient temperature (°C) | Wind speed (m/s) |
|---|---|---|---|---|---|
| Baghdad | 5.06 | 4.48 | 1.62 | 35.9 | 4.8 |
| Rutba | 5.53 | 4.99 | 1.38 | 29.5 | 4.1 |
| Mosul | 4.87 | 4.56 | 1.56 | 31.9 | 3.1 |
| Basra | 5.26 | 4.69 | 1.96 | 23.6 | 5.8 |
Figure 3 (a)–(d) depict the monthly average solar irradiance components based on experimental measurements on the horizontal plane for the year 2019 and the four selected cities: Baghdad, Rutba, Mosul, and Basra. During the summer months (May-September), the solar irradiance direct component took the highest value according to the higher sun’s position in the sky, wherein in winters and precisely in October-April, the direct component will be at the lowest value. and vice versa for the diffuse component. The daily yearly average global solar irradiance has been investigated such that for Baghdad it is 4.79 kWh/m2/day, Rutba is 5.2 kWh/day, Mosul is 4.66 kWh/day and Basra is 4.7 kWh/day. Within the said territories, the daily yearly average direct solar irradiance is 4.28 kWh/m2/day, Rutba is 4.89 kWh/day, Mosul is 4.16 kWh/day and Basra is 4.29 kWh/day. The daily yearly average diffuse solar irradiance for Baghdad is 1.33 kWh/m2/day, Rutba is kWh/m2/day, Mosul is 1.29 kWh/m2/day and Basra is 1.38 kWh/m2/day. Rutba is considered to have the highest global irradiance and lowest diffuse irradiance, where the lowest global irradiance for Mosul city can be seen in Figure 3.
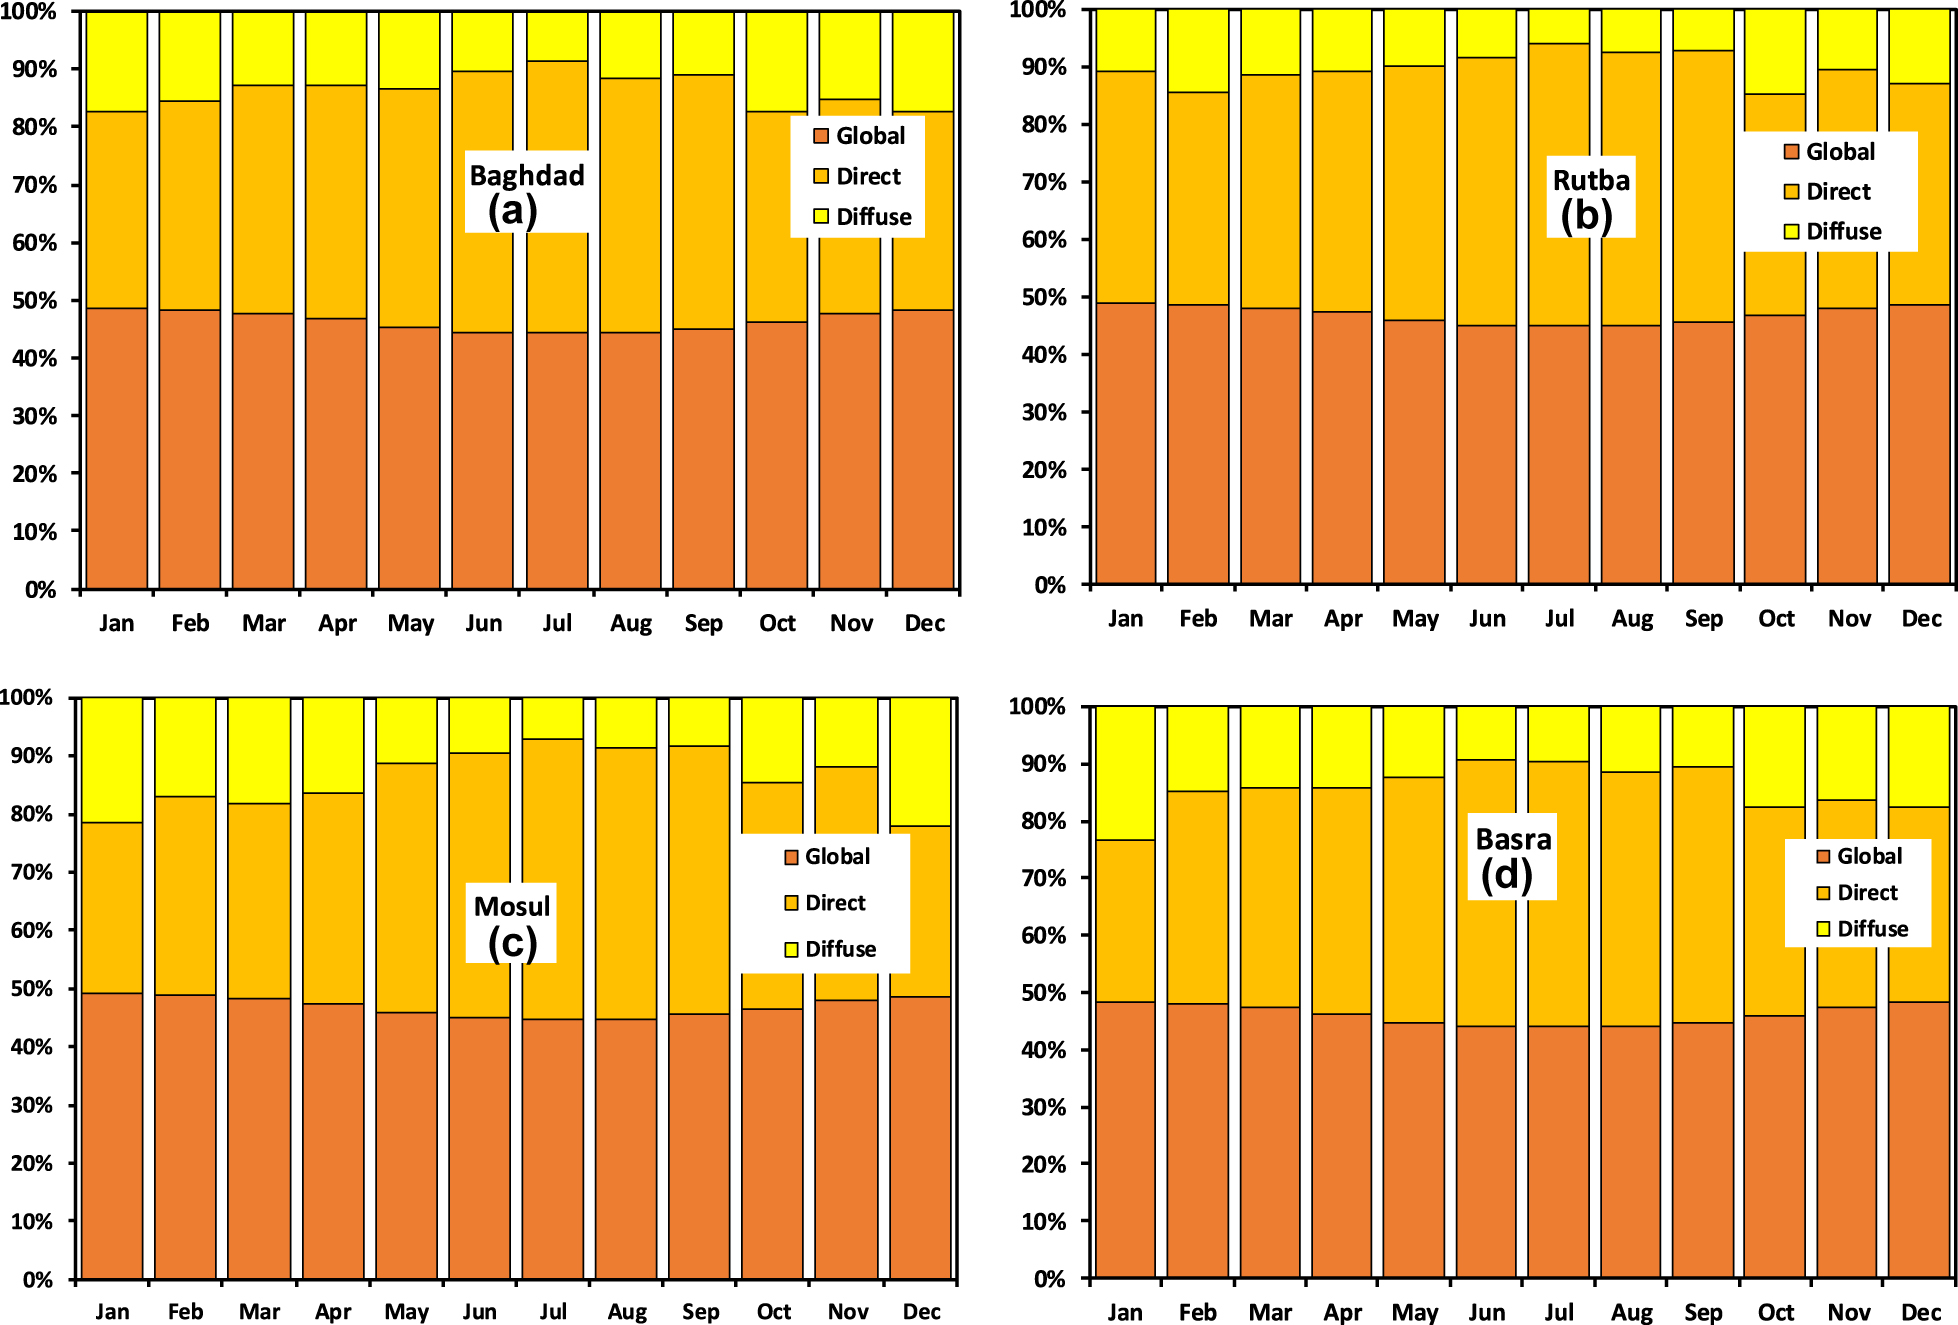
The monthly average solar irradiance percentage (global, direct and diffuse) for the four considered cities in 2019.
The monthly average wind speed and ambient temperature for Baghdad, Rutba, Mosul, and Basra are presented in Figures 4 (a) and 5 (d) respectively. The yearly average ambient temperature and wind speed have been evaluated such that for Baghdad it is 24.1 °C and 3.28 m/s. Rutba is 19.4 °C, 4.39 m/s, Basra is 26.6 °C, 4.18 m/s and Mosul is 20.04 °C, 2.86 m/s respectively. Based on the yearly average of the experimental data presented in Figure 5, the western part of Iraq has been shown to have the lowest temperature (Rutba City), while the southern part of Iraq has shown the highest temperature. The highest wind speed was observed to be in the western part of Iraq, while the lowest wind speed was seen to be in the northern part. According to these considered measurements, it is possible to predict the best place so as to exploit solar energy. The preferred place is generally considered to have the highest wind speed and lowest temperature, regardless of the value of solar irradiance.
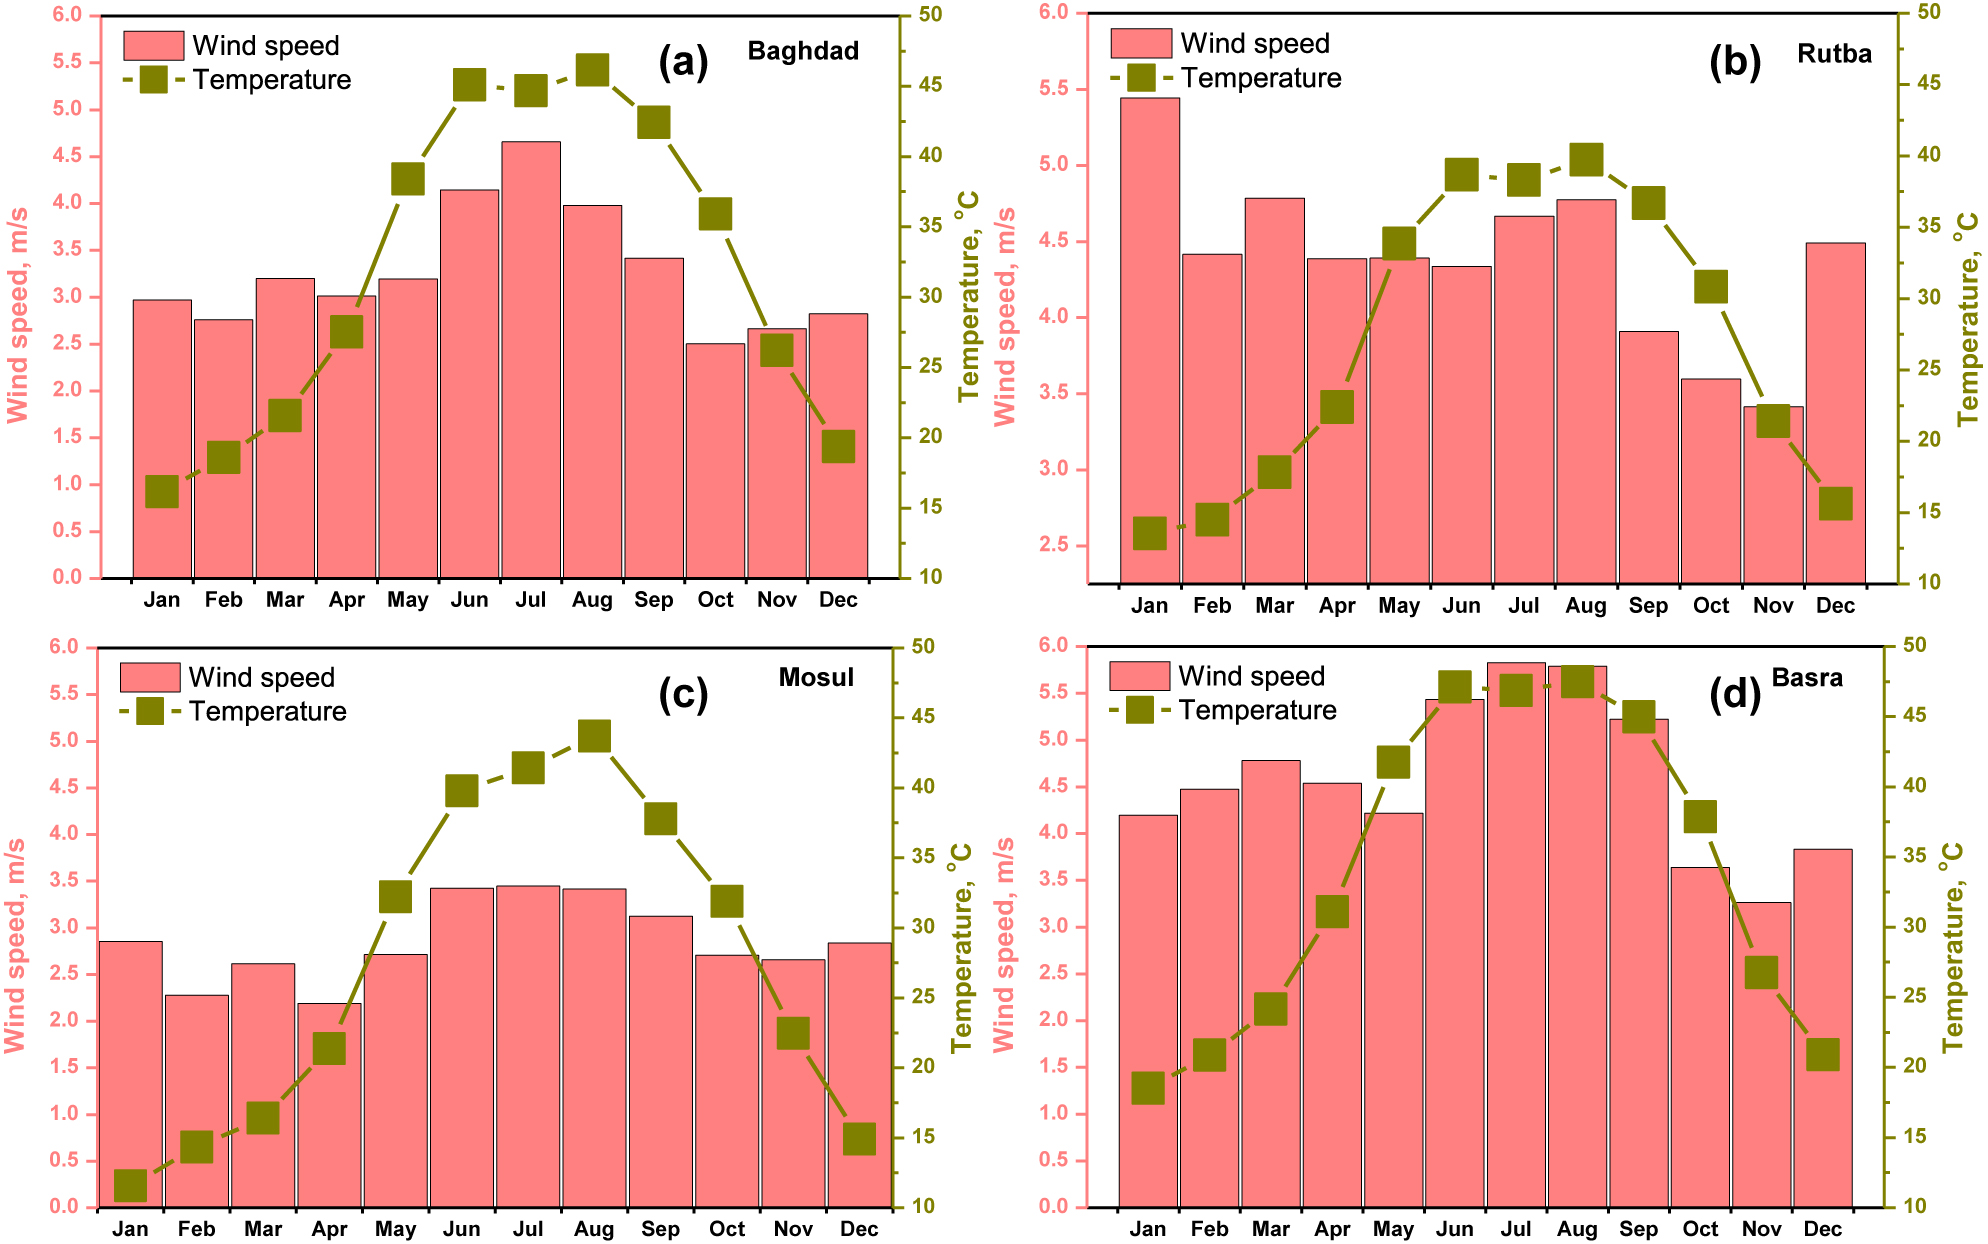
The monthly average wind speed and ambient temperature for the year 2019 for four selected cities.
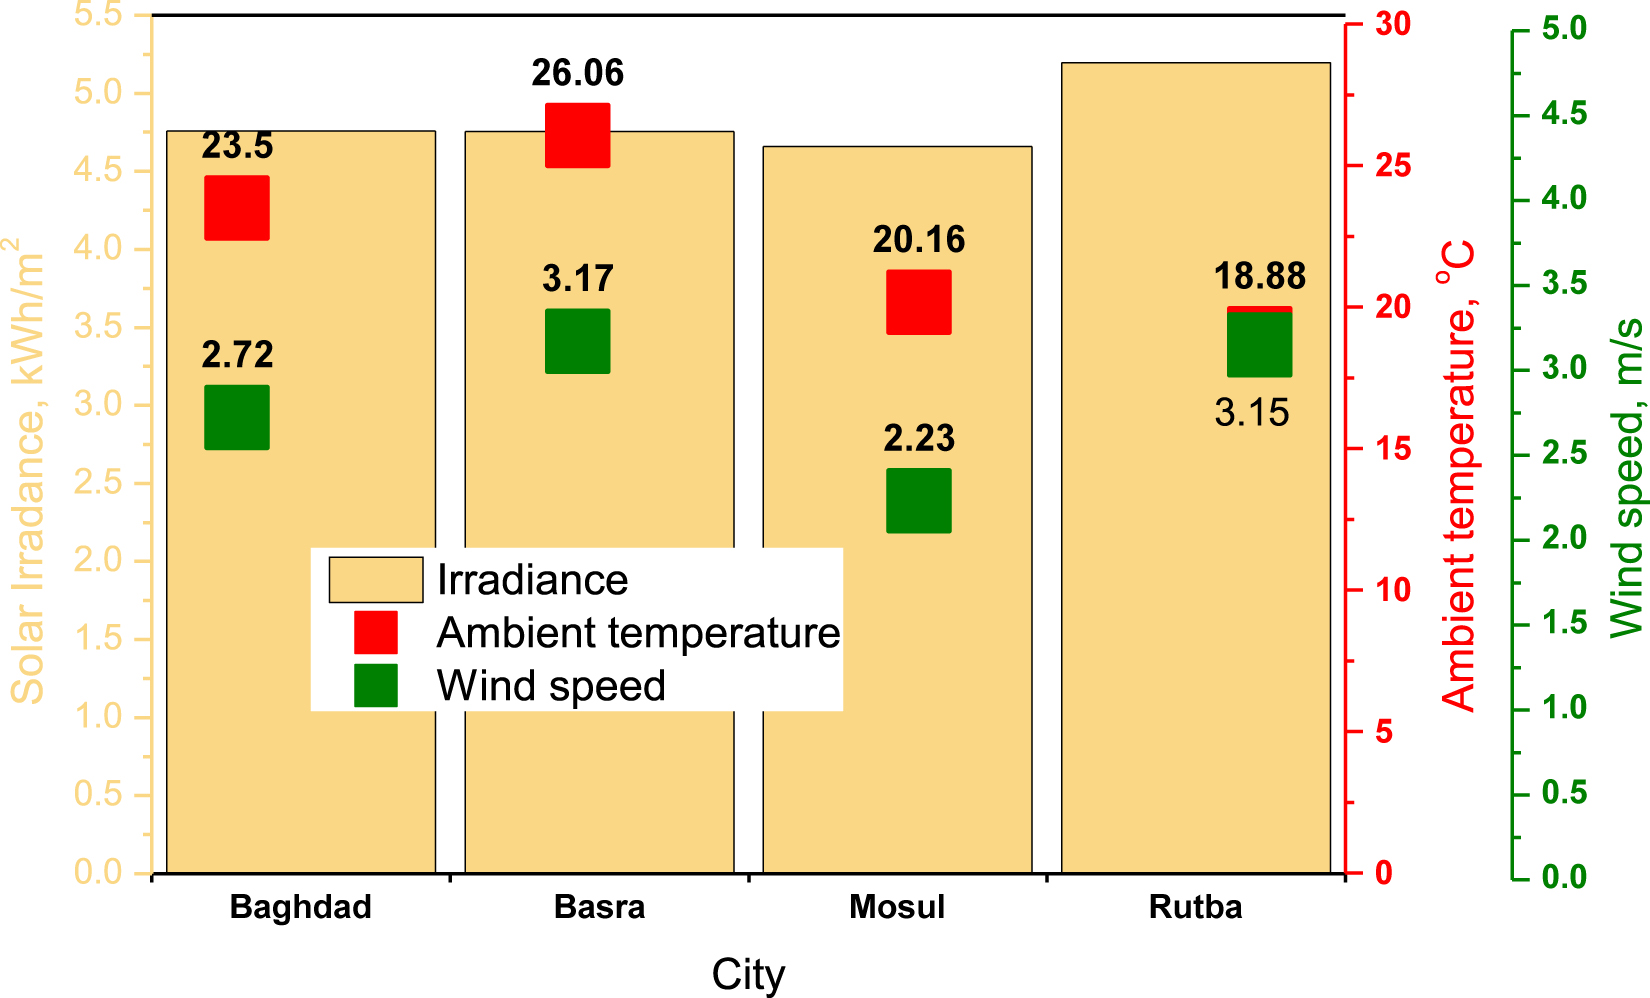
The yearly average experimental data (solar irradiance, ambient temperature and wind speed) for four cities.
Figure 5 depicts the yearly average solar irradiance, ambient temperature, and wind speed for four cities. It is observed that the yearly average highest irradiance is located in the western territories of Iraq (Rutba city about 5.19 kWh/m2/day), where the lowest value of the irradiance is located in the northern territories (Mosul about 4.65 kWh/m2/day). The yearly average temperature is shown in the southern and middle territories, where Basrais at about 26.06 °C and Baghdad at about 23.54 °C. The lowest ambient temperature values were observed to be in the northern territories. The variation of the yearly average wind speed has been observed in the southeastern restores, such that Basra is about 3.17 m/s. The lowest average wind speed value has been observed to be in the northeastern, such that it was in Mosul at about 2.23 m/s.
Governing equations
In general, most solar energy system designers use global irradiance for estimation of the total solar irradiance at different title angles, as this requires a correlation for decomposition of solar irradiance components (Direct and Diffuse). In this study, all solar irradiance components were measured experimentally and no required decomposition correlations were needed.
The solar irradiance is measured in the horizontal plane, and for estimation, the power generated by PV modules is required to estimate the solar irradiance intensity on the oblique surfaces. A model for estimating the solar irradiance intensity from arbitrary-positioned PV modules is authorised by Hassan et al. (2021). Several models have described the estimation of the total incident solar irradiance at different tilt angles as shown in (Jaszczur, Hassan, and Palej 2019; Xie, Sengupta, and Wang 2019). In this study, the Hay and Davies, Klucher, and Reindl (HDKR) model was considered for this work, which can be expressed as (Xie, Sengupta, and Wang 2019):
where HT is the total incident irradiance (kW/m2), Hb is the direct irradiance (kW/m2), Hd is the diffuse irradiance (kW/m2), H is the global irradiance (kW/m2), an is anisotropy index (−), Lb is the ratio of direct irradiance on the tilted plane to the horizontal plane (−), β is the module tilt angle (°), F is the factor of horizontal brightening (−), η is the ground reflectance (%) and γ is the surface azimuth angle (°).
The output power of the PV module/array depends on the total incident irradiance from all components (Global, Direct and Diffuse). The PV array output power PVp (kW) without the effect of the ambient temperature and wind speed can be calculated by the following equation [60]:
where CPV is the PV array capacity (kW), DPV is the derating factor of the PV array (%), HT,STC is the irradaince at Standard Test Conditions (STC) which equals to 1 kW/m2.
The PV array output power PVp (kW) with the effect of the ambient temperature and wind speed can be calculated by Eq. (3) (Palej et al. 2019):
where μ is the PV cell temperature coefficient of power (%/°C), Tc is the PV cell temperature (°C) and Tc,STC is the PV cell temperature at STC which equal (25 °C). Several models have described the prediction of PV cell temperature by using different variables, as shown in the studies (Hassan 2021b; Santiago et al. 2018). Another study has selected a more advanced model as described by Jaszczure et al. (Perović et al. 2017). The model considers three main variables: ross coefficient, ambient temperature, solar radiation intensity, and wind speed as follows:
where Vw is the wind speed (m/s) and τ is the Ross coefficient factor (Km2/W) ranged = (0.02–0.056) (Abbas et al. 2021; Ceran et al. 2021; Hassan 2022; Hassan and Jaszczur 2021; Hassan et al. 2022; Jaszczur et al. 2019a, 2019b; Jaszczur et al. 2021a, 2021b), Ta is the ambient temperature (oC).
Results and discussion
The simulation process in this work was conducted by using MATLAB at 1 h resolution by using hourly experimental data presented in Figures 2–5. The selected PV module specifications are described in Table 3, where the array derating factor is considered 90%, where the energy losses have been reduced by 10% due to wire energy losses, soiling, snow cover, birds dropping etc. The ground reflectance presented in Eq. (1) is taken at 20%, and the value of the Ross coefficient factor is taken at 0.04 Km2/W.
Specifications of the selected PV modules (LEORY Solar Modules).
| Brand name: LEORY | Output: 5 V/18 V |
|---|---|
| Type: monocrystalline silicon cell | Tolerance: ±5% |
| Pmax: 300 W | Temperature coefficient of power: −0.47%/oC |
| Isc: 3.33 A | Nominal operation cell temperature: 48 °C |
| Voc: 20 V | Efficiency at STC: 19% |
| Ipmax: 2.77 A | Operate temperature range: −40 to 80 °C |
| Vpmax: 18 V | Size and number of cells: 156 mm*156 mm 72 Pcs/6*12 |
Figure 6 (a) through (d) depict the expected daily power generated for the selected sunny day of July 04, 2019, with or without temperature effect, for Baghdad, Rutba, Mosul, and Basra, respectively. The PV modules are set at two positions: annual optimum tilt angle and two-axis tracking system. The annual optimum tilt angle at maximum incident solar irradiance for the whole Iraqi cities presented by Hassan et al. (2021), for Baghdad (β = 29°), Rutba (β = 28°), Mosul (β = 31°) and Basra (β = 26°), were the modules’ azimuth angle (γ = 0) south-facing (Hassan et al. 2021). It’s very clear that positioning on the two-axis tracking system generates energy higher than the positioning of annual optimum tilt angle. At the same time, the degradation energy in the two-axis positioning system is higher than in the two-axis positioning system.
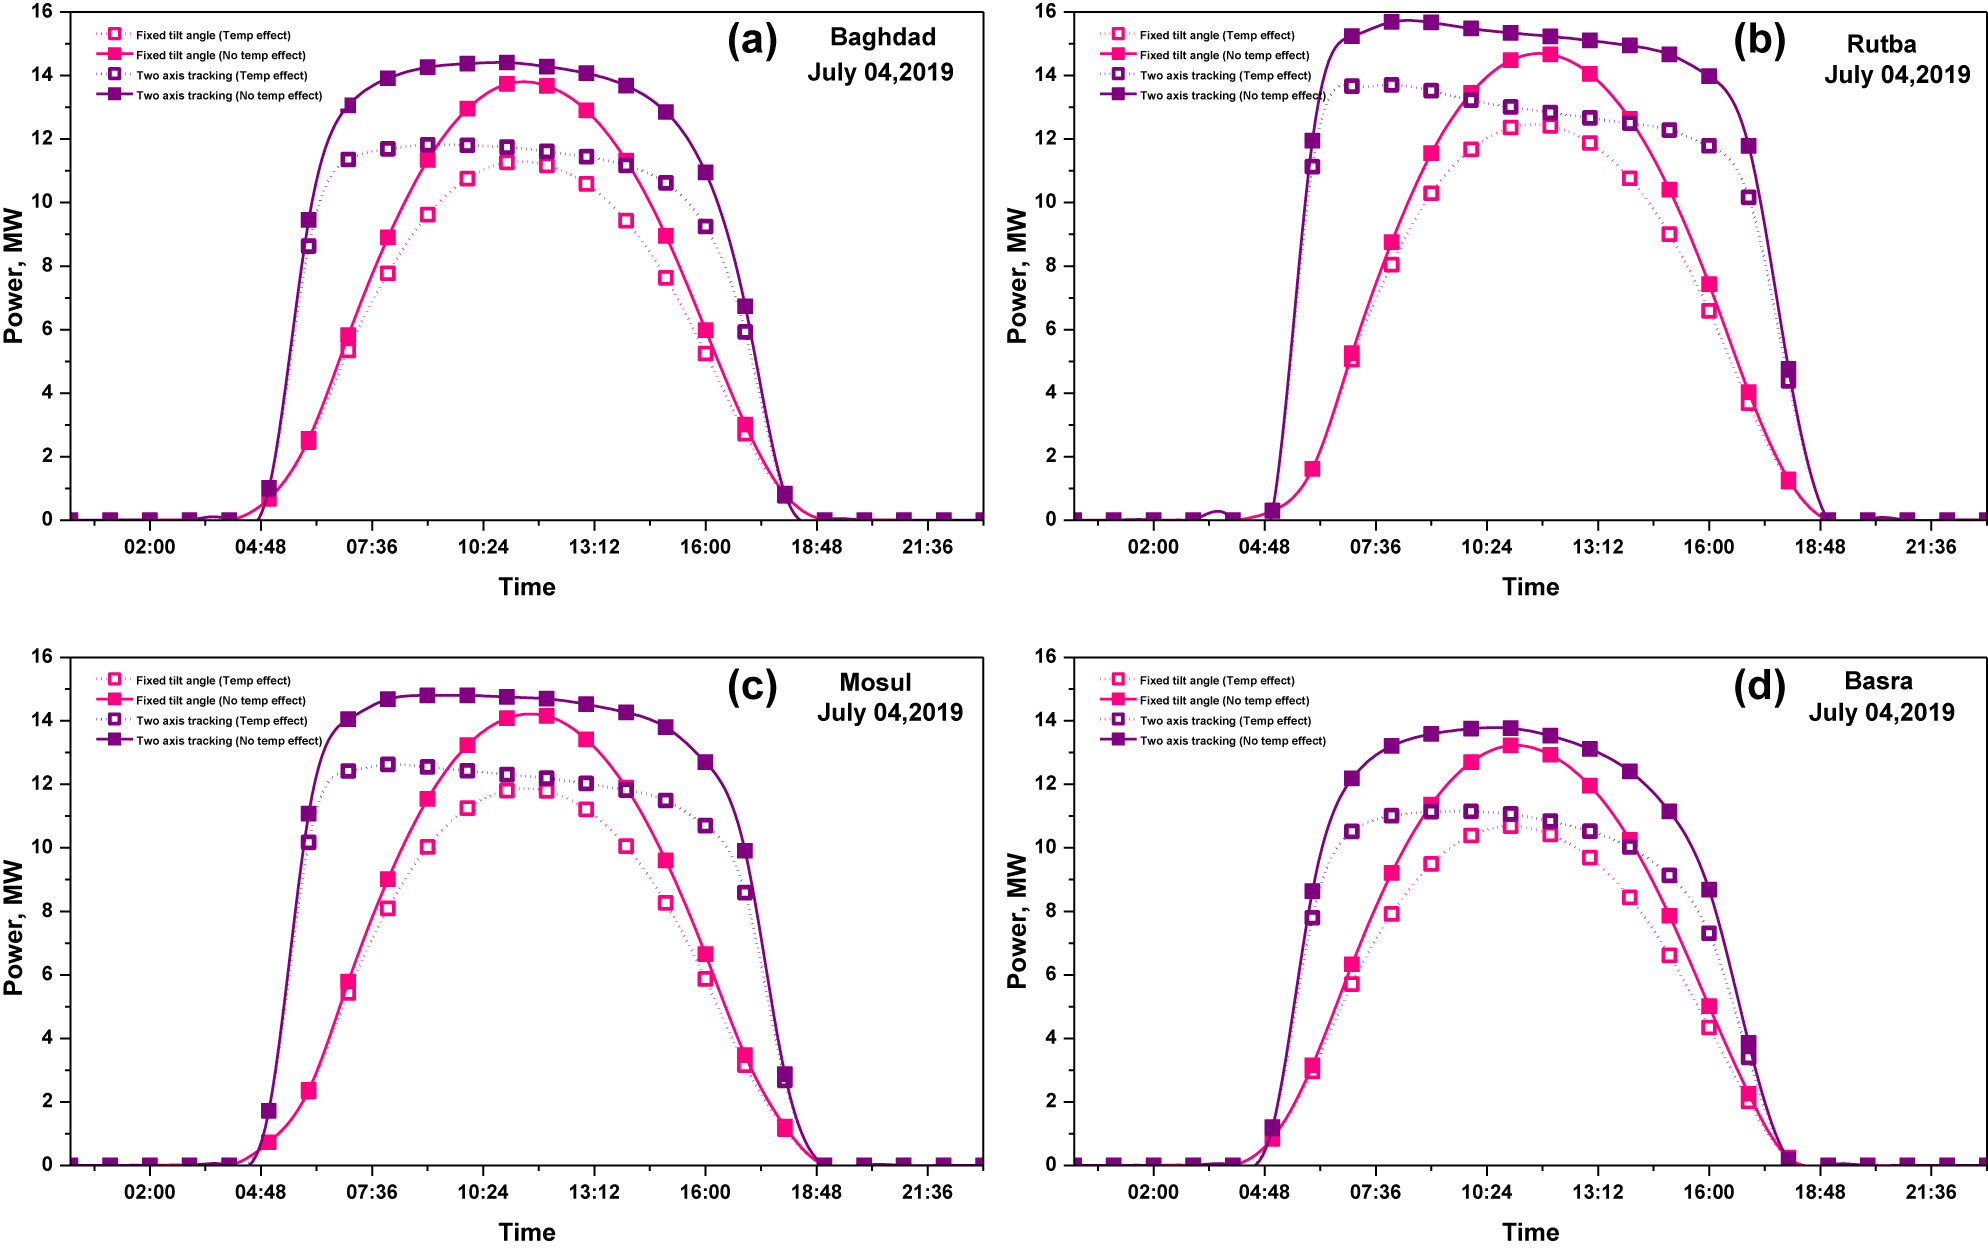
The daily power generated by the suggested power plant with/without temperature effect at two positions: (i) annual optimum tilt angle, (ii) two axis tracking system, for the selected sunny day on July 04, 2019.
The highest energy values were found to be in both positions as the lowest energy losses with the lowest energy loss percentage was in Rutba City, the lowest energy in both positions and the highest energy losses with the lowest percentage was in Basra City. However, it’s very difficult to decide the optimum solar energy capacity site according to only one-day results. In fact, at least the results of one year may show the optimum solar energy capacity site as shown in Table 4.
The daily energy destribution for the selected sunny day of July 04, 2019 for four selected cities.
| City | Annual optimum tilt angle | Two axis tracking system | ||||||
|---|---|---|---|---|---|---|---|---|
| Energy (temp. effect) MWh | Energy (no temp. effect) MWh | Energy losses MWh | Energy losses % | Energy (temp. effect) MWh | Energy (no temp. effect) MWh | Energy losses MWh | Energy losses % | |
| Baghdad | 94.429 | 111.561 | 17.132 | 18.14 | 132.190 | 158.268 | 26.078 | 19.72 |
| Rutba | 104.184 | 119.165 | 14.981 | 14.37 | 156.328 | 182.070 | 25.742 | 16.46 |
| Mosul | 100.183 | 116.135 | 15.951 | 15.92 | 146.477 | 172.399 | 25.921 | 17.69 |
| Basra | 88.833 | 110.187 | 21.354 | 24.03 | 118.635 | 143.623 | 24.988 | 21.06 |
Figure 7 (a)–(d) depict the monthly generated energy at two positions, with and without temperature effects, for Baghdad, Rutba, Mosul, and Basra, respectively. The rate of energy production in PV systems increases with increasing solar irradiance. In comparison, the PV systems with two-axis tracking generate energy higher than the yearly title angle PV systems at the same time. The rate of energy degradation is rising due to the increment in the temperature of solar cells, as energy degradation is higher than in STC. The results showed that for all Iraqi cities during the summer, the rate of energy production increased due to the increment in the amount of solar irradiance as well as the increment in the daylight summer hours, but from a different point of view, the energy degradation increased even more in the winter season. The results showed that there was a little positive impact in the winter season through improving the energy production for all cities located in the northern part of the Iraqi territories.
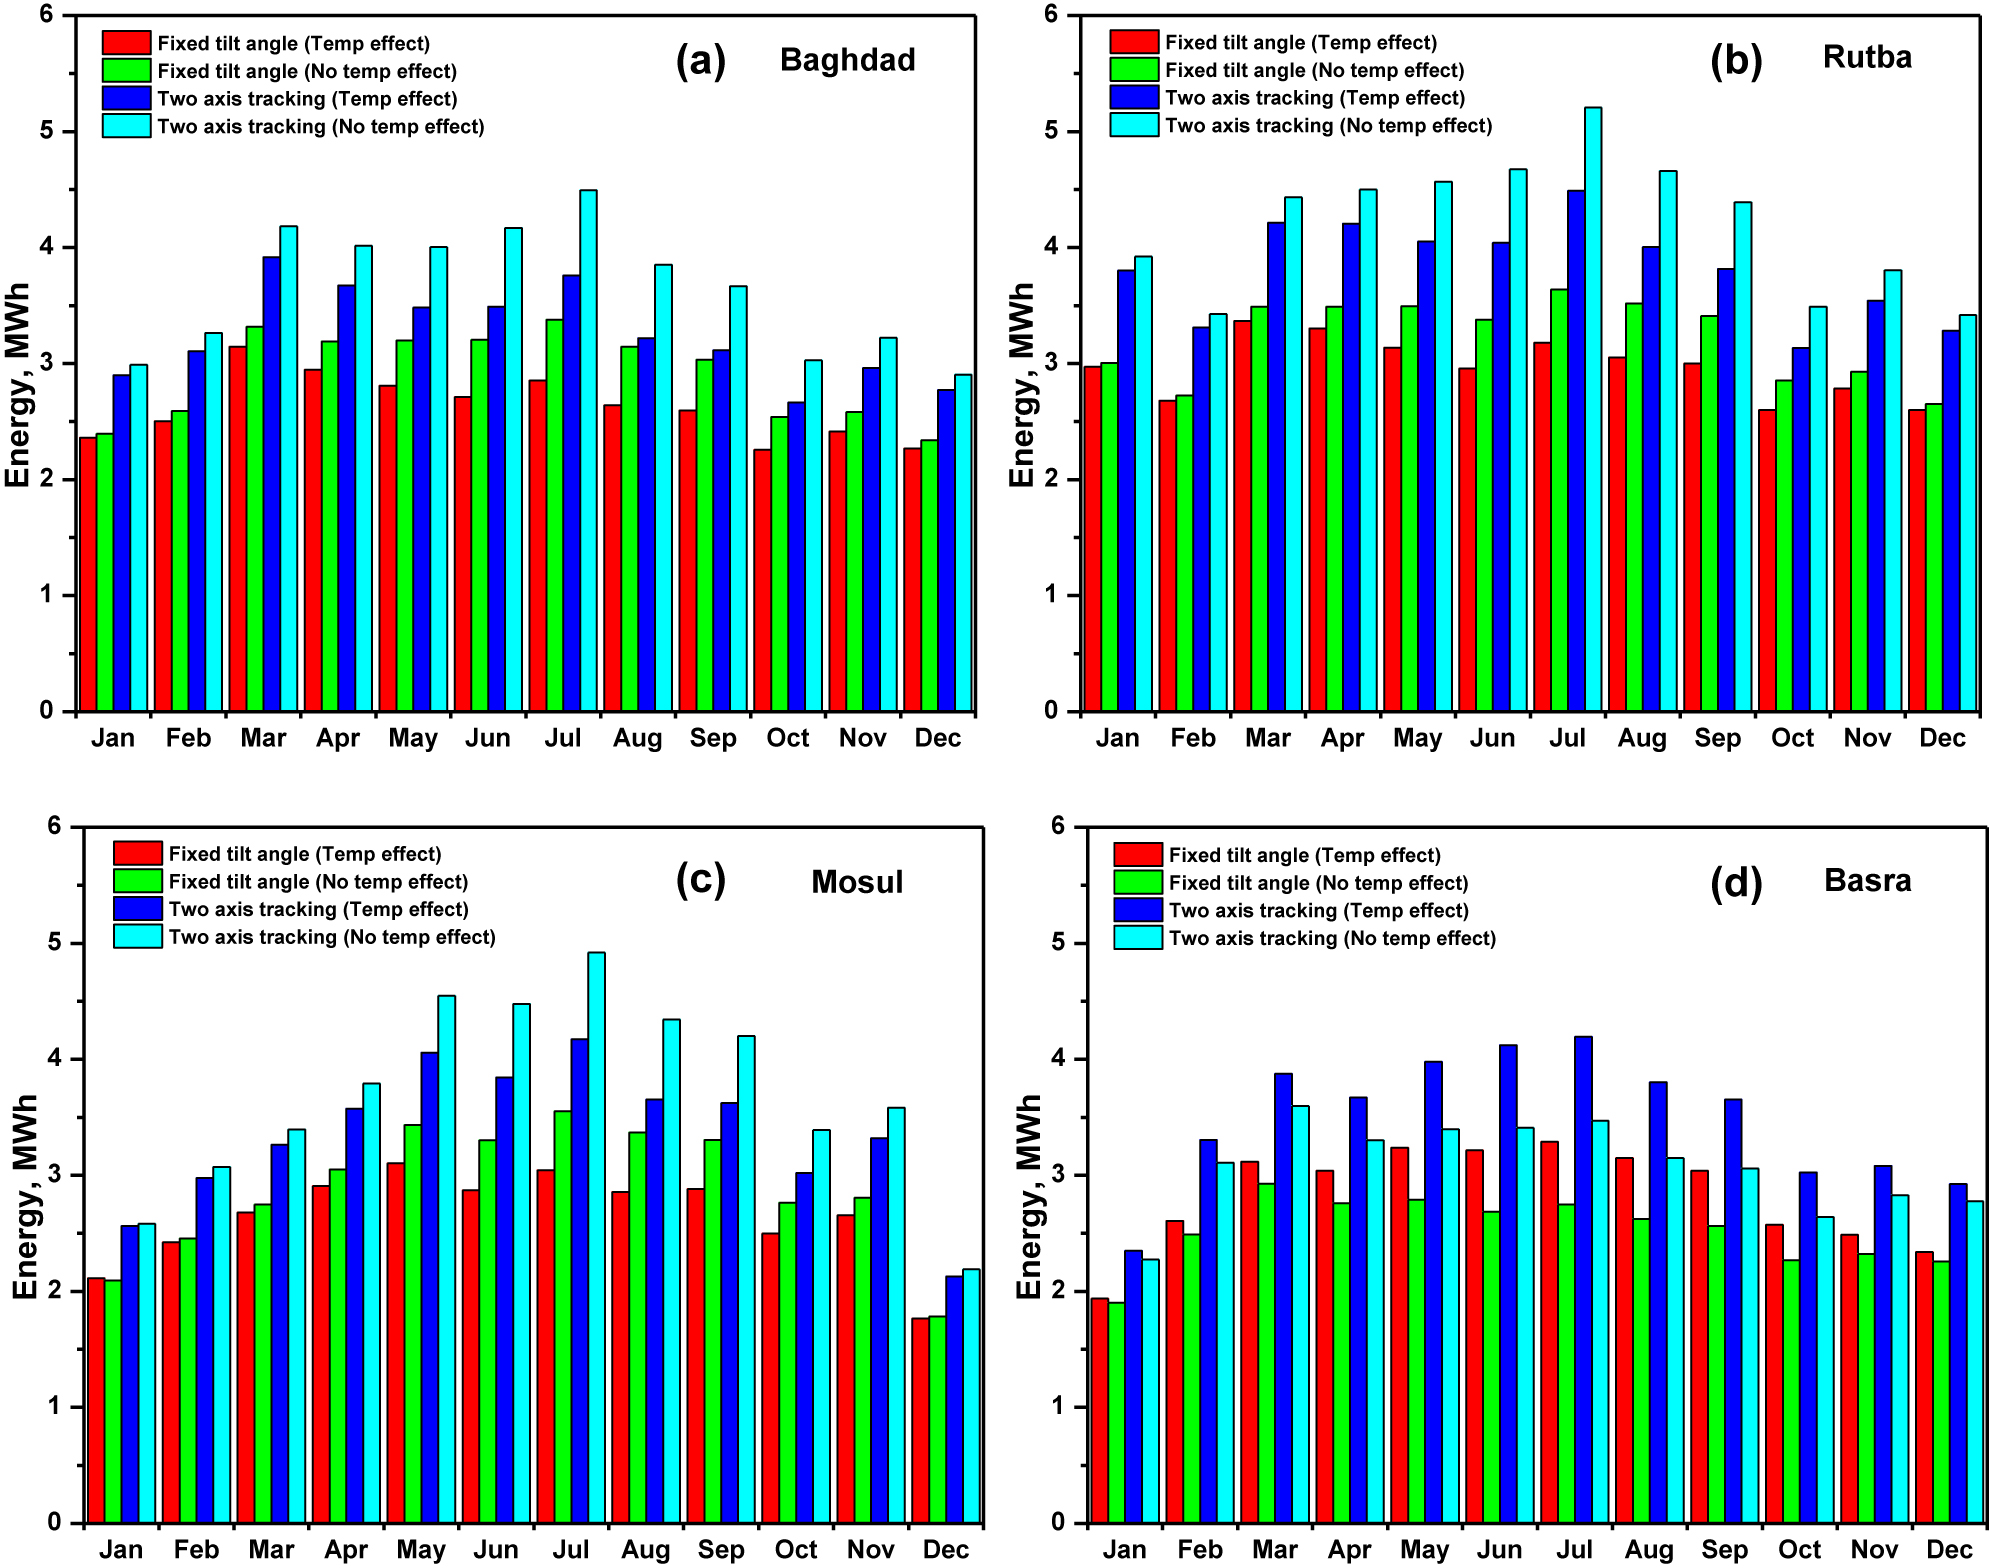
The monthly average energy generated at the annual optimum tilt angle and two-axis tracking system with and without temperature effect.
The percentage of the monthly average energy losses, due to the temperature effect, at the optimum tilt angle and two-axis tracking system for the cities of Baghdad, Rutba, Mosul, and Basra are presented in Figure 8 (a) and (d) respectively. The summer months (May-September) see an increase in energy losses, while the winter months (October–April) see a decrease. In the northern territories of Iraq, the preferable effect of ambient temperature can help by about 0.89% in Mosul, 1.97% in Dohok, 1.01% in Erbil and 0.28% in Sulaymaniyah. This has been carried out for the system with an annual positioning tilt angle, while for the two-axis tracking system there will be a generated degradation. In the southern territories, the ambient temperature is very high during the summer season, which leads to a deterioration in energy production. The deterioration in the tracking system is always more than the deterioration in the fixed positioning.
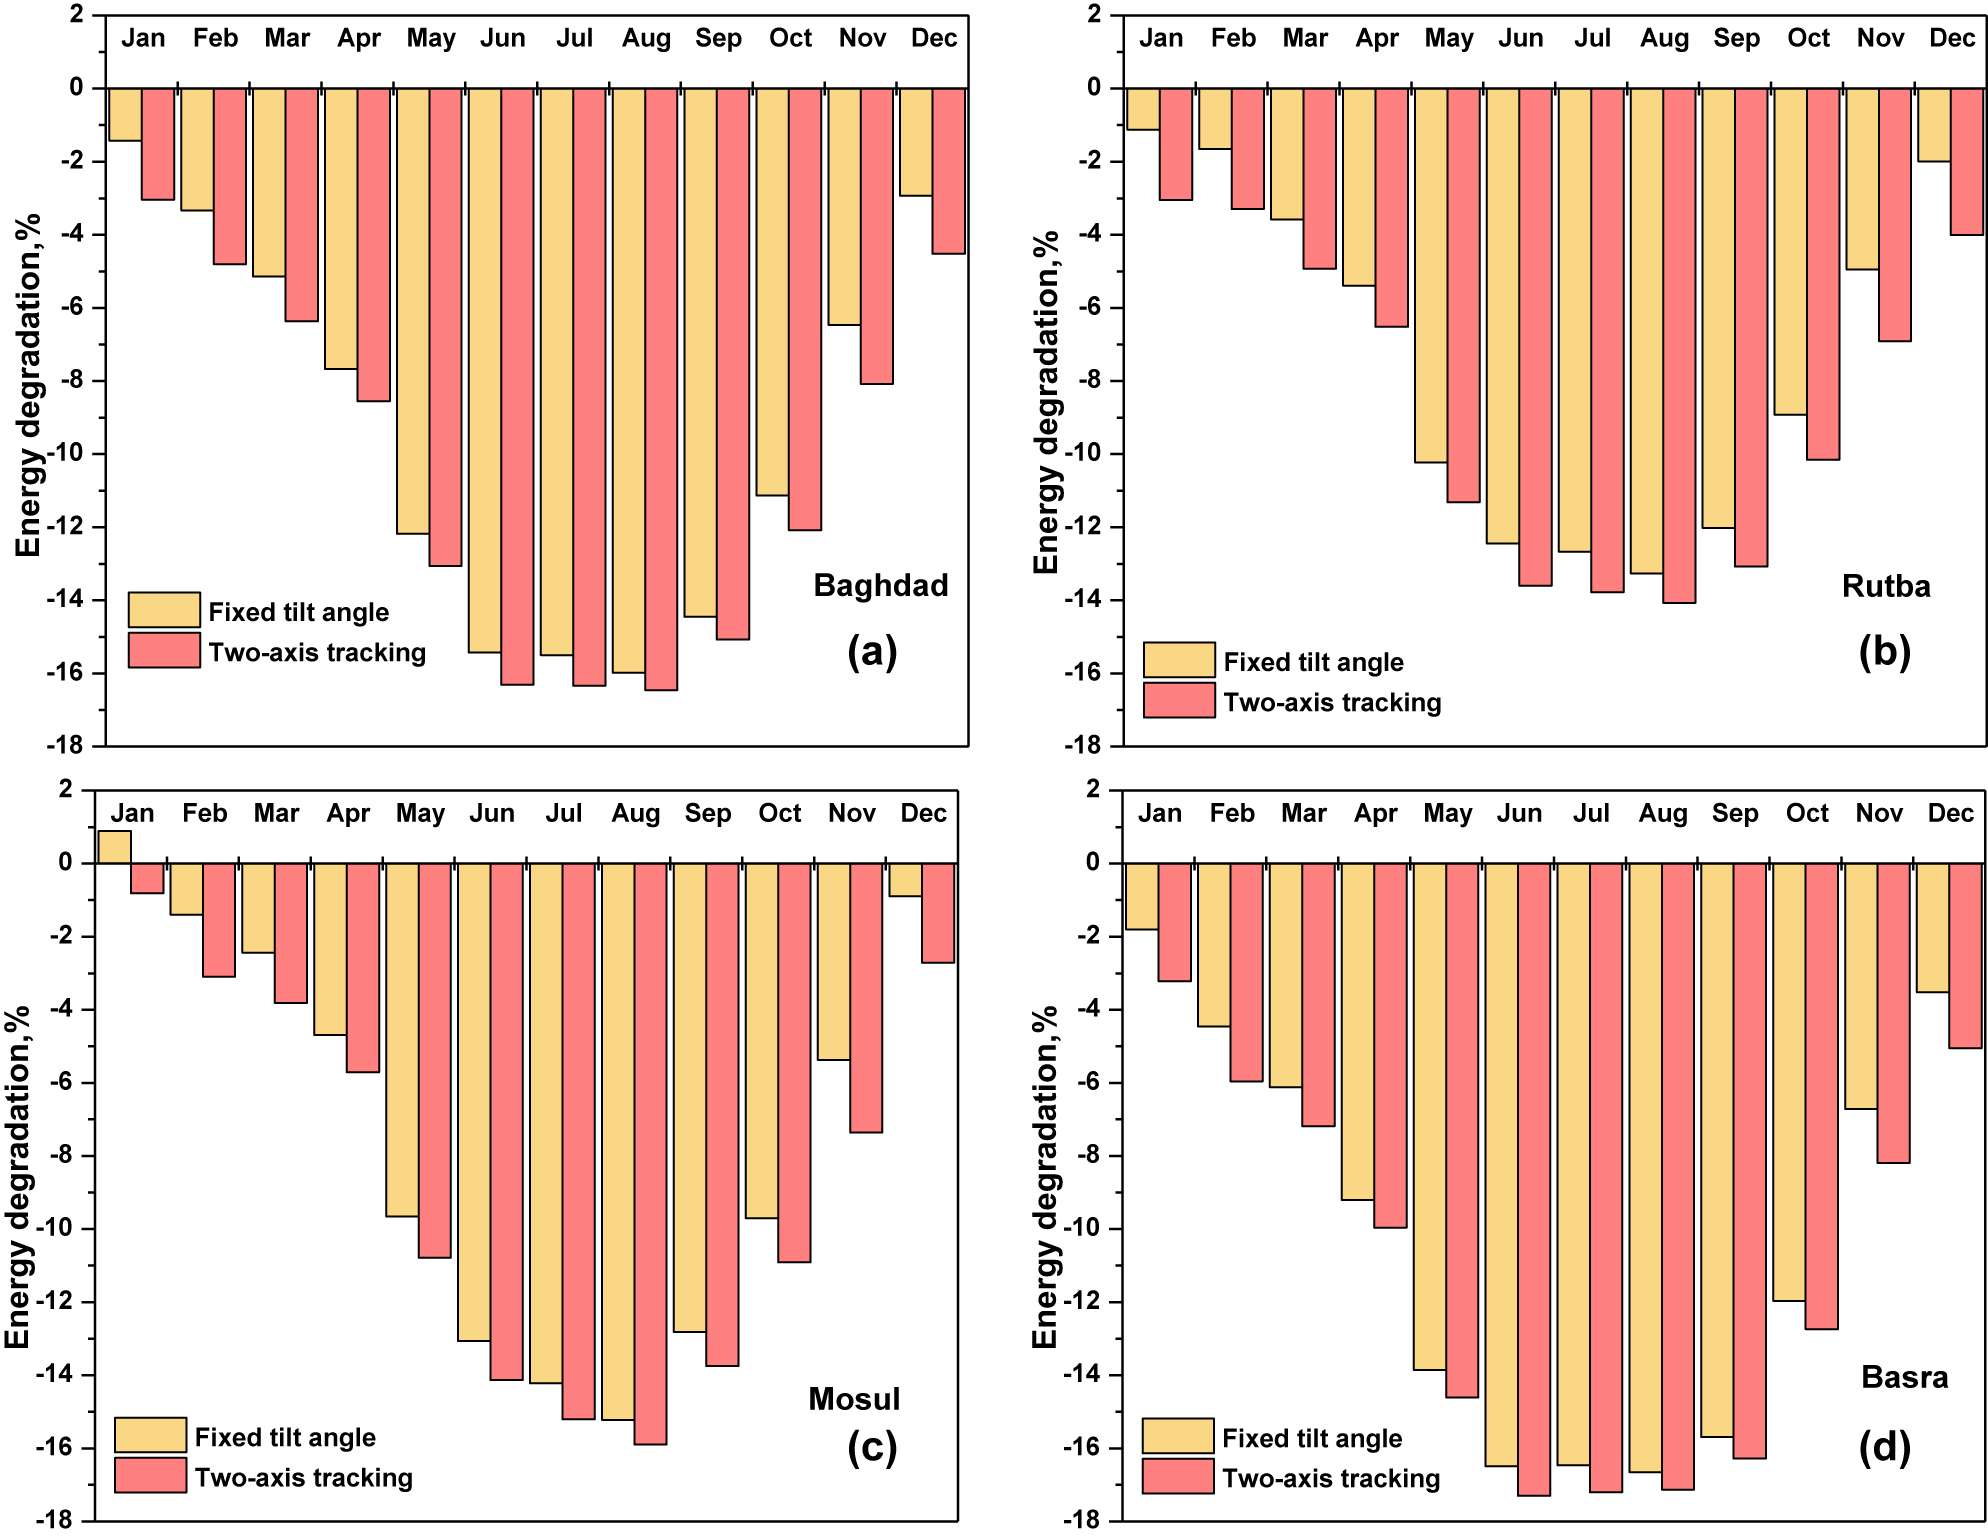
The monthly average energy degradation percentage due to the temperature effect at optimum tilt angle and two-axis tracking system.
Figure 9 shows that the largest amount of power can be produced that ranges between (8000 and 14,000 kW). This can be carried out when the temperature of the photovoltaic cells is between (60–75 °C) and there is some variation between cities in this range. This might be attributed to the higher amount of solar radiation. The highest energy value has been evaluated to be in the range between (16,000–20,000 kW) when the temperature ranges between (25–35 °C).
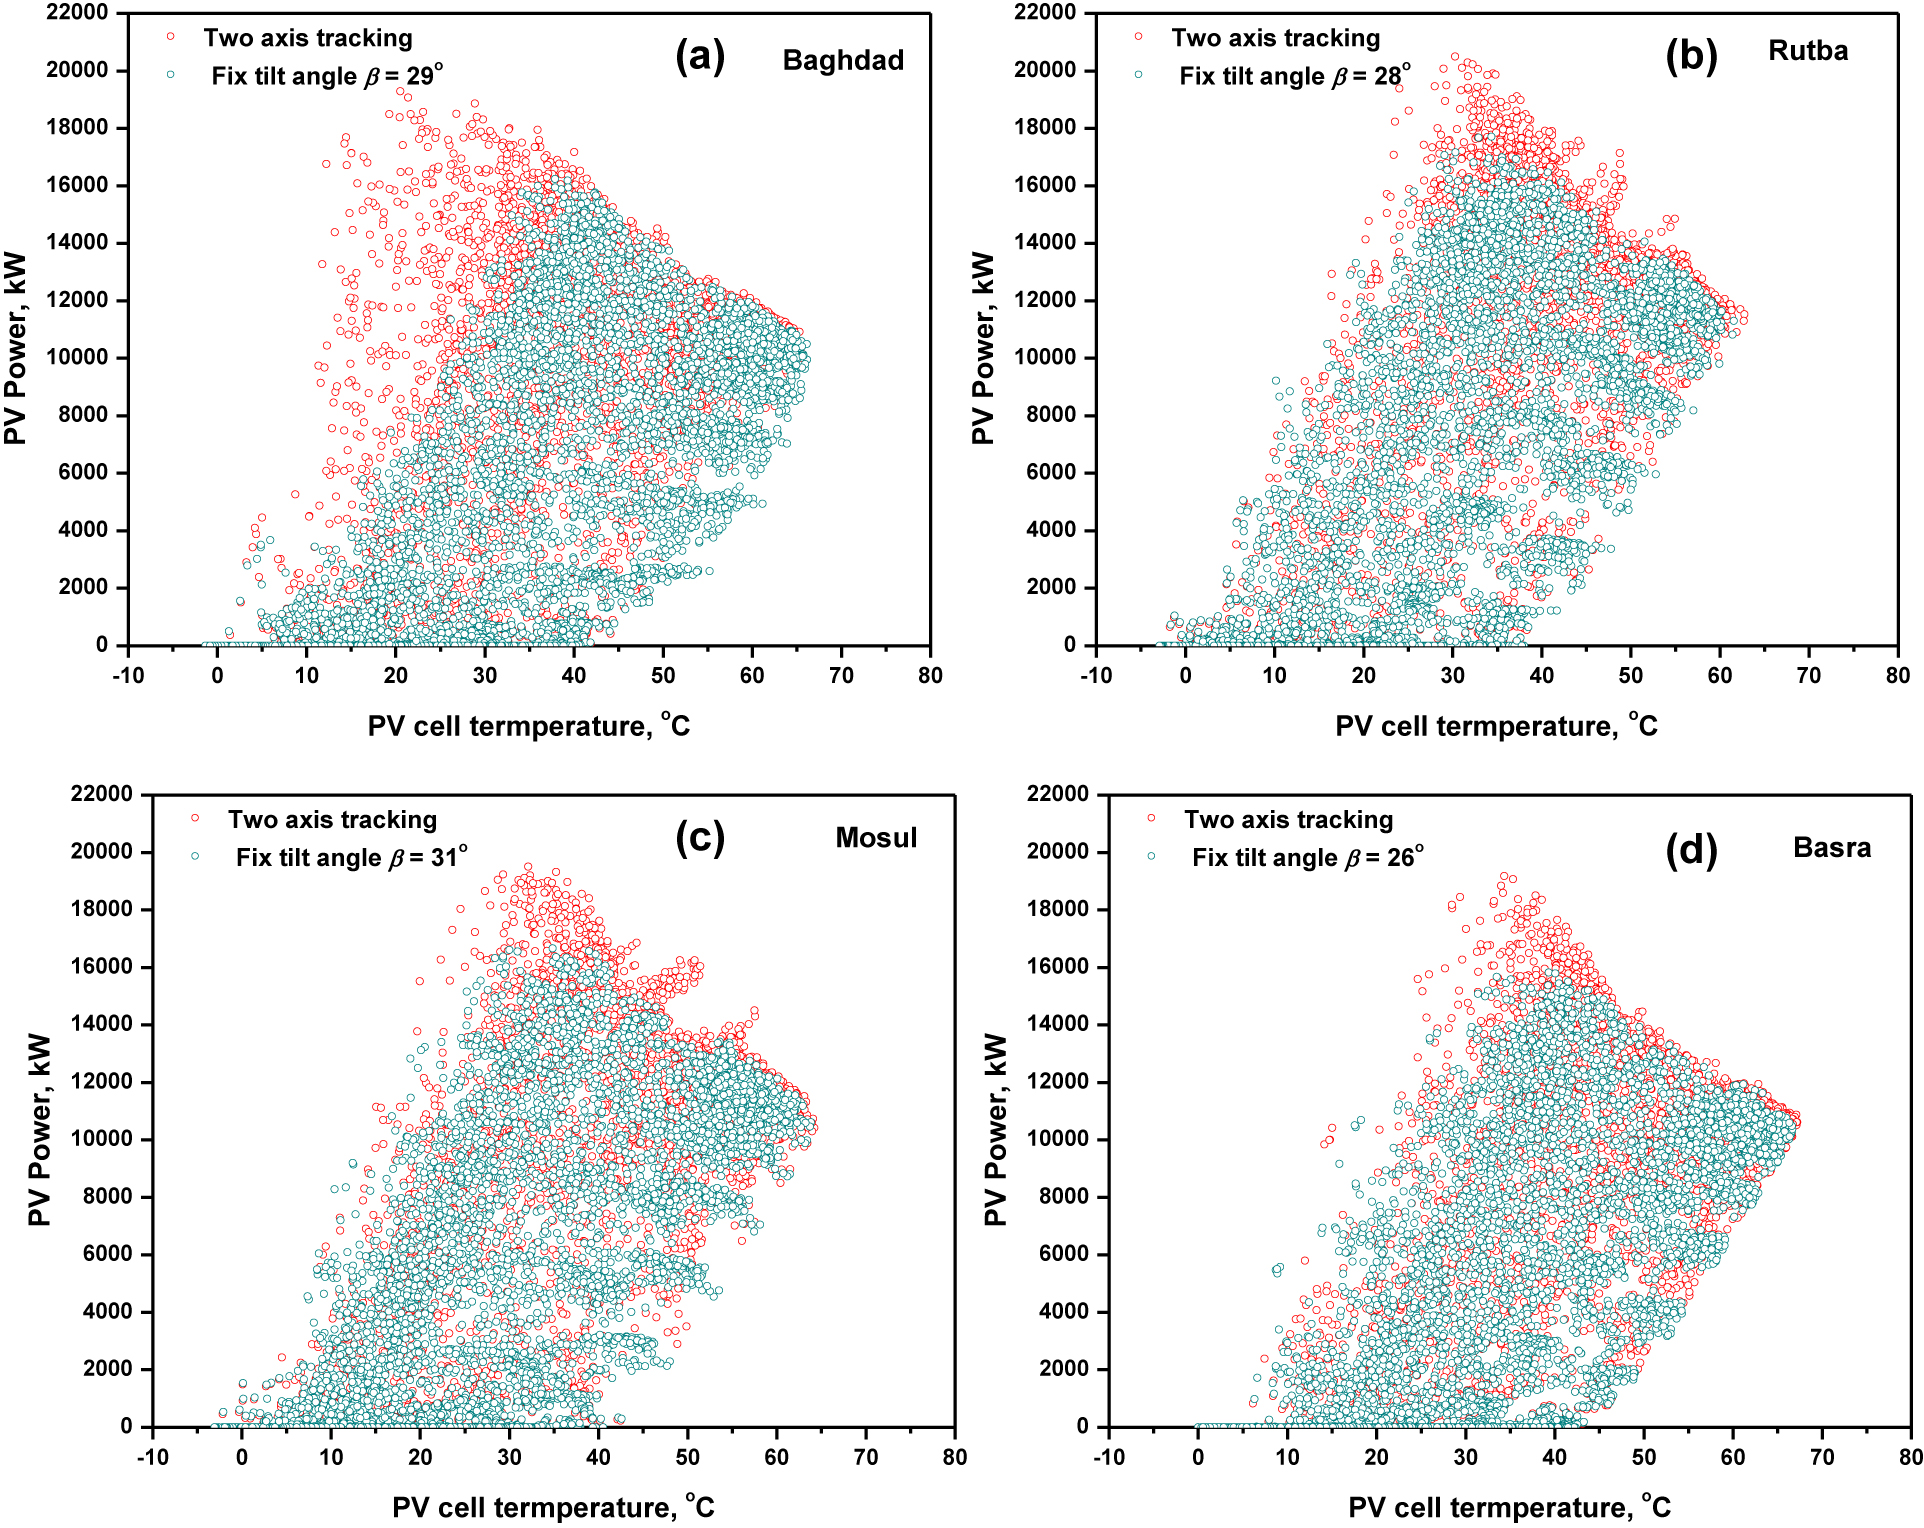
The hourly PV power produced by the visrus PV cell temperature at the optimal tilt angle and two-axis tracking system.
Table 5 shows the expected yearly energy generated for 19 cities of Iraq in two positionings (two-axis tracking system and annual optimum tilt angle) as the annual optimal tilt angles for Iraq territories prepared by Hassan et al. (2021). The highest sole energy can be generated in the Iraqi middle western territories due to the highest solar irradiance, highest wind speed and lowest ambient temperature (desert regions). Whereas, the expected solar energy generated in the northern–east will be of the lowest value, because of the lowest solar irradiance region of Iraq. The Middle East and southern territories have high solar irradiance and high ambient temperatures, which lead to generating high energy losses.
Nineteen cities, the estimated yearly energy generated in MWh with or without temperature effect at the annual optimum tilt angle and two-axis tracking system.
| City | Fixed tilt angle | Two axis tracking system | |||
|---|---|---|---|---|---|
| Temp effect | No temp effect | β ο | Temp effect | No temp effect | |
| Baghdad | 31,514.400 | 34,917.400 | 29 | 39,051.500 | 43,789.100 |
| Rutba | 35,631.500 | 38,591.300 | 28 | 45,892.600 | 50,490.400 |
| Mosul | 31,801.900 | 34,667.500 | 31 | 40,196.200 | 44,490.300 |
| Basra | 34,029.500 | 30,329.000 | 26 | 41,979.800 | 37,016.200 |
Figure 10 (a) and (b) describe the potential solar irradiance, generated solar energy, and energy losses due to the ambient temperature effects for two considered positionings (annual optimal tilt angles two-axis tracking system) respectively.
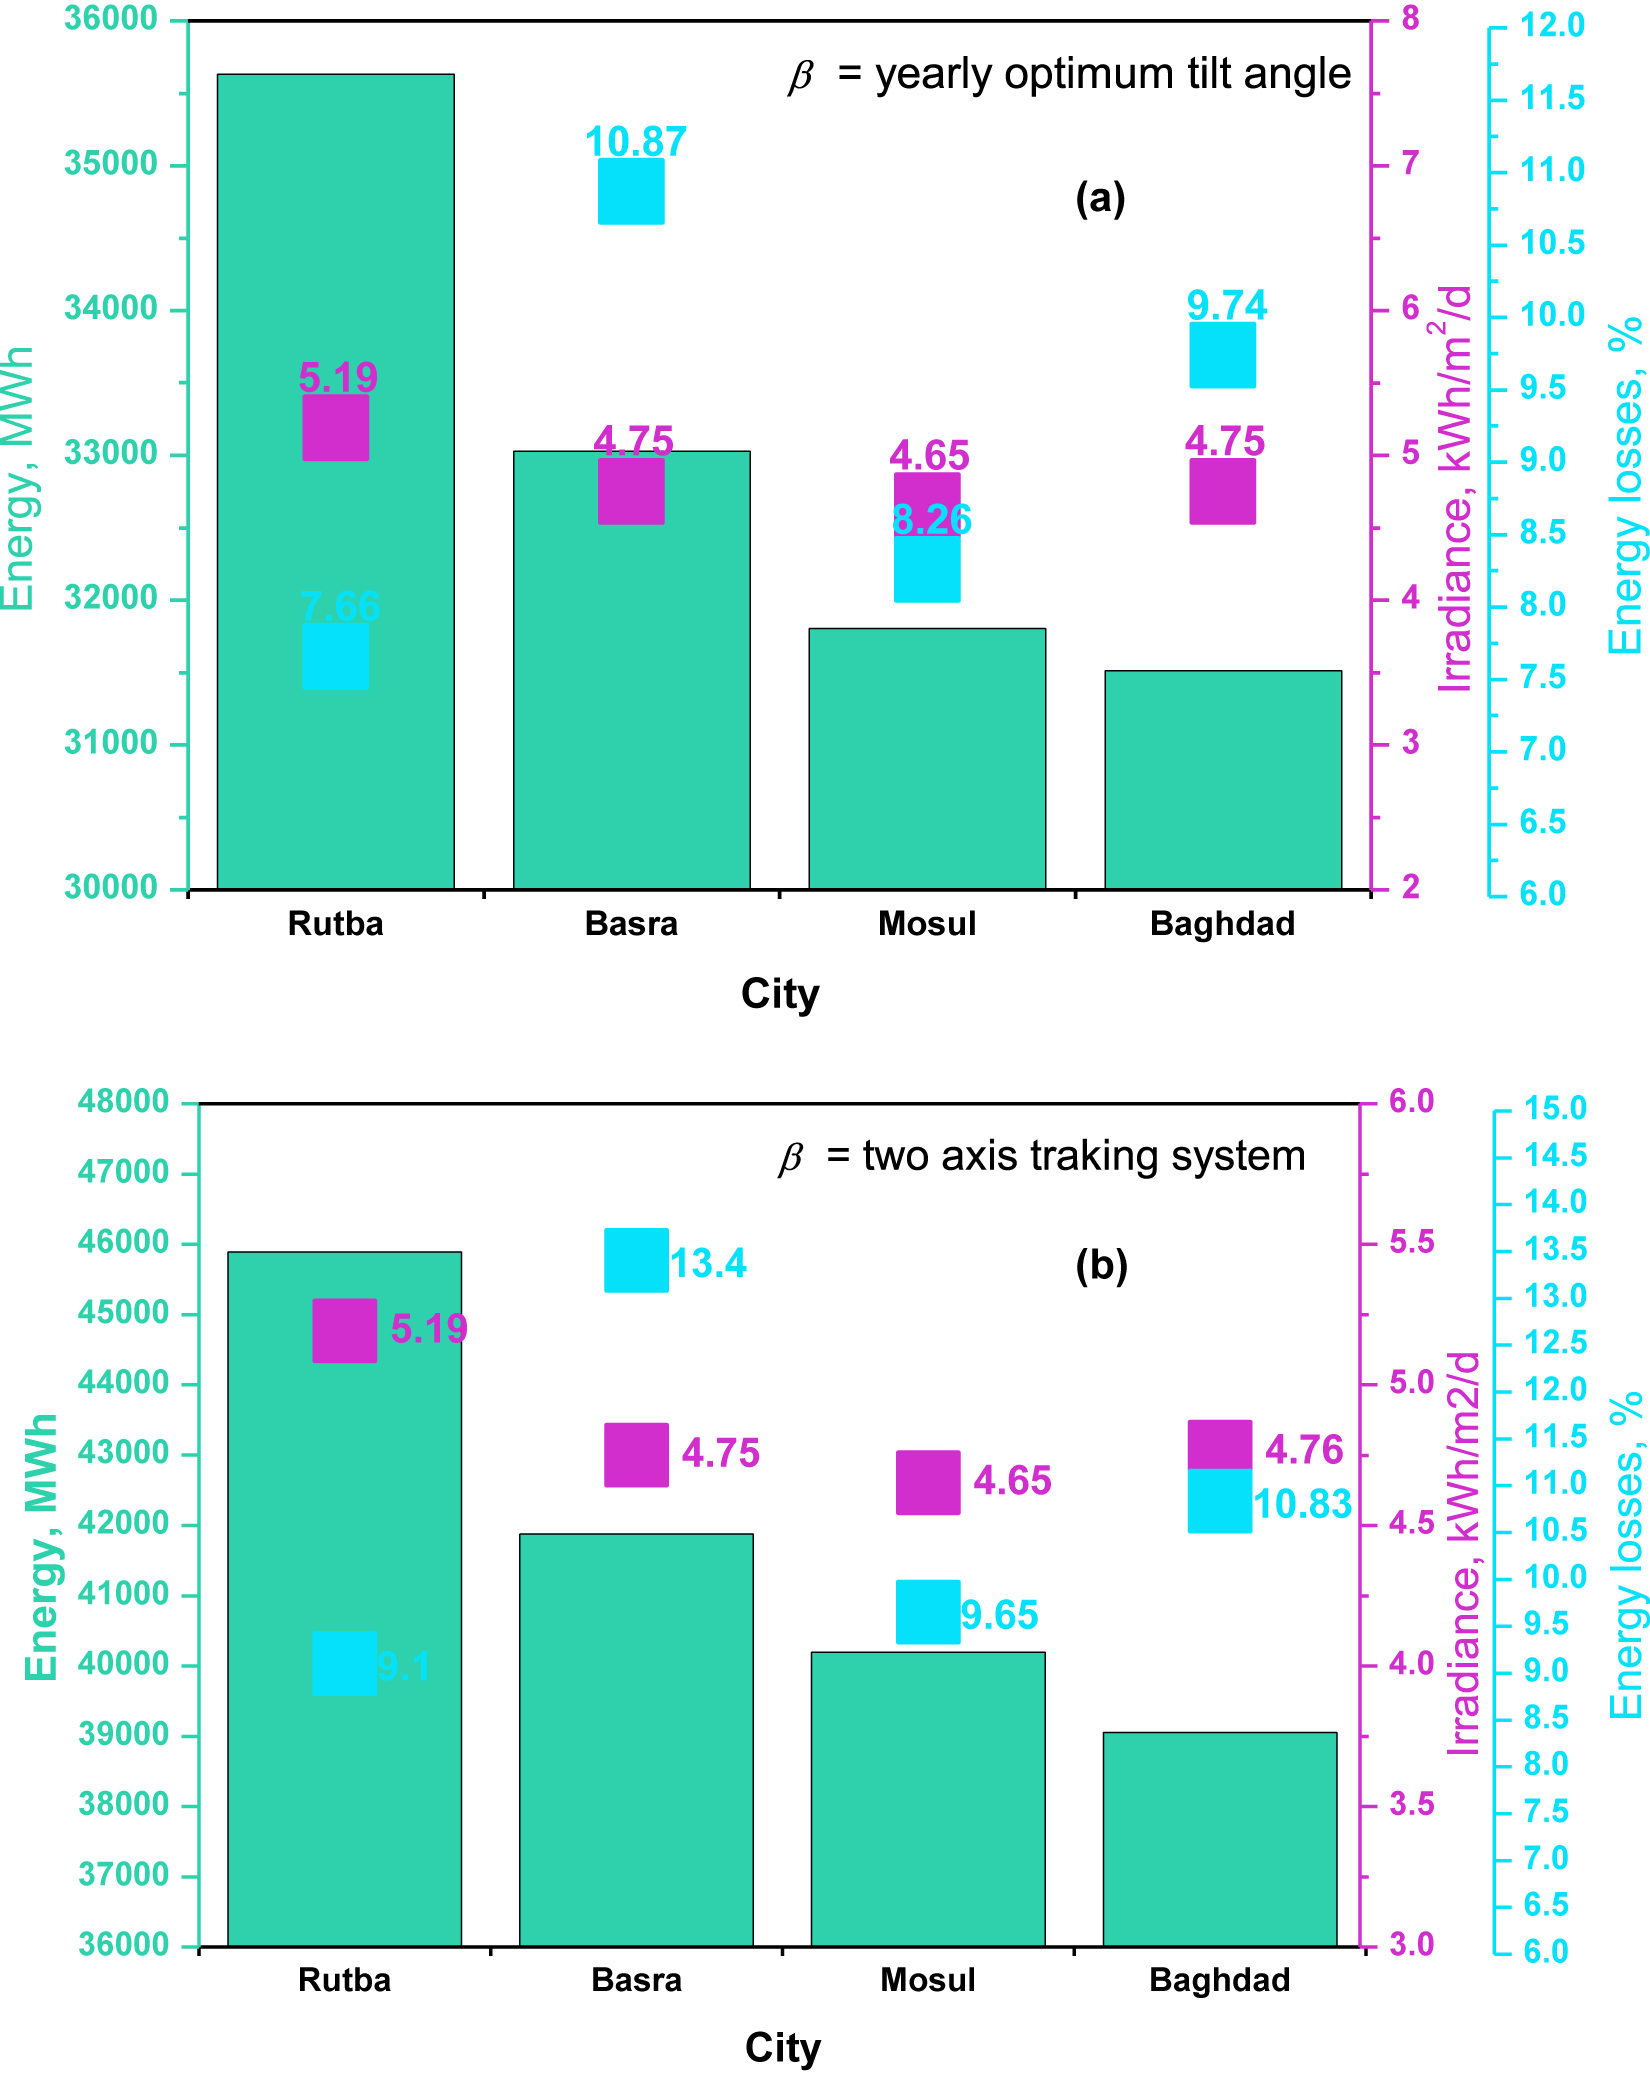
The annual energy generated from high to low is based on temperature effects for (a) annual optimum tilt angle (a) and (b) two-axis tracking system.
The rate of produced energy is evaluated to be of less value as compared to the cities that have the lowest solar irradiance. This might be explained by the fact that the higher temperature of the PV cells will lead to the deterioration of the energy production. For example, the rate of solar irradiance in Basra city is high, but the energy degradation is high also. This might be carried out due to the effect of high temperatures and low wind speed in this city. The annual rate of energy loss based on the annual tilt angle by about 7.6% for Rutba, 10.8% for Basra, 8.2% for Mosul and 9.7% for Baghdad, as shown in Figure 10 (a). The annual rate of energy loss based on the two-axis tracking system is about 9.1% for Rutba, 10.8% for Basra, 31.4% for Mosul, and 10.8% for Baghdad, as shown in Figure 10 (b).
Conclusions
With the increasing electric power demand, existing electrical grids should have the capacity to accommodate power from renewable energy generators. The viability of energy generated by solar powerplants plays a vital role in organising relevant information and making decisions for further improvements in performance. In the present work, solar energy visibility has been carried out for four cities in Iraq by using hourly experimental weather data for the period from January 1st to December 31st of 2019. Three main experimental weather parameters (solar irradiance, wind speed, and ambient temperature) were considered for the evolution of solar energy which can be generated by using the 20 MW capacity of the solar power plant. The hourly simulation processes conducted by MATLAB represent a numerical method for evaluating the expected energy for each city individually based on two positionings (two-axis tracking system and annual optimum tilt angle orientation). The results demonstrated that the ambient temperature and wind speed are important parameters that can play an important role in the rate of solar energy production by PV systems, especially in hot countries such as Iraq. The obtained conclusions from this study can be expressed as below:
The daily average expected solar irradiance on the horizontal plane ranged between (4.87 kWh/m2 in Mosul and 5.53 kWh/m2 in Rutba).
The expected solar energy that can be generated by using optimal annual positioning adjustment varies from one city to another.
The higher energy losses, due to the ambient temperature, percentage was about 13.4% in Basra and the lower energy losses percentage was about 9.6 in Mosul.
The highest potential solar energy has been observed in the mid-west territories of Iraq, which is considered the optimal investment and site, as the lowest potential energy was in the northeast terrorist.
In the mid-west territories, higher potential solar radiation, lower ambient temperature, and higher wind speed can be obtained.
Solar energy systems based on PV panels might not be the most innovative, but they are still considered to be important for many industrial applications. Thus, this kind of investigation takes the interest of a wide community, as it has not been conducted before for all cities in Iraq.
-
Author contributions: All the authors have accepted responsibility for the entire content of this submitted manuscript and approved submission.
-
Research funding: None declared.
-
Conflict of interest statement: The authors declare no conflicts of interest regarding this article.
References
Abbas, M. K., Q. Hassan, M. Jaszczur, Z. S. Al-Sagar, A. N. Hussain, A. Hasan, and A. Mohamad. 2021. “Energy Visibility of a Modeled Photovoltaic/Diesel Generator Set Connected to the Grid.” Energy Harvesting and Systems, https://doi.org/10.1515/ehs-2021-0022, 9;27–27.Search in Google Scholar
Abdulateef, A. M., M. Jaszczur, Q. Hassan, R. Anish, H. Niyas, K. Sopian, and J. Abdulateef. 2021. “Enhancing the Melting of Phase Change Material Using a Fins–Nanoparticle Combination in a Triplex Tube Heat Exchanger.” Journal of Energy Storage 35: 102227, https://doi.org/10.1016/j.est.2020.102227.Search in Google Scholar
Ahmed, R., V. Sreeram, Y. Mishra, and M. D. Arif. 2020. “A Review and Evaluation of the State-of-the-Art in PV Solar Power Forecasting: Techniques and Optimization.” Renewable and Sustainable Energy Reviews 124: 109792, https://doi.org/10.1016/j.rser.2020.109792.Search in Google Scholar
Al-Dahidi, S., O. Ayadi, M. Alrbai, and J. Adeeb. 2019. “Ensemble Approach of Optimized Artificial Neural Networks for Solar Photovoltaic Power Prediction.” IEEE Access 7: 81741–58, https://doi.org/10.1109/access.2019.2923905.Search in Google Scholar
AlHakeem, D., P. Mandal, A. U. Haque, A. Yona, T. Senjyu, and T. L. Tseng. 2015. “A New Strategy to Quantify Uncertainties of Wavelet-GRNN-PSO Based Solar PV Power Forecasts Using Bootstrap Confidence Intervals.” In 2015 IEEE Power & Energy Society General Meeting, 1–5. IEEE.10.1109/PESGM.2015.7286233Search in Google Scholar
Almonacid, F., P. J. Pérez-Higueras, E. F. Fernández, and L. Hontoria. 2014. “A Methodology Based on Dynamic Artificial Neural Network for Short-Term Forecasting of the Power Output of a PV Generator.” Energy Conversion and Management 85: 389–98, https://doi.org/10.1016/j.enconman.2014.05.090.Search in Google Scholar
Behar, O., A. Khellaf, and K. Mohammedi. 2013. “A Review of Studies on Central Receiver Solar Thermal Power Plants.” Renewable and Sustainable Energy Reviews 23: 12–39, https://doi.org/10.1016/j.rser.2013.02.017.Search in Google Scholar
Carrión, J. A., A. E. Estrella, F. A. Dols, M. Z. Toro, M. Rodríguez, and A. R. Ridao. 2008. “Environmental Decision-Support Systems for Evaluating the Carrying Capacity of Land Areas: Optimal Site Selection for Grid-Connected Photovoltaic Power Plants.” Renewable and Sustainable Energy Reviews 12 (9): 2358–80.10.1016/j.rser.2007.06.011Search in Google Scholar
Ceran, B., A. Mielcarek, Q. Hassan, J. Teneta, and M. Jaszczur. 2021. “Aging Effects on Modelling and Operation of a Photovoltaic System with Hydrogen Storage.” Applied Energy 297: 117161, https://doi.org/10.1016/j.apenergy.2021.117161.Search in Google Scholar
Charabi, Y., and A. Gastli. 2011. “PV Site Suitability Analysis Using GIS-Based Spatial Fuzzy Multi-Criteria Evaluation.” Renewable Energy 36 (9): 2554–61, https://doi.org/10.1016/j.renene.2010.10.037.Search in Google Scholar
Das, S. 2020. “Short Term Forecasting of Solar Radiation and Power Output of 89.6 kWp Solar PV Power Plant.” Materials Today: Proceedings 39: 1959–69, https://doi.org/10.1016/j.matpr.2020.08.449.Search in Google Scholar
Haas, R., C. Panzer, G. Resch, M. Ragwitz, G. Reece, and A. Held. 2011. “A Historical Review of Promotion Strategies for Electricity from Renewable Energy Sources in EU Countries.” Renewable and Sustainable Energy Reviews 15 (2): 1003–34, https://doi.org/10.1016/j.rser.2010.11.015.Search in Google Scholar
Hassan, Q. 2020. “Optimisation of Solar-Hydrogen Power System for Household Applications.” International Journal of Hydrogen Energy 45: 33111–27, https://doi.org/10.1016/j.ijhydene.2020.09.103.Search in Google Scholar
Hassan, Q. 2021a. “Evaluation and Optimization of Off-Grid and On-Grid Photovoltaic Power System for Typical Household Electrification.” Renewable Energy 164: 375–90.10.1016/j.ijhydene.2020.09.103Search in Google Scholar
Hassan, Q. 2021b. “Assessing of Renewable Energy for Electrical Household Ancillary Based on Photovoltaics and Wind Turbines.” Materials Science and Engineering 1076 (1): 012006, https://doi.org/10.1088/1757-899x/1076/1/012006.Search in Google Scholar
Hassan, Q. 2022. “Evaluate the Adequacy of Self-Consumption for Sizing Photovoltaic System.” Energy Reports 8: 239–54, https://doi.org/10.1016/j.egyr.2021.11.205.Search in Google Scholar
Hassan, Q., and M. Jaszczur. 2021. “Self-Consumption and Self-Sufficiency Improvement for Photovoltaic System Integrated with Ultra-supercapacitor.” Energies 14 (23): 7888, https://doi.org/10.3390/en14237888.Search in Google Scholar
Hassan, Q., M. Jaszczur, A. M. Abdulateef, J. Abdulateef, A. Hasan, and A. Mohamad. 2022. “An Analysis of Photovoltaic/Supercapacitor Energy System for Improving Self-Consumption and Self-Sufficiency.” Energy Reports 8: 680–95, https://doi.org/10.1016/j.egyr.2021.12.021.Search in Google Scholar
Hassan, Q., M. Jaszczur, and E. Przenzak. 2017. “Mathematical Model for the Power Generation from Arbitrarily Oriented Photovoltaic Panel.” E3S Web of Conferences 14: 01028, https://doi.org/10.1051/e3sconf/20171401028.Search in Google Scholar
Hassan, Q., M. Jaszczur, E. Przenzak, and J. Abdulateef. 2016. “The PV Cell Temperature Effect on the Energy Production and Module Efficiency.” Contemporary Problems of Power Engineering and Environmental Protection 1–33.10.1051/e3sconf/20171401028Search in Google Scholar
Hassan, Q., M. K. Abbas, A. M. Abdulateef, J. Abulateef, and A. Mohamad. 2021. “Assessment the Potential Solar Energy with the Models for Optimum Tilt Angles of Maximum Solar Irradiance for Iraq.” Case Studies in Chemical and Environmental Engineering 4: 100140, https://doi.org/10.1016/j.cscee.2021.100140.Search in Google Scholar
Höfer, T., Y. Sunak, H. Siddique, and R. Madlener. 2016. “Wind Farm Siting Using a Spatial Analytic Hierarchy Process Approach: A Case Study of the Städteregion Aachen.” Applied Energy 163: 222–43.10.1016/j.cscee.2021.100140Search in Google Scholar
Imam, A. A., and Y. A. Al-Turki. 2020. “Techno-Economic Feasibility Assessment of Grid-Connected PV Systems for Residential Buildings in Saudi Arabia—A Case Study.” Sustainability 12 (1): 262.10.1016/j.apenergy.2015.10.138Search in Google Scholar
Imteyaz, B., D. U. Lawal, F. Tahir, and S. Rehman. 2021. “Prospects of Large-Scale Photovoltaic-Based Power Plants in the Kingdom of Saudi Arabia.” Engineering Reports 3: e12398, https://doi.org/10.1002/eng2.12398.Search in Google Scholar
International Energy Agency. 2014. Technology Roadmap – Solar Thermal Electricity 2014, IEA, Paris. Also available at https://www.iea.org/reports/technology-roadmap-solar-thermal-electricity-2014.10.1002/eng2.12398Search in Google Scholar
International Energy Agency. 2020. Technology Roadmap: Solar Photovoltaic Energy, IEA. Also available at http://www.iea.org/publications.Search in Google Scholar
Janke, J. R. 2010. “Multicriteria GIS Modeling of Wind and Solar Farms in Colorado.” Renewable Energy 35 (10): 2228–34, https://doi.org/10.1016/j.renene.2010.03.014.Search in Google Scholar
Jaszczur, M., J. Teneta, Q. Hassan, E. Majewska, and R. Hanus. 2019a. “An Experimental and Numerical Investigation of Photovoltaic Module Temperature Under Varying Environmental Conditions.” Heat Transfer Engineering 42: 1–14, https://doi.org/10.1080/01457632.2019.1699306.Search in Google Scholar
Jaszczur, M., J. Teneta, Q. Hassan, E. Majewska, and R. Hanus. 2021a. “An Experimental and Numerical Investigation of Photovoltaic Module Temperature Under Varying Environmental Conditions.” Heat Transfer Engineering 42 (3–4): 354–67, https://doi.org/10.1080/01457632.2019.1699306.Search in Google Scholar
Jaszczur, M., and Q. Hassan. 2020. “An Optimisation and Sizing of Photovoltaic System with Supercapacitor for Improving Self-Consumption.” Applied Energy 279: 115776, https://doi.org/10.1016/j.apenergy.2020.115776.Search in Google Scholar
Jaszczur, M., Q. Hassan, A. M. Abdulateef, and J. Abdulateef. 2021b. “Assessing the Temporal Load Resolution Effect on the Photovoltaic Energy Flows and Self-Consumption.” Renewable Energy 169: 1077–90.10.1016/j.renene.2021.01.076Search in Google Scholar
Jaszczur, M., Q. Hassan, and J. Teneta. 2018. “Temporal Load Resolution Impact on PV/Grid System Energy Flows.” MATEC Web of Conferences 240: 04003, https://doi.org/10.1051/matecconf/201824004003.Search in Google Scholar
Jaszczur, M., Q. Hassan, K. Styszko, and J. Teneta. 2019b. “Impact of Dust and Temperature on Energy Conversion Process in Photovoltaic Module.” Thermal Science 23 (Suppl. 4): 1199–210, https://doi.org/10.2298/tsci19s4199j.Search in Google Scholar
Jaszczur, M., Q. Hassan, and P. Palej. 2019. “An Optimisation of the Hybrid Renewable Energy Systems.” E3S Web of Conferences 113: 03022, https://doi.org/10.1051/e3sconf/201911303022.Search in Google Scholar
Jaszczur, M., Q. Hassan, P. Palej, and J. Abdulateef. 2020. “Multi-Objective Optimisation of a Micro-Grid Hybrid Power System for Household Application.” Energy 202: 117738, https://doi.org/10.1016/j.energy.2020.117738.Search in Google Scholar
Kazem, H. A., and M. T. Chaichan. 2012. “Status and Future Prospects of Renewable Energy in Iraq.” Renewable and Sustainable Energy Reviews 16 (8): 6007–12, https://doi.org/10.1016/j.rser.2012.03.058.Search in Google Scholar
Kumar, B. S., and K. Sudhakar. 2015. “Performance Evaluation of 10 MW Grid Connected Solar Photovoltaic Power Plant in India.” Energy Reports 1: 184–92, https://doi.org/10.1016/j.egyr.2015.10.001.Search in Google Scholar
LEORY Solar Modules. Also available at https://leroymerlin.co.za.Search in Google Scholar
Map of Iraq. Also available at https://www.britannica.com/place/Iraq.Search in Google Scholar
Mekonnen, T., R. Bhandari, and V. Ramayya. 2021. “Modeling, Analysis and Optimization of Grid-Integrated and Islanded Solar PV Systems for the Ethiopian Residential Sector: Considering an Emerging Utility Tariff Plan for 2021 and Beyond.” Energies 14 (11): 3360, https://doi.org/10.3390/en14113360.Search in Google Scholar
Palej, P., H. Qusay, S. Kleszcz, R. Hanus, and M. Jaszczur. 2019. “Analysis and Optimization of Hybrid Renewable Energy Systems.” Polityka Energetyczna 22: 107–20, https://doi.org/10.33223/epj/109911.Search in Google Scholar
Paulescu, M., M. Brabec, R. Boata, and V. Badescu. 2017. “Structured, Physically Inspired (Gray Box) Models versus Black Box Modeling for Forecasting the Output Power of Photovoltaic Plants.” Energy 121: 792–802, https://doi.org/10.1016/j.energy.2017.01.015.Search in Google Scholar
Perović, B., D. Klimenta, M. Jevtić, and M. Milovanović. 2017. “An Analytical Model for Estimating the Temperature of a Photovoltaic Module Based on the Principle of Energy Balance.” Zbornik Međunarodne konferencije o obnovljivim izvorima električne energije–MKOIEE 5 (1): 89–95.Search in Google Scholar
Ramli, M. A., S. Twaha, and A. U. Alghamdi. 2017. “Energy Production Potential and Economic Viability of Grid-Connected Wind/PV Systems at Saudi Arabian Coastal Areas.” Journal of Renewable and Sustainable Energy 9 (6): 065910, https://doi.org/10.1063/1.5005597.Search in Google Scholar
Raza, M. Q., M. Nadarajah, and C. Ekanayake. 2016. “On Recent Advances in PV Output Power Forecast.” Solar Energy 136: 125–44, https://doi.org/10.1016/j.solener.2016.06.073.Search in Google Scholar
Reddy, S. S. 2017. “Optimal Scheduling of Thermal-Wind-Solar Power System with Storage.” Renewable Energy 101: 1357–68, https://doi.org/10.1016/j.renene.2016.10.022.Search in Google Scholar
Reddy, S. S., and P. R. Bijwe. 2015. “Real Time Economic Dispatch Considering Renewable Energy Resources.” Renewable Energy 83: 1215–26, https://doi.org/10.1016/j.renene.2015.06.011.Search in Google Scholar
Rehman, S., M. A. Ahmed, M. H. Mohamed, and F. A. Al-Sulaiman. 2017. “Feasibility Study of the Grid Connected 10 MW Installed Capacity PV Power Plants in Saudi Arabia.” Renewable and Sustainable Energy Reviews 80: 319–29, https://doi.org/10.1016/j.rser.2017.05.218.Search in Google Scholar
Santiago, I., D. Trillo-Montero, I. M. Moreno-Garcia, V. Pallarés-López, and J. J. Luna-Rodríguez. 2018. “Modeling of Photovoltaic Cell Temperature Losses: A Review and a Practice Case in South Spain.” Renewable and Sustainable Energy Reviews 90: 70–89, https://doi.org/10.1016/j.rser.2018.03.054.Search in Google Scholar
Schwingshackl, C., M. Petitta, J. E. Wagner, G. Belluardo, D. Moser, M. Castelli, M. Zebisch, and A. Tetzlaff. 2013. “Wind Effect on PV Module Temperature: Analysis of Different Techniques for an Accurate Estimation.” Energy Procedia 40: 77–86, https://doi.org/10.1016/j.egypro.2013.08.010.Search in Google Scholar
Tahri, M., M. Hakdaoui, and M. Maanan. 2015. “The Evaluation of Solar Farm Locations Applying Geographic Information System and Multi-Criteria Decision-Making Methods: Case Study in Southern Morocco.” Renewable and Sustainable Energy Reviews 51: 1354–62, https://doi.org/10.1016/j.rser.2015.07.054.Search in Google Scholar
Thotakura, S., S. C. Kondamudi, J. F. Xavier, M. Quanjin, G. R. Reddy, P. Gangwar, and S. L. Davuluri. 2020. “Operational Performance of Megawatt-Scale Grid Integrated Rooftop Solar PV System in Tropical Wet and Dry Climates of India.” Case Studies in Thermal Engineering 18: 100602, https://doi.org/10.1016/j.csite.2020.100602.Search in Google Scholar
Uyan, M. 2013. “GIS-based Solar Farms Site Selection Using Analytic Hierarchy Process (AHP) in Karapinar Region, Konya/Turkey.” Renewable and Sustainable Energy Reviews 28: 11–7, https://doi.org/10.1016/j.rser.2013.07.042.Search in Google Scholar
Weida, S., S. Kumar, and R. Madlener. 2016. “Financial Viability of Grid-Connected Solar PV and Wind Power Systems in Germany.” Energy Procedia 106: 35–45, https://doi.org/10.1016/j.egypro.2016.12.103.Search in Google Scholar
Xie, Y., M. Sengupta, and C. Wang. 2019. “A Fast All-Sky Radiation Model for Solar Applications with Narrowband Irradiances on Tilted Surfaces (FARMS-NIT): Part II. The Cloudy-Sky Model.” Solar Energy 188: 799–812, https://doi.org/10.1016/j.solener.2019.06.058.Search in Google Scholar
Yalcin, M., and F. K. Gul. 2017. “A GIS-Based Multi Criteria Decision Analysis Approach for Exploring Geothermal Resources: Akarcay Basin (Afyonkarahisar).” Geothermics 67: 18–28, https://doi.org/10.1016/j.geothermics.2017.01.002.Search in Google Scholar
Yunna, W., and S. Geng. 2014. “Multi-criteria Decision Making on Selection of Solar–Wind Hybrid Power Station Location: A Case of China.” Energy Conversion and Management 81: 527–33, https://doi.org/10.1016/j.enconman.2014.02.056.Search in Google Scholar
Zhang, J., A. Florita, B. M. Hodge, S. Lu, H. F. Hamann, V. Banunarayanan, and A. M. Brockway. 2015. “A Suite of Metrics for Assessing the Performance of Solar Power Forecasting.” Solar Energy 111: 157–75, https://doi.org/10.1016/j.solener.2014.10.016.Search in Google Scholar
© 2022 Walter de Gruyter GmbH, Berlin/Boston
Articles in the same Issue
- Frontmatter
- Research Articles
- Optimized routing with efficient energy transmission using Seline Trustworthy optimization for waste management in the smart cities
- Effectiveness of line type and cross type piezoelectric patches on active vibration control of a flexible rectangular plate
- Energy visibility of a modeled photovoltaic/diesel generator set connected to the grid
- Techno-economic analysis and design of hybrid renewable energy microgrid for rural electrification
- The comparison of triboelectric power generated by electron-donating polymers KAPTON and PDMS in contact with PET polymer
- Investigation of aerodynamic interaction between the balloon and the ducted wind turbine in airborne configuration
- Experimental investigation on treated transformer oil (TTO) and its diesel blends in the diesel engine
- Frequency response locking of electromagnetic vibration-based energy harvesters using a switch with tuned duty cycle
- Evaluation of energy generation in Iraqi territory by solar photovoltaic power plants with a capacity of 20 MW
- Review
- Quantitative analysis of DC–DC converter models: a statistical perspective based on solar photovoltaic power storage