
Basics of teaching electrochemical impedance spectroscopy of electrolytes for ion-rechargeable batteries – part 2: dielectric response of (non-) polymer electrolytes
-
Suhaila Idayu Abdul Halim

 and
Jan Apotheker
and
Jan Apotheker

Abstract
In the Part 2 of this article, we present the phenomenological response of the dielectric relaxation for polymer electrolytes monitored by electrochemical impedance spectroscopy (EIS) in terms of electrochemical point of view, such as impedance (Z*), permittivity (ε*), loss tangent (tan δ), modulus (M*) and conductivity (σ*) spectra. It is noteworthy to note that all the electrochemical aspects mentioned are of interest for conduction and seen as closely related to each other indirectly or directly. Two different systems; solid polymer electrolyte (SPE) [poly(ethylene oxide) (PEO) + lithium perchlorate (LiClO4)] and non-SPE [poly(methyl acrylate) (PMA) + LiClO4] were employed for discussion. EIS is a powerful technique to characterize the electrical properties of polymer electrolytes. The results suggest that impedance and modulus are of interest for decoupling of dielectric and electric properties by evaluating the short-range and long-range mobility of the charged entities, respectively. One is able to identify the conduction mechanism of the polymer electrolytes easily if the responses are well understood. The objective of this article to introduce a simplified yet an insightful background and technique that is easy to be followed and useful for educational purposes especially for beginners or young researchers for both undergraduates and postgraduates.
Introduction
The basics of electrolytes, electrochemical impedance spectroscopy (EIS) instrumentation and some fundamental background on electrolytes and batteries were elucidated in the Part 1 of this article. This article comprises two parts; Part 1 elucidates on good practical approach to estimate the electrical bulk properties of polymer electrolytes i.e. bulk resistance (Rb), that is inversely proportional to the conductivity (σDC) using different approaches and Part 2 illuminates more on the phenomenological changes of the charged entities of polymer electrolytes i.e. dielectric and electric relaxations, under an effect of oscillating electric field. This phenomenological point of view is addressed and highlighted systematically in the classic sense, in terms of impedance (Z*), permittivity (ε*), loss tangent (tan δ), modulus (M*) and conductivity (σ*) spectra.
Solid polymer electrolytes (SPEs) are usually formed by dissolution of inorganic salts in the polymers (Agrawal & Pandey, 2008; Alloin, D’Aprea, Kissi, Dufresne, & Bossard, 2010; Armand, 1986; Berthier et al., 1983; Chin Han Chan & Kammer, 2008). SPEs are seen as the potential candidate for the modern lithium ion (Li-ion) battery because in some cases they are able to perform as ionic conductors (Li, Chen, Fan, Kong, & Lu, 2016; Scrosati, Croce, & Panero, 2001). Since 40 years ago, poly(ethylene oxide) (PEO) has gained much popularity as a good polymer host for highly efficient SPEs for solid state devices e.g. lithium ion (Li-ion) rechargeable batteries, due to its higher solvation effect with a lot of inorganic salt (e.g. lithium salt, sodium salt etc.) (Abraham & Jiang, 1996; Chan et al., 2014; Das, Thakur, & Kumar, 2013; Harun, Chan, & Winie, 2017; Hassoun & Scrosati, 2010). The binary polymer-salt systems under the discussion of this article are the high molar mass semi-crystalline polymer, i.e. PEO (possess of crystalline and amorphous regions) and the amorphous polymer, i.e. poly(methyl acrylate) (PMA) of which both polymers were added with lithium salt (Li-salt), i.e. lithium perchlorate (LiClO4). It is widely known that ionic conduction takes place in the amorphous region (Chan, Sulaiman, Kammer, Sim, & Harun, 2011; Halim, Chan, & Winie, 2017; Karim, Sim, Chan, & Ramli, 2015; Pratap & Chandra, 2013). In this case, the percolation pathway takes place in the amorphous region of semi-crystalline PEO and PMA. PEO-LiClO4 system at room temperature is seen as heterogenous not only with respect to morphology (semi-crystalline), but also from electrical point of view. Double-layer capacitance resulting from polarization of charges can be seen not only at the electrolyte-electrode interfaces but also at the grain boundaries of amorphous and crystalline regions (Chan & Kammer, 2018; Wang et al., 2014). The conduction mechanism of PEO-LiClO4 at room temperature may be ruled chiefly by dielectric relaxation (polarization of the charged entities in the short-range motion), and the electric relaxation (flow of charged entities in the long-range motion) may start to become significantly important only when the system is in the molten state (above the melting point of PEO) (Chan & Kammer, 2016; Kammer, 2017). The second binary polymer-salt system under discussion is PMA-LiClO4. PMA is an amorphous polymer (Mead & Fuoss, 1942). Addition of Li-salt in PMA leads to small-scale interaction between PMA and Li-salt (Abdul Halim, Chan, & Kammer, 2019; Halim et al., 2017). The salt molecules in PMA are seen as slightly inactive as compared to PEO (Abdul Halim et al., 2019). The system may exhibit both resistive and capacitive behavior with comparative dielectric constant as PEO (at low content of salt) only after addition of high content of Li-salt. However, the binary PMA-LiClO4 system does not form any double-layer capacitance at the electrode-electrolyte interface even at high salt content under the experimental condition of this study.
Most of the solid polymer electrolytes, we merely have randomly oriented charged entities (dipoles) that generally interacting with each other, and these charged entities are seen to be aligning towards the direction of the oppositely charged electrodes under action of external electric field (Billah, 2019; Chan & Kammer, 2018; Kammer, 2017). However, in most cases, these dipolar entities are immobilized and gain mobility only due to the polymer chain relaxation (Martwiset et al., 2009; Pulst et al., 2016). For PEO, it seems with tiny fraction of salt molecules dissolved in, it becomes electrically active in promoting conductance (Berthier et al., 1983; Christie, Lilley, Staunton, Andreev, & Bruce, 2005; Pratap & Chandra, 2013). Most of the times, electrode polarization (or double-layer capacitance effect) in polymer electrolyte may provide some insight on the conduction mechanism of the systems.
EIS has been adopted to elucidate the dielectric and electrical relaxations in SPE and non-SPE. EIS data may be presented as Nyquist plot (refer to the Part 1 of this article) or Bode plot (Bode, 1945). For Nyquist plot, frequency is hidden whereas for Bode plot, frequency is explicit. These two plots are essentially of the interest in elucidation of electrical and dielectric properties of the electrolytes and their interfaces with the electrodes (Chin Han Chan & Kammer, 2015, 2018, 2020). The Nyquist plot illuminates on the electrical bulk properties of the electrolytes, i.e. bulk resistance (Rb). The Bode plot, illuminates more on the time response or dielectric relaxation time of the electrolytes. The basic concept, mechanism and characteristic of dielectric materials, dielectric relaxation and polarization aided with schematic illustrations were shown and explained in a simpler manner in the Part 1 of this article (Abdul Halim, Chan, & Apotheker, 2020). For polymer electrolytes, there are several distinctive resonances that can be scrutinized under an action of externally imposed frequency (the oscillating electric field). These resonances frequently imply to dipoles relaxation at particular frequency, which allows the decoupling of small-scale electrode polarization at the electrode–electrolyte interface and conductance within the electrolyte (i.e. the dielectric relaxation, electric relaxation, and electrode polarization). Hence, we note here, the frequency-dependent impedance and modulus spectra are the key quantities of interest to decouple the short-range (local motion) and long-range (non-local motion) dielectric properties of electrolytes and their interfaces with the electrodes. There are few other methods that can be utilized to understand the dynamics of dipolar entities and polymer chain segmental motions such as solid-state nuclear magnetic resonance (NMR), neutron scattering, and small-angle X-ray scattering (SAXS) etc. (Chen et al., 2019, 2021; Wang, Xia, Chen, & Yoa, 2020). We address this situation by not focusing on ions, dipoles, super molecular structures etc. Instead, we made impedance measurements, where an electric field was applied to the dielectric materials. We elucidate the dielectric behavior as fluctuation and dissipation behavior in thermodynamics sense.
The understanding on conduction mechanism of polymer electrolytes from a molecular point of view has yet to be well understood and requires further exploration. It is mainly due to the nature of charge entities is not well understood. We may have molecular interaction of polymer chains with salt molecules leading to the presence of dipolar entities (Chin Han Chan & Kammer, 2018; Kammer, 2017). It is rather challenging to describe this complex situation from a molecular point of view even for binary polymer-salt systems. Therefore, we present a phenomenological point of view resulting from development of polarization, alignment, and relaxation of the charged entities (dipoles or dipolar entities). The following discussion has been kept in terms of electrochemical and electrical in order to familiarize beginners and young researchers, alongside to serve as an alternative reference for course instructors to coach their students on the subject matter.
Basics – electrochemical terms
In principle, the conductance mechanism of polymer electrolytes originates from reorientation of charged entities (dipoles or dipolar entities) when placed under an action of oscillating electric field. For impedance spectroscopy, the polymer electrolyte forms a parallel plate capacitor with the two blocking electrodes with area (A) and thickness (ϑ). Hence, the complex capacitance (C*) can be seen as
with
with
where, X′ and X″ denote real and imaginary parts of quantity X, ω and f denote as angular frequency and frequency, respectively, with ω = 2πf. All quantities of Equation (2) are closely interrelated to each other as well as to complex conductivity, where
From the above formulations, we see that Z* and ε*are the central quantities of EIS measurement, which is presented in Equation (1). Equation (1) tells that capacitance Cʹ ∝ ε′ and C″ ∝ ε″, where εʹ and ε″ are denote as the stored and the dissipated energy for conductance, respectively. As a whole, the quantities can be interpreted as follows:
Zʹ can be seen as Ohmic resistance
Z″ can be seen as non-Ohmic resistance. This quantity can be seen as the capacity resistance resulting from the polymer electrolyte acts as capacitor in EIS. It displays several characteristic frequencies e.g. “dielectric” relaxation as the consequence of local motion (short-range mobility) of the charged entities
εʹ is known as the dielectric constant at εʹ(f → ∞) with f note as frequency. This quantity indicates the ability of the polymer to store energy reversibly under the action of oscillating electric field
ε″ denotes as the dielectric loss (or dissipation of energy). The finite displacement of charged entities (or dielectric polarization) of a polymer electrolyte may differ under the induced oscillating electric field as an effect of the energy dissipation, that occurs due to flowing of charged entities, ionic conduction, or conversion into thermal energy (via molecular vibration)
M″ is seen as directly proportionate to Z′. Hence, M″ illuminates the “electric” relaxation of the flowing charged entities resulting from non-local motion (long-range mobility). The resonance appears when the externally induced sinusoidal AC frequency matches with the dielectric relaxation frequency
σʹ is coined by flow of charges (dissipation of charges)
σ″ reflects storage of charges
The EIS is recognized as a powerful tool for evaluation of electric and dielectric properties of the measured quantity and their interfaces with conducting electrodes. For polymer electrolytes, the electric and dielectric properties are evaluated from the consequence of alignment of the charged entities (dipoles) after externally imposed to alternating frequency. Therefore, the emphasis of the following discussion is on the response of the charged entities in the solid polymer electrolytes (i.e. SPE: PEO-LiClO4 and non-SPE: PMA-LiClO4) under the effect of oscillating electric field in classical sense (i.e. to decouple the short-range and long-range dielectric relaxation resulting from local or non-local motion of the charged entities).
Experimental
The preparation of SPE and non-SPE used for this publication were published elsewhere (i.e. dissolution of LiClO4 in PEO and PMA, respectively) (Halim et al., 2017). The experimental procedures using electrochemical impedance spectroscopy can be found in the Part 1 of this article. Data were extracted from Part 1 of this article. Hence, we exclude the experimental details in the Part 2 of this article. Here, we list only the polymer hosts, frequency range and temperature for EIS measurement (c.f.Table 1). In the following section, we discuss the impedance data of the systems given in Table 1.
Characteristics of polymer electrolytes.
| Polymer | Molar mass (g mol−1) | WSa | Frequency range (Hz) | Tb (°C) | Tgc (°C) | Tmd (°C) |
|---|---|---|---|---|---|---|
| PEO | 300,000 | 0.5 wt.% and 11 wt.% | 50–2 MHz | 25 | −56 | 65 |
| PMA | 40,000 | 2 wt.% and 11 wt.% | 50–2 MHz | 25 | 13 | – |
aSalt content estimated from percentage of mass of salt/(mass of polymer + salt); salt: LiClO4. bTemperature for EIS measurement. cGlass transition temperature estimated using differential scanning calorimetry (Abdul Halim et al., 2019). dMelting temperature estimated using differential scanning calorimetry (Halim et al., 2017).
Results and discussion
We note here the binary polymer-salt systems (i.e. PEO-LiClO4 and PMA-LiClO4) with 0.5 wt.% of LiClO4 as low salt system and 11 wt.% of LiClO4 as high salt system. These notations are applied throughout the discussion.
Impedance
The frequency-dependent impedance spectra of polymer electrolytes monitored by EIS i.e. Bode plots of PEO-LiClO4 (SPE) and PMA-LiClO4 (non-SPE), are displayed in Figure 1. Normally, in a Bode plot, one may observe several characteristic frequencies at a particular frequency resulting from electrode polarization or dielectric relaxation of charged entities (we named here dipolar entities).

Frequency-dependent impedance spectra of (a) PEO-LiClO4, (b) zoom-in of PEO-LiClO4, and schematic illustration of dipolar entities orientation of the respective systems, where (c) close to Debye response and (d) deviation from Debye response under the experimental condition.
We note the double-logarithmic plot of impedance spectra presented in Figure 1(a) as:
Both PEO-LiClO4 systems (i.e. in addition of 0.5 wt.% and 11 wt.% of LiClO4) have an average maximum resonance in Z″ spectrum at certain frequency region noted as
The systems possess one intersection point of Z′ and Z″ spectrum at a frequency region noted as
Both systems have an average minimum resonance in Z″ spectrum at a lower frequency region noted as
The systems are noted with large distribution of relaxation times with increasing salt content
System with high salt content shows that the distance of
Note: under Debye relaxation (i.e.
We note that the double-logarithmic plot of impedance spectra of PMA-LiClO4 presented in Figure 2(a):
The system has no maximum resonance in Z″ spectrum at low salt content and one broad maximum resonance is observed in Z″ spectrum of system with high salt content at frequency noted as
Both systems have one intersection point at Z′ and Z″ spectrum at a frequency noted as
Unlike PEO, no
The interesting finding in PMA-Li salt system is the existence of distribution of relaxation times after addition of high composition of salt by
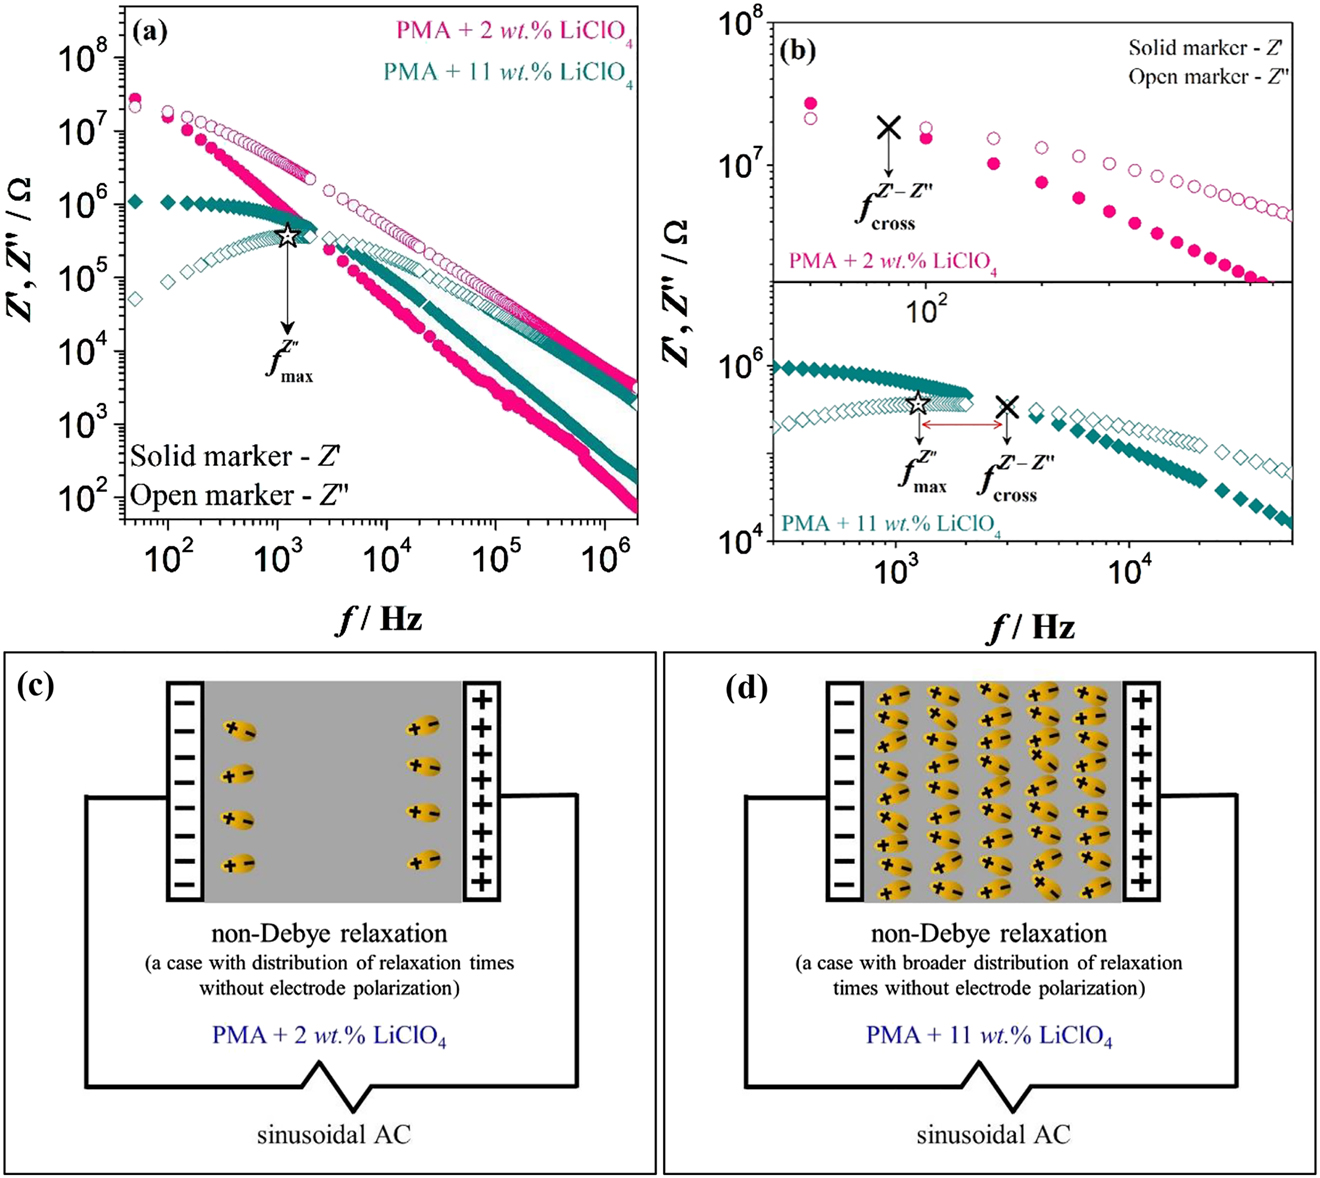
Frequency-dependent impedance spectra of (a) PMA-LiClO4 and (b) zoom-in PMA-LiClO4, and schematic illustration of dipolar entities orientation of the respective systems, where (c) deviation from Debye response and (d) large deviation from Debye response under the experimental condition.
A step-by-step guideline to estimate characteristic frequencies of impedance using mathematical regression approach aided with commercial graphical software is presented in the Supplementary file 1 (S1). Guideline in S1 is not limited only for impedance but it may be adopted for other electrochemical terms (e.g. loss tangent, electric modulus etc.) that displays a characteristic frequency as in impedance. This guide is one of the alternative approaches that may be useful for estimation of reproducible results.
Permittivity
The frequency-dependent permittivity spectra of polymer electrolytes i.e. PEO-LiClO4 and PMA-LiClO4, studied using EIS are displayed in Figure 3. Permittivity frequently reflects to the ability of a material to store and transfer the charged entities under an applied electric field. ε′ reflects to the stored energy (stored dipoles) and ε″ reflects to the dissipated energy (mobile dipoles), for ionic conduction. The relation of permittivity and ionic conductivity of electrolyte can be reflected in Equation (4), where
where the σDC is directly proportional to ε″ at constant ω, with ω = 2πf. Estimation of σDC was elaborated in Part 1 of this article. Equation (4) tells the ionic conductivity can be estimated easily with permittivity as they are proportionate to each other. Apart from that, Equation (4) also expresses the existence of a power-law dependence in ε″ spectrum at constant σDC (i.e. at low frequency,
with the exponential of n should be less than or equal to unity (n ≤ 1). The exponential n represents the slope of a linear regression. It is noted when exponent n = 1, it implies to only one relaxation time constant following Debye response. Consequently, when n < 1, it indicates a distribution of relaxation times in the system that shows deviation from Debye response. The focus of this section is to reveal the significance of power-law dependence in the imaginary part of ε″ in the range of frequency

Frequency-dependent permittivity spectra of (a) PEO-LiClO4 and (b) PMA-LiClO4.
The double-logarithmic plot of permittivity spectra presented in Figure 3 as:
all systems have a linear decrease in ε″ in the range of frequency from
the linear regressions in ε″ in the range of frequency
n = 0.95 for PEO with 0.5 wt.% of LiClO4
n = 0.92 for PEO with 11 wt.% of LiClO4
n = 0.90 for PMA with 11 wt.% of LiClO4
The exponential n values of PEO- and PMA-salt reduce with increasing salt content. This points to the increase in the distribution of relaxation times with higher addition of salt. However, we observe a close to Debye relaxation (with n ≈ 1) for PEO added with low salt content.
The ε″ increase from ∼ 100 (for PEO with 0.5 wt.% of LiClO4) to ∼ 3 × 10⁴ (for PEO 11 wt.% of LiClO4) at f = 50 Hz with increasing salt content. Similar observation is noted for PMA-LiClO4 system.
Hence, the ionic conductivities of both polymer electrolytes are seen to be increased with elevating salt content as ε″ permittivity is directly proportional to ionic conductivity at a constant ω, which ω = 2πf [c.f.Equation (4)].
Loss tangent
Loss tangent (tan δ) can be defined as the ratio of mobile and stored charged entities (dipoles) (ratio of ε″/εʹ) of the system. In this spectrum, frequency noted as
We note the plot of loss tangent spectra presented in Figure 4 as:
Figure 4(a) elucidates that
However, these are not seen in PMA-salt. There is no visible maximal resonance in tan δ of PMA-salt as the characteristic frequency may be lying at lower frequency region, apart from the sign of non-existence of electrode polarization at the electrode-electrolyte interface. Only monotonic decrease is observed over the frequency sweep and no dipolar relaxation illuminates. This is consistent with Z″ of PMA-salt where no
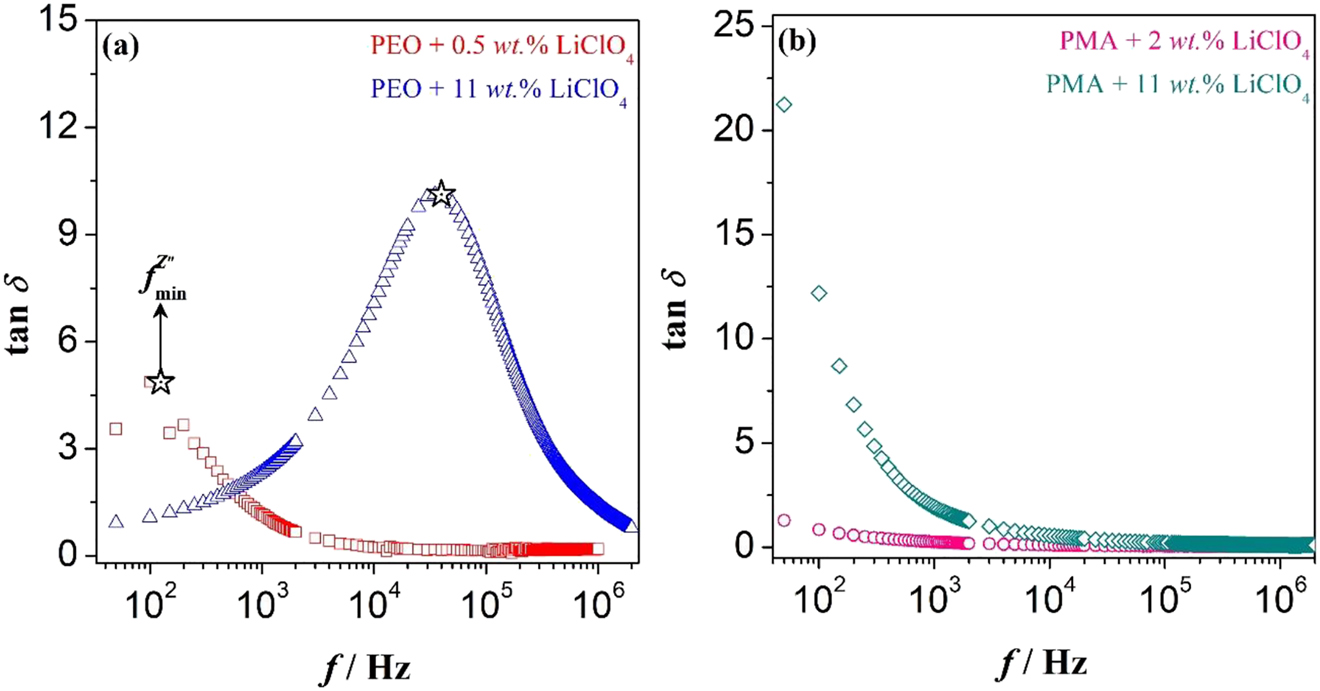
Frequency-dependent loss tangent spectra of (a) PEO-LiClO4 and (b) PMA-LiClO4.
Electric modulus
In general, the interrelation of modulus and impedance can be elucidated as in Equation (1). Hence, dynamically we see electric modulus after Equation (1) as dynamic quantity, where M″ is directly proportional to Ż′ where Ż′ is the time derivative of Z′. Hence, after several manipulations of Equation (1), we see the symmetric formulations that are the central points of the discussion:
Here, the comparison of modulus and impedance are made in the low-frequency range (
We note here, the plot of electric modulus spectra presented in Figure 5 as:
PEO-salt exhibits relaxation resonance in the spectra of Z″ and M″ as demonstrated in Figures 1(a) and 5(a), respectively. We observe in PEO, the M″ exhibits a maximum at frequency
These characteristic frequencies also provide more information on the transport properties of the charged entities in the system. We note here the charge transport for PEO is mainly governed by short-range irregular (localized) motion as the dielectric relaxation is more dominant [c.f.Figure 5(a)]. In other words, the conductance activity PEO-salt is dominated by short-range or local motions of dipoles and long-range motions only have minor influence on the system.
Unlike PEO-salt, PMA-salt system only shows the conducting behavior after addition of sufficiently high salt content. The system possesses a large deviation from Debye response, as the large difference in the characteristic frequencies
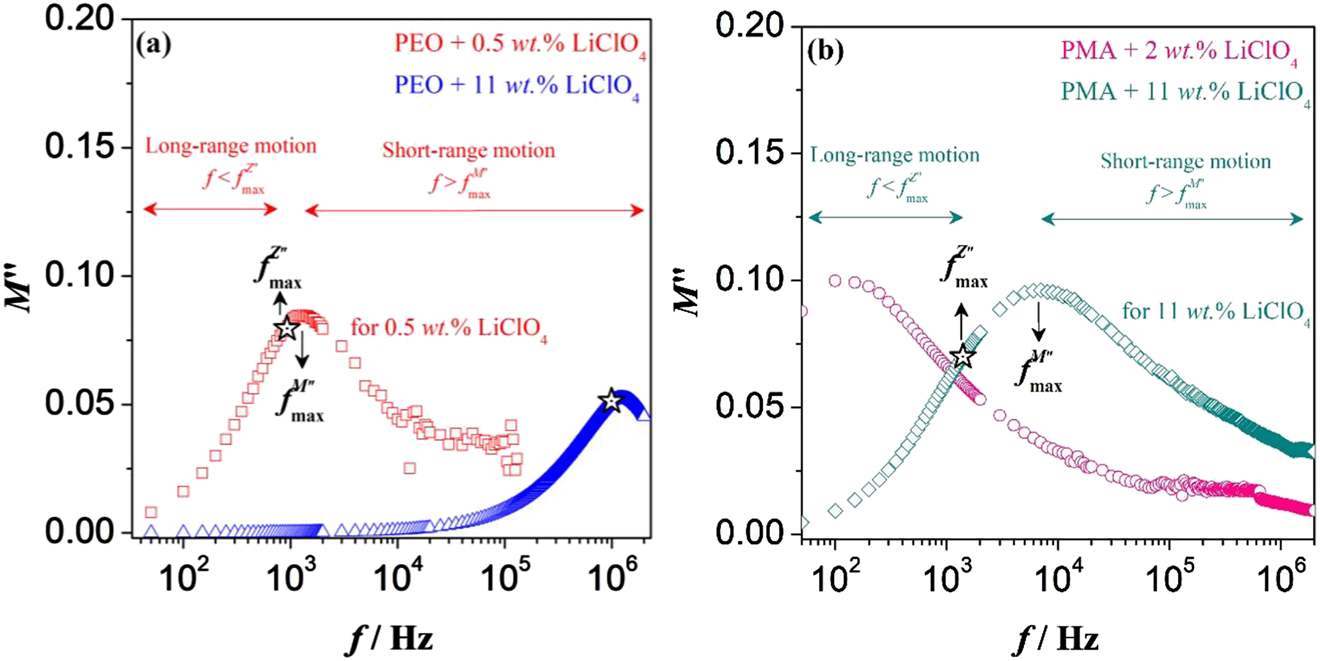
Imaginary modulus versus frequency spectra of (a) PEO-LiClO4 and (b) PMA-LiClO4.
Conductivity
We observe the complex conductivity σ* is highly related to dynamic complex permittivity in the linear range of
Equation (8) shows the direct relationship of real and imaginary parts of conductivity to imaginary and real parts of permittivity, respectively

Frequency-dependent conductivity spectra of (a) PEO-LiClO4 and (b) PMA-LiClO4. The dotted line marks as DC conductivity (σDC) in the range of
σʹ represents dissipation of energy due to flow of charges/dipoles, and this is closely interlinked to conduction, whereas σ″ reflects to the amount of stored energy in the system coming from the electric field. In most cases, the long-range transport of charged entities only contributes minor influence on the conductivity. We would say the conductivity is preferably ruled by dielectric response of the system in range of
Conductivity of PMA-salt system exhibits very low conductivity σʹ in the low frequency range as compared to PEO-salt system (at the same content). Conductivity of PMA at high salt content mostly acts comparatively same as PEO at low salt content. PMA only acts as insulator with tiny fraction of salt. It becomes slight electrically active only after addition of high content of salt unlike PEO [c.f.Figure 6(a)]. As conclusion, the conductivities of binary polymer-salt system under discussion are seen to be dependent of polymer as well as salt content as seen from the overall phenomenon response of electrochemical aspects.
Conclusion
Two different classes of systems, i.e. high molar mass semi-crystalline PEO and low molar mass amorphous PMA with addition of LiClO4, were employed for discussion on the phenomenological response of imaginary part of impedance spectrum (Z″), imaginary part of permittivity (ε″), tan δ (imaginary/real of permittivity), the imaginary part of electric modulus (M″), and the real part of conductivity (σ′). We observe there are interactions between the salt molecules and PEO chains leading to dipolar entities, but they relaxed in random manner. Therefore, under the effect of external electric field, we see PEO-salt system as a polymer electrolyte because even with a tiny fraction of salt molecules dissolved in, the system becomes electrically conductive. PMA-salt system only become slightly conductive after addition of high salt content; however, it still cannot display electrode polarization or electric relaxation because the dipoles are immobilized (restricted to local motion only). Hence, in the classic sense, PMA-salt does not form a good polymer electrolyte. The primary intention of this article is to highlight on how to discuss this difficult matter in simpler manner in order to assist beginners and young researchers to be familiar on the other aspects of electrochemical impedance spectroscopy, beside serving as an alternative reference for course instructors to coach their students on the subject matter.
Supplementary Information
Two supplementary files (i.e S1 – A step-by-step guideline to estimate characteristic frequencies in impedance using mathematical regression with commercial graphical software, S2 – PowerPoint slide: Basics of Teaching Electrochemical Impedance Spectroscopy of Electrolytes for Ion-rechargeable Batteries) are provided separately for educational, practical, and self-learning purposes.
This is one of the instructor’s notes based on the short course presented at the 25th POLYCHAR 2017 World Forum on Advanced Materials, Kuala Lumpur, Malaysia, October 9–13, 2017. The power point slides can be accessed viahttps://iupac.org/wp-content/uploads/2017/12/IUPAC_PolymEdu_Shortcourse_1ppt_ChinHanChan.pdf and the QR code:
Acknowledgments
The authors would like to express appreciation to Mdm. Amirah Hashifudin for providing impedance result of PEO with 0.5 wt.% of LiClO4.
Author contributions: All the authors have accepted responsibility for the entire content of this submitted manuscript and approved submission.
Research funding: The authors would like to express the greatest appreciation to Universiti Teknologi MARA (UiTM), Malaysia for granting LESTARI Grant [600-IRMI/MyRA/5/3/ LESTARI (1072/2017)] and Ministry of Education, Malaysia for providing MyBrain15 (MyPhD) to financially support some experimental work of this article.
Conflict of interest statement: The authors declare no conflicts of interest regarding this article.
References
Abdul Halim, S. I., Chan, C. H., & Apotheker, J. (2020). Basics of teaching electrochemical impedance spectroscopy of electrolytes for ion-rechargeable batteries – part 1: a good practice on estimation of bulk resistance of solid polymer electrolytes. Chemistry Teacher International. https://doi.org/10.1515/cti-2020-0011.Search in Google Scholar
Abdul Halim, S. I., Chan, C. H., & Kammer, H.-W. (2019). About glass transition in polymer-salt mixtures. Polymer Testing, 79, 105994. https://doi.org/10.1016/j.polymertesting.2019.105994.Search in Google Scholar
Abraham, K. M., & Jiang, Z. (1996). A polymer electrolyte-based rechargeable lithium/oxygen battery. Journal of the Electrochemical Society, 143(1), 1–5. https://doi.org/10.1149/1.1836378.Search in Google Scholar
Agrawal, R. C., & Pandey, G. P. (2008). Solid polymer electrolytes: Materials designing and all-solid-state battery applications: An overview. Journal of Physics D: Applied Physics, 41(22), 223001. https://doi.org/10.1088/0022-3727/41/22/223001.Search in Google Scholar
Alloin, F., D’Aprea, A., El Kissi, N., Dufresne, A., & Bossard, F. (2010). Nanocomposite polymer electrolyte based on whisker or microfibrils polyoxyethylene nanocomposites. Electrochimica Acta, 55(18), 5186–5194. https://doi.org/10.1016/j.electacta.2010.04.034.Search in Google Scholar
Armand, B. (1986). Polymer electrolytes. Annual Review of Materials Science, 16, 245–261. https://doi.org/10.1146/annurev.ms.16.080186.001333.Search in Google Scholar
Berthier, C., Gorecki, W., Minier, M., Armand, M. B., Chabagno, J. M., & Rigaud, P. (1983). Microscopic investigation of ionic conductivity in alkali metal salts-poly(ethylene oxide) adducts. Solid State Ionics, 11(1), 91–95. https://doi.org/10.1016/0167-2738(83)90068-1.Search in Google Scholar
Billah, S. M. R. (2019). Dielectric polymers. Functional polymers, polymers and polymeric Composites: A reference series (pp. 241–288). https://doi.org/10.1007/978-3-319-95987-0_8.Search in Google Scholar
Bode, H. W. (1945). Network analysis and feedback amplifier design. Bell Telephone Laboratories series.Search in Google Scholar
Chan, C. H., & Kammer, H.-W. (2008). Properties of solid solutions of poly(ethylene oxide)/epoxidized natural rubber blends and LiClO4. Journal of Applied Polymer Science, 110, 424–432. https://doi.org/10.1002/app.28555.Search in Google Scholar
Chan, C. H., & Kammer, H. W. (2015). Polymer electrolytes—relaxation and transport properties. Ionics, 21(4), 927–934. https://doi.org/10.1007/s11581-014-1256-3.Search in Google Scholar
Chan, C. H., & Kammer, H. W. (2016). On dielectrics of polymer electrolytes studied by impedance spectroscopy. Ionics, 22(9), 1–9. https://doi.org/10.1007/s11581-016-1700-7.Search in Google Scholar
Chan, C. H., & Kammer, H. W. (2018). Characterization of polymer electrolytes by dielectric response using electrochemical impedance spectroscopy. Pure and Applied Chemistry, 90(6), 939–953. https://doi.org/10.1007/s11581-016-1700-710.1515/pac-2017-0911.Search in Google Scholar
Chan, C. H., & Kammer, H. W. (2020). Low frequency dielectric relaxation and conductance of solid polymer electrolytes with PEO and blends of PEO and PMMA. Polymers, 12, 1–19. https://doi.org/10.1007/s11581-016-1700-710.3390/polym12051009.Search in Google Scholar
Chan, C. H., Kammer, H. W., Sim, L. H., Yusoff, S. N. H. M., Hashifudin, A., & Winie, T. (2014). Conductivity and dielectric relaxation of Li salt in poly(ethylene oxide) and epoxidized natural rubber polymer electrolytes. Ionics, 20(2), 189–199. https://doi.org/10.1007/s11581-013-0961-7.Search in Google Scholar
Chan, C. H., Sulaiman, S. F., Kammer, H. W., Sim, L. H., & Harun, M. K. (2011). Thermal properties of epoxidized natural rubber-based polymer blends. Journal of Applied Polymer Science, 120(3), 1774–1781. https://doi.org/10.1002/app.33384.Search in Google Scholar
Chen, X. C., Sacci, R. L., Osti, N. C., Tyagi, M., Wang, Y., Keum, J. K. & Dudney, N. J. (2019). Study of the segmental dynamics and ion transport in polymer-ceramic composite electrolytes by quasi-elastic neutron scattering. Molecular Systems Design and Engineering, 1–7.10.1039/C8ME00113HSearch in Google Scholar
Chen, X. C., Sacci, R. L., Osti, N. C., Tyagi, M., Wang, Y., Keum, J. K. & Dudney, N. J. (2021). Study of the segmental dynamics and ion transport of solid polymer electrolytes in the semi-crystalline state. Frontiers in Chemistry, 8, 592604(1)–592604(8). https://doi.org/10.3389/fchem.2020.592604.Search in Google Scholar
Christie, A. M., Lilley, S. J., Staunton, E., Andreev, Y. G., & Bruce, P. G. (2005). Increasing the conductivity of crystalline polymer electrolytes. Nature, 433(7021), 50–53. https://doi.org/10.1038/nature03186.Search in Google Scholar
Das, A., Thakur, A. K., & Kumar, K. (2013). Exploring low temperature Li+ ion conducting plastic battery electrolyte. Ionics, 19(12), 1811–1823. https://doi.org/10.1007/s11581-013-0898-x.Search in Google Scholar
Halim, S. I. A., Chan, C. H., & Winie, T. (2017). Thermal, conductivity and molecular interaction studies of poly(ethylene oxide)/poly(methyl acrylate) solid polymer electrolytes. Macromolecular Symposia, 371(1), 114–124. https://doi.org/10.1002/masy.201600050.Search in Google Scholar
Harun, F., Chan, C. H., & Winie, T. (2017). Influence of molar mass on the thermal properties, conductivity and intermolecular interaction of poly(ethylene oxide) solid polymer electrolytes. Polymer International, 66(6), 830–838. https://doi.org/10.1002/pi.5322.Search in Google Scholar
Hassoun, J., & Scrosati, B. (2010). A high-performance polymer Tin Sulfur Lithium ion battery. Angewandte Chemie International Edition, 49(13), 2371–2374. https://doi.org/10.1002/anie.200907324.Search in Google Scholar
Kammer, H. (2017). Dielectric relaxation in PEO-based polymer electrolytes. Ionics, 24, 1415–1428. https://doi.org/10.1007/s11581-017-2290-8.Search in Google Scholar
Karim, S. R. A., Sim, L. H., Chan, C. H., & Ramli, H. (2015). On thermal and spectroscopic studies of poly(ethylene oxide)/poly(methyl methacrylate) blends with lithium perchlorate. Macromolecular Symposia, 354(1), 374–383. https://doi.org/10.1002/masy.201400134.Search in Google Scholar
Li, Q., Chen, J., Fan, L., Kong, X., & Lu, Y. (2016). Progress in electrolytes for rechargeable Li-based batteries and beyond. Green Energy & Environment, 1(1), 18–42. https://doi.org/10.1016/j.gee.2016.04.006.Search in Google Scholar
Martwiset, S., Yavuzcetin, O., Thorn, M., Versek, C., Tuominen, M., & Coughlin, E. B. (2009). Proton conducting polymers containing 1H-1,2,3-triazole moieties. Journal of Polymer Science, Part A: Polymer Chemistry, 47(1), 188–196. https://doi.org/10.1002/pola.23141.Search in Google Scholar
Mead, D. J., & Fuoss, R. M. (1942). Electrical properties of solids. XIII. polymethyl acrylate, polymethyl methacrylate, polymethyl-α-chloracrylate and polychloroethyl methacrylate. Journal of the American Chemical Society, 64(10), 2389–2393. https://doi.org/10.1021/ja01262a048.Search in Google Scholar
Pratap, R., & Chandra, S. (2013). Ion transport studies in PEO:NH4ClO4 polymer electrolyte and its composite with Al2O3. Polymer Bulletin, 70(11), 3075–3089. https://doi.org/10.1007/s00289-013-1008-y.Search in Google Scholar
Pulst, M., Balko, J., Golitsyn, Y., Reichert, D., Busse, K., & Kressler, J. (2016). Proton conductivity and phase transitions in 1,2,3-triazole. Physical Chemistry Chemical Physics, 18(8), 6153–6163. https://doi.org/10.1039/c5cp07603j.Search in Google Scholar
Scrosati, B., Croce, F., & Panero, S. (2001). Progress in lithium polymer battery R&D. Journal of Power Sources, 100(1–2), 93–100. https://doi.org/10.1016/s0378-7753(01)00886-2.Search in Google Scholar
Wang, Y., Fan, F., Agapov, A. L., Saito, T., Yang, J., Yu, X., … , Sokolov, A. P. (2014). Examination of the funadamental relation between ionic transport and segmental relaxation in polymer electrolytes. Polymer, 55, 4067-4076. https://doi.org/10.1016/j.polymer.2014.06.085.Search in Google Scholar
Wang, B. H., Xia, T., Chen, Q., & Yoa, Y. F. (2020). Probing the dynamics of Li+ ions on the crystal surface: A solid-state NMR study. Polymers, 12, 391(1)–391(12). https://doi.org/10.3390/polym12020391.Search in Google Scholar
Supplementary Material
The online version of this article offers supplementary material (https://doi.org/10.1515/cti-2020-0018).
© 2021 Suhaila Idayu Abdul Halim et al., published by De Gruyter, Berlin/Boston
This work is licensed under the Creative Commons Attribution 4.0 International License.
Articles in the same Issue
- Frontmatter
- Preface
- Special issue of Chemistry Teacher International in Polymer Sciences
- Review Articles
- Fundamentals of reversible addition–fragmentation chain transfer (RAFT)
- Reversible-Deactivation Radical Polymerisation: chain polymerisation made simple
- Ring-opening polymerization
- Other
- Thermal analysis: basic concept of differential scanning calorimetry and thermogravimetry for beginners
- Review Article
- Size-exclusion chromatography as a useful tool for the assessment of polymer quality and determination of macromolecular properties
- Other
- Basics of teaching electrochemical impedance spectroscopy of electrolytes for ion-rechargeable batteries – part 1: a good practice on estimation of bulk resistance of solid polymer electrolytes
- Special Issue Paper
- Basics of teaching electrochemical impedance spectroscopy of electrolytes for ion-rechargeable batteries – part 2: dielectric response of (non-) polymer electrolytes
- Good Practice Report
- Chirality analysis of helical polymers
- Other
- Fabrication and function of polymer membranes
- Review Article
- Nano- and microgels: a review for educators
- Other
- Theoretical background on semiconducting polymers and their applications to OSCs and OLEDs
- Good Practice Report
- An understandable approach to the temperature dependence of electric properties of polymer-filler composites using elementary quantum mechanics
- Review Article
- Polymer degradation: a short review