
Basics of teaching electrochemical impedance spectroscopy of electrolytes for ion-rechargeable batteries – part 1: a good practice on estimation of bulk resistance of solid polymer electrolytes
-
Suhaila Idayu Abdul Halim

 and
Jan Apotheker
and
Jan Apotheker

Abstract
In this publication, we present the basic to characterize the electrical properties of electrolytes that are widely used in ion-rechargeable batteries using electrochemical impedance spectroscopy (EIS). This simplified yet insightful background provided may be used for educational purposes, especially for beginners or young researchers for both undergraduate and postgraduate students. We start with introduction of electrolytes and electrochemical impedance spectroscopy (EIS) instrumentation, following with the step-by-step guidelines using three different procedures to estimate the bulk resistance (Rb) of the electrolytes, which is inversely proportional to the conductivity (σDC) of the materials
Introduction
Electrolytes and batteries
Electrolyte is an electrically conducting solution when a substance (e.g., ionic compound, dipolar entity etc.) dissolve in a polar matrix (e.g., polar solvent). An electrolyte is known as a medium that is capable for transporting electrical charges under the action of electric field, which owing from the movement of charged molecules. An electrolyte commonly serves as a medium of a (rechargeable) battery, which allows the flow of charge entities from one electrode to another electrode. A battery cell (refer Figure 1) is an electrochemical cell that is comprised of an electrolyte sandwiched in between two electrodes, named as anode and cathode. When a (rechargeable) battery is in the discharge state (Galvanic cell) connected to an external electric circuit, the electrons will spontaneously flow from the more negative electrode potential to the more positive electrode potential through the external circuit as a result of the spontaneous redox reaction at the respective electrodes. This implies oxidation occurs at negative electrode (anode), the reduction occurs at the positive electrode (cathode), and charged entities transport between the electrodes by passing through electrolyte for generation of electric current (Plante, 1884; Voss, 1990). However, the redox reaction can be reversed by means of applying an external electric potential (voltage) to produce complementary redox reaction at the electrodes. This configuration is a non-spontaneous and energy-dependent process, which can be observed in the rechargeable battery (secondary) that is in the charged state (electrolytic cell) (Learn Engineering, 2019; Ramström, 2019).
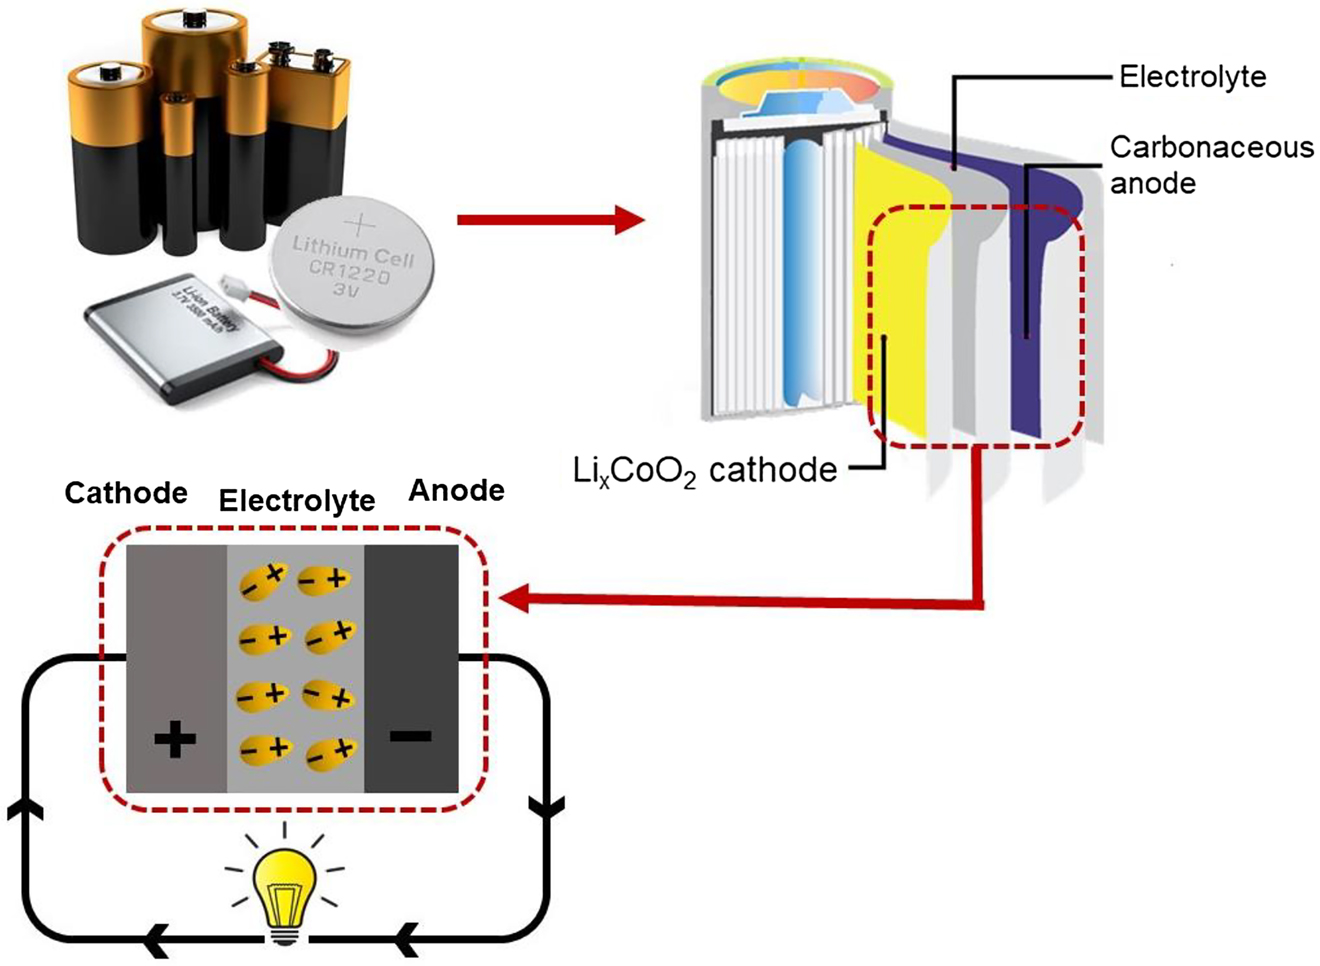
Illustration of basic configuration of a lithium ion (rechargeable) battery (Li-ion battery) in the discharged form. Electrons flow through the circuit as a result of the spontaneous redox reactions at the respective electrodes.
Electrolytes can be classified in the form of liquid, gel and solid. Liquid electrolyte is known for its excellent characteristic as a good electric conductor. For a long time, liquid electrolytes have been widely used in the Li-ion (rechargeable) battery owing to their superior electrical properties (Baril, Michot, & Armand, 1997; Klinklai et al., 2006). A liquid electrolyte has the configuration of a strong electrolyte, as the ionic compounds dissociate into cations and anions. However, apart from being a highly conductive compounds, liquid electrolyte possesses major drawbacks that greatly limits its further development and wider application, i.e., high in toxicity, explosive, flammable, unstable electrochemical performance and environmentally harmful. Highly flammable electrolyte might be responsible for the recent catastrophic battery explosions (Kong, Li, Jiang, & Pecht, 2018; Mackanic et al., 2019; Manthiram, Yu, & Wang, 2017). Gel electrolytes are formulated with the combined features of both solid and liquid electrolytes have gained attentions for the past decades for replacement of liquid electrolytes (Baskoro, Wong, & Yen, 2019; Ngai, Ramesh, Ramesh, & Juan, 2016; Stephan, 2006). However, the safety concerns still arise (e.g., volatility, flammability etc.) although the operational stability of gel electrolytes is pretty decent (Kong et al., 2018). Therefore, many researchers have conducted extensive studies since 70s to overcome the limitation of liquid and gel electrolytes for modern Li-ion battery applications by designing and inventing solid electrolytes with high ionic conductivity and more distinctive features as compared to the other two electrolytes. Solid electrolytes have been seen as potential materials with high energy density, high power, high durability, high flexibility and non-flammable for energy storage applications.
Solid polymer electrolyte (SPE) is formed by dissolution of low-molar-mass electrolyte (e.g., lithium salt, sodium salt etc.) in polymer matrix, usually the polar polymers [e.g., poly(ethylene oxide) (PEO) (Chan & Kammer, 2015; Pratap & Chandra, 2013), poly(propylene oxide) (PPO) (Su, Wang, & Liu, 2002; Zhang & Chen, 2004), poly(methyl methacrylate) (PMMA) (Raja, Sharma, & Rao, 2004; Ramesh & Bing, 2012), epoxidized natural rubber (ENR) (Hussin, Harun, & Chan, 2017; Mohd Yusoff, Sim, Chan, Hashifudin, & Kammer, 2013) etc.] are noted. Special attention has placed on SPE for Li-ion rechargeable batteries due to the theoretical specific energy density at 4.2 V can be achieved up to 380–460 Wh kg−1 especially when the SPE is combined with the existing large-capacity cathode and anode (Li, Chen, Fan, Kong, & Lu, 2016), apart from being flexible, light in weight, and non-toxic etc. in some cases. Up to date, SPE is considered as a highly potential material for the next generation high-energy rechargeable batteries. Credits to the ever-increasing demand on flexible energy storage and power applications, we will able to see the invention of flexible and powerful SPE as a medium of rechargeable battery in the near future and the revolution is expected to emerge rapidly for the next 20–30 years (Li et al., 2016; Liu et al., 2019; Mackanic et al., 2019; Manthiram et al., 2017; Ramström, 2019). Figure 2 displays the several examples of advanced prototypes for flexible or soft electronics embedded with energy storage devices (Larson et al., 2016; Miyamoto et al., 2017) for potential commercial applications.
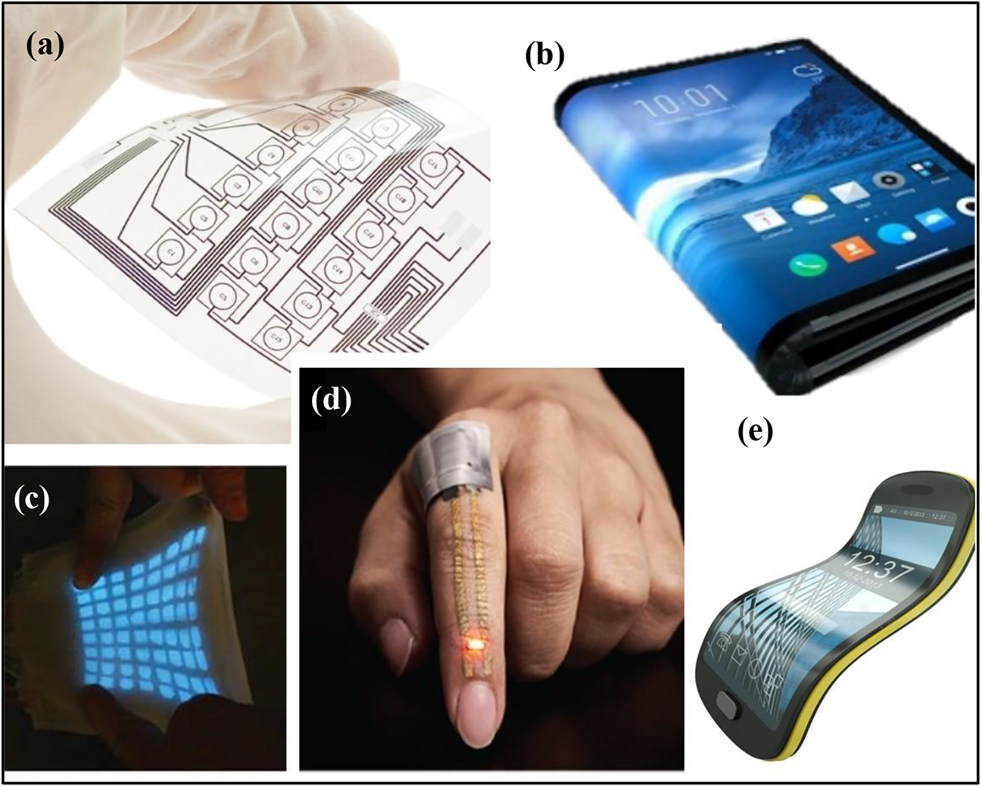
Prototypes of flexible or soft electronics.
(a) Hybrid-integrated flexible electronic system, (b and e) future perspective of mobile electronic devices, (c) stretchable display for optical and tactile sensing, reproduced with permission from (Larson et al., 2016), copyright 2016, American Association for the Advancement of Science, and (d) on-skin electronic sensor for health monitoring, reproduced with permission from (Miyamoto et al., 2017), copyright 2017, Springer Nature.
One of the standard requirements of SPEs for the rechargeable battery is the ionic conductivity (σDC) should be at least ∼10−3 S cm−1 at room temperature (Li et al., 2016; Liu et al., 2019; Lopez, Mackanic, Cui, & Bao, 2019; Mackanic et al., 2019). The estimation of σDC is calculated from the bulk resistance (Rb) using EIS in this study, where σDC = L/(A·Rb). Quantities L and A denote the thickness of the sample and surface area of the sample film, which contact with the electrodes, respectively. Since quantity σDC is crucial for commercial applications of the SPEs, hence in this presentation, a good practice on the estimation of Rb will be highlighted. Three Supplementary Files (i.e., S1 – A step-by-step guideline to estimate bulk resistance (Rb) using mathematical regression with commercial graphical software, S2 – A step-by-step guideline to estimate Rb using manual graphical approach and S3 – A step-by-step guideline to estimate Rb using exclusive EIS software) are provided separately for educational purposes. Consistency in data extraction is crucial in order to obtain a precise and reproducible data.
Secondly, two systems are used (SPE; binary poly(ethylene oxide) (PEO) + salt and non-SPE; binary poly(methyl acrylate) (PMA) + salt) in the classic sense to show the phenomenological dielectric response of the imaginary part of impedance (Z″), permittivity (ε*), tangent loss (tan δ), imaginary part of the electric modulus (M″) and conductivity (σ*), which will be discussed in a more detailed manner in the next article as Part 2. The presentation on EIS has been kept from mathematics and electrical theory as much as possible for beginners.
Basics – electrolytes
An electrolyte may be classified as a strong or a weak electrolyte. A strong electrolyte is when the ionic compounds dissociate completely into free ions (e.g., cation and anion) in a polar matrix [c.f. Figure 3(a)]. If only a relatively small fraction of the ionic compound dissociates into free ions or exist as separated ion pairs or contact ion pairs in a polar matrix, it is classified as a weak electrolyte [c.f. Figure 3(b) and (c)]. The degree of dissociation of the ions in the polar solvent is mainly governed by the strength of electrostatic interaction between the charged molecules along with the electrolyte concentration (c). The measurement of the strength of the electrostatic attraction of the ion pair in a medium (polar solvent) is called the Bjerrum length (λB). It is defined as the distance at which the electrostatic interaction (energy) of the ion pair is equal to the thermal energy kBT,
where e is the absolute value of the electronic charge, εo is the permittivity of the vacuum and ε is the dielectric constant of the medium. Equation (1) tells the strength of the interaction λB is highly dependent on the dielectric constant of the medium, the valences of the ions as well as the c. Ionic compounds in a medium with higher dielectric constant will have shorter λB and have significant volume of free ions due to the higher solvation effect (Adar, Markovich, & Andelman, 2017; Lee, Perez-Martinez, Smith, & Perkin, 2017). The quantity of λB could be important to deliberate the electric potential of the solution. Figure 3(a) shows the example of aqueous sodium chloride (NaCl), where the λB is shorter than the distance of separation of the charged molecules, and this phenomenon only can be seen in solution with c → 0 (Fuoss, Onsager, & Skinner, 1965). The ion pairs (charged molecules) possess stronger interaction if the distance of the ion pair is shorter than λB for higher c and vice versa for c → 0, that indicates to the interaction of the ion pairs in the solvent is concentration dependent (Muthukumar, 2012).
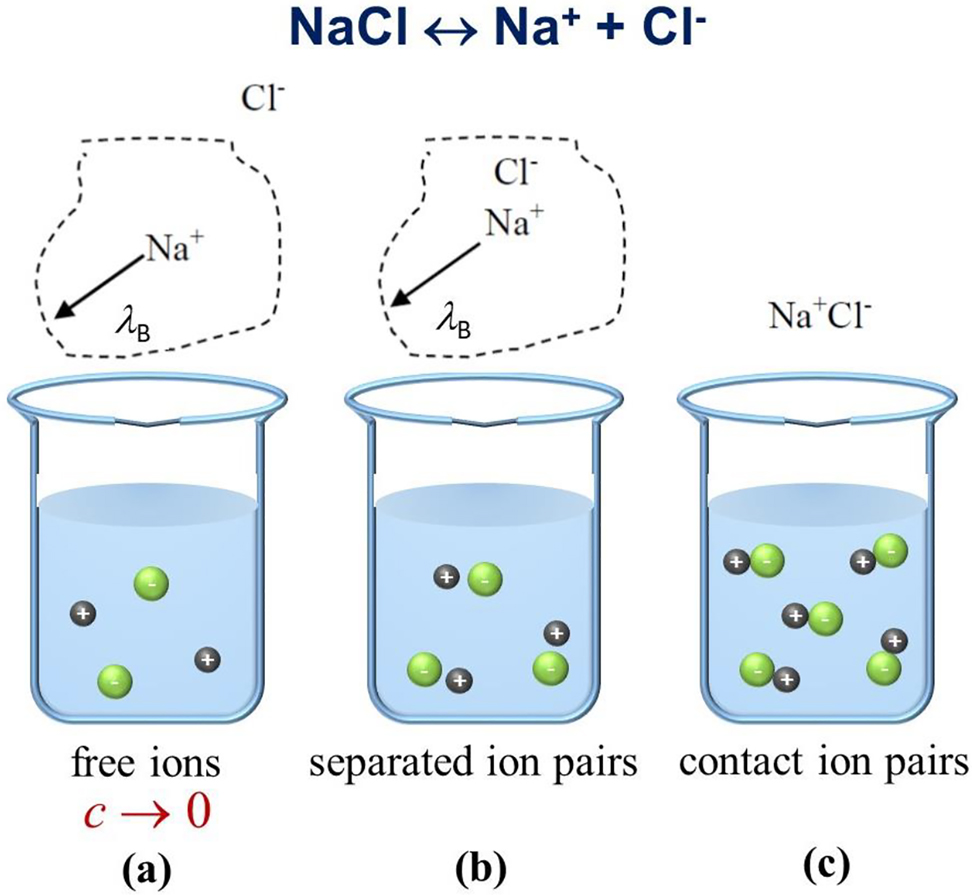
Three possible ion configurations in a solution using the example of aqueous sodium chloride (NaCl) (Fuoss, 1965).
Quantity c denotes as concentration of the electrolyte.
SPE is known as dielectric material because it has the capability to store electrical charges and can only be polarized when placed under an action of external electric field. There will be orientation of the dipolar entities (i.e., positive and negative charges) in the dielectric material to the oppositely charged poles when induced by an external electric field. It turns out that the orientation of dipolar entities makes one side of the dielectric material somewhat positive and the opposite side somewhat negative. A good dielectric material can be easily polarized under an electric field. The dielectric properties of SPE can be described in macroscopic scale by employing such concepts as dielectric constant, permittivity and polarization.
Basics – electrochemical impedance spectroscopy (EIS)
A simple direct current (DC) method (refer to Figure 1) cannot be used to estimate the resistance of a dielectric material due to the polarization of charges taking place at the electrode-electrolyte interface or at the phase boundaries of the sample or the combination of both as in Equation (2),
where resistance (R) is directly proportional to input voltage (V) and inversely proportional to output current (I). Polarization effect can be avoided if the alternating current (AC) is applied to the sample, where the impedance (Z*) of the sample is measured. Impedance measurement or the response of a SPE using EIS is estimated by applying a low amplitude sinusoidal potential (AC voltage) over a range of frequencies to the sample. EIS measures the time response or the dielectric relaxation time of a dielectric, which enables the evaluation or decoupling of small-scale polarization and conductance mechanism at the electrode interface and within the electrolyte, respectively (to be discussed in Part 2).
Dielectric polarization arises from a finite displacement of dipoles in a steady and flowing electric field. As illustrated in Figure 4, when a dielectric material (in this case, the SPE) is placed in between two electrodes under an electric field, the randomly oriented dipolar entities will start to align towards the direction of the oppositely charged electrodes.
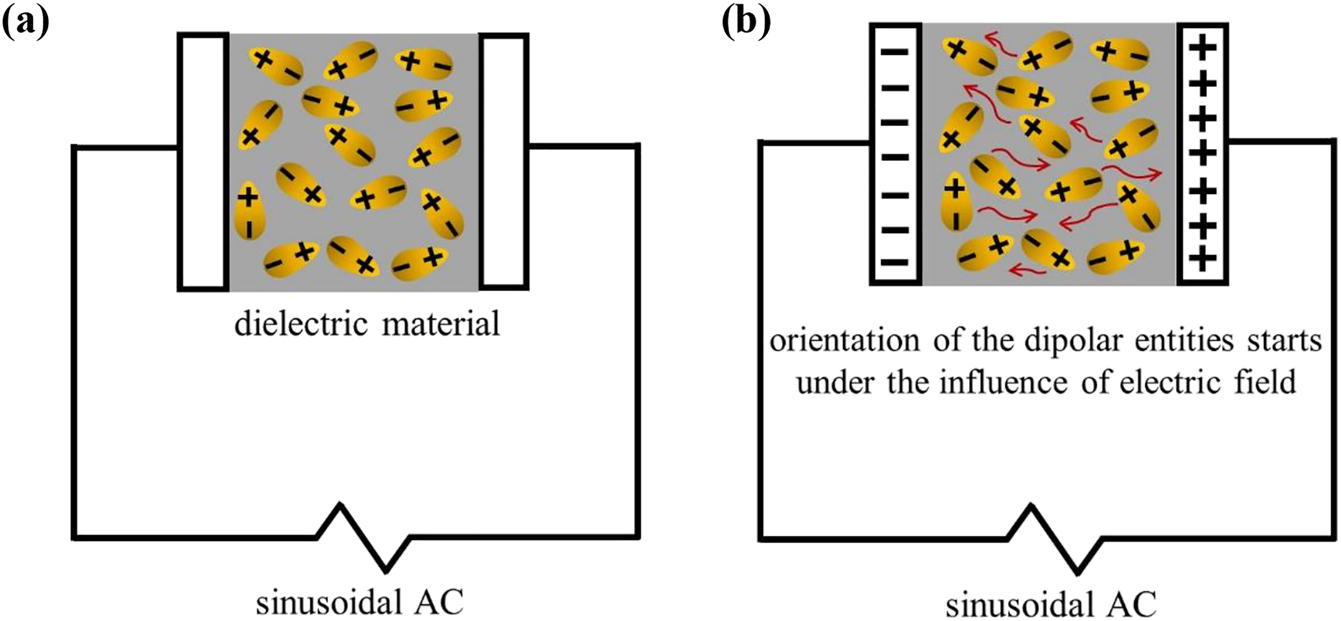
Orientation of dipolar entities of a dielectric material sandwiched in between the parallel-plate capacitor (blocking electrodes) under an action of electric field from (a) to (b).
The alignment of dipolar entities under the action of an alternating electric field is called dielectric polarization and will display dielectric relaxation that is born by the interplay of its resistance and capacitance at a particular frequency. Dielectric relaxation can be seen as the alignment of dipolar entities facing the oppositely charged electrodes at a certain frequency. Normally, if a SPE has one dielectric relaxation time constant, τ =
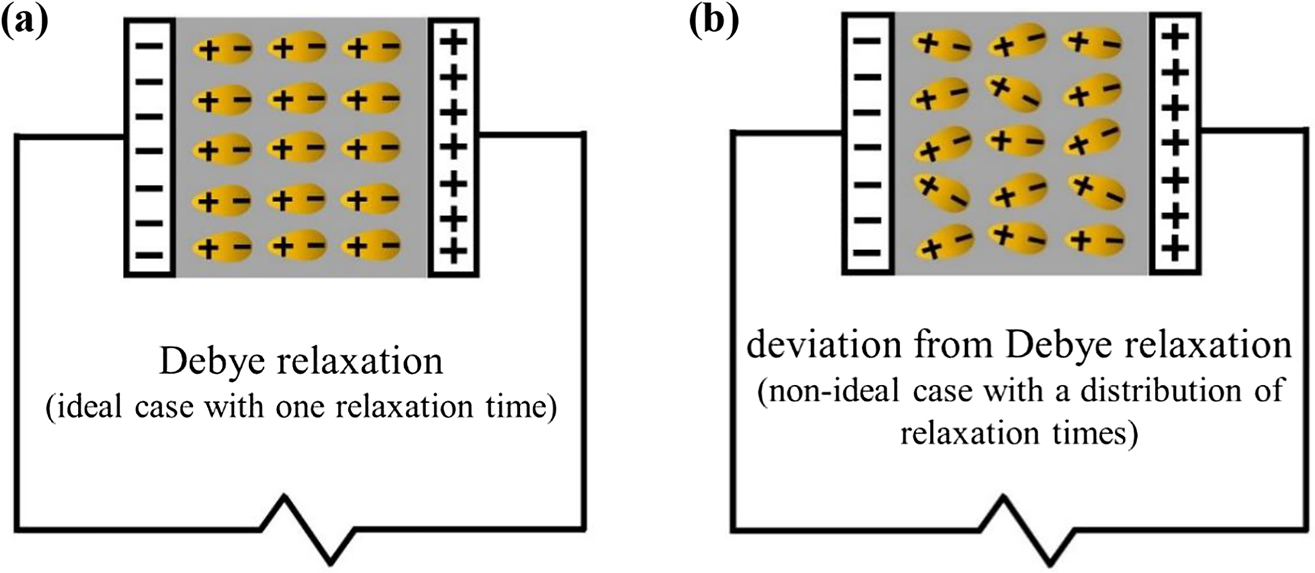
Orientation of dipolar entities of a dielectric material sandwiched in between the parallel-plate capacitor (blocking electrodes) connected to an EIS.
(a) following Debye response, (b) deviation from Debye response.
EIS has been adopted to elucidate the electrical and dielectric relaxations in SPEs and non-SPEs. EIS data may be presented as Nyquist plot or Bode plot. For Nyquist plot, the frequency is hidden and for Bode plot, the frequency is explicit. These two plots are the key quantities of the interest in estimation of electric and dielectric properties of the SPEs and non-SPEs and their interfaces with electrodes (Chan & Kammer, 2015, 2018, 2020). Here, the estimation of bulk resistance of SPEs and non-SPEs from Nyquist plots is discussed in Part 1 of this article and the other dielectric response of SPE and non-SPE in the frequency-dependant plot (or Bode plots) will be presented from the phenomenological point of view in the next article as Part 2.
Experimental description
The preparation procedures of SPEs used for this article were published elsewhere (i.e., dissolution of lithium perchlorate (LiClO4) in poly(ethyne oxide) (PEO) and poly(methyl acrylate) (PMA), respectively) (Halim, Chan, & Winie, 2017). Characteristics of the systems are given in Table 1.
Characteristics of PEO and PMA polymer electrolytes.
| Characteristics | Molar mass (g mol−1) | WSa (wt. %) | Tgb (°C) | Tmc (°C) |
|---|---|---|---|---|
| PEO | 300, 000 | 0.5 and 11 wt. % | −53 | 65 |
| PMA | 40, 000 | 2 and 11 wt. % | 13 | – |
aSalt content estimated from percentage of mass of salt/(mass of polymer + salt).
bGlass transition temperature estimated using differential scanning calorimetry (Abdul Halim, Chan, & Kammer, 2019).
cMelting temperature estimated using differential scanning calorimetry (Halim et al., 2017).
Impedance measurement of each sample was estimated at 25 °C using a Hioki 3532-50 Hi Tester impedance analyzer (Hioki, Chubu, Japan) equipped with a computer for data collection over the frequency range from 50 Hz to 2 MHz. Two stainless steel electrodes with a diameter of 20 mm were used as the current collectors and the blocking electrodes for the ions. The sample was crimped in between the two blocking electrodes for measurement. The estimation of Rb values of the electrolytes will be explained in the discussions section. The values of σDC of the electrolytes can be estimated from Rb following equation of σDC = L/(A·Rb), where quantities L and A denote the thickness of the sample and surface area in touch with the two stainless steel disc electrodes, respectively. Values of σDC for SPEs and non-SPEs reported in this article were obtained from the averaging of three impedance analyses that were measured at three different spots of the sample with errors of σDC approximately at 10%.
Discussions
Estimation of bulk resistance (Rb) from the Nyquist plot
From the electrical point of view, SPE that consisting of ionic salt dissolves in a polymer, exhibits both resistive and capacitive behavior as reflected from the real (Z′) and imaginary (Z″) parts of the complex impedance (Z*), respectively, as illustrated in Figure 6. Figure 6(b) displays an equivalent circuit model of a SPE, where the resistance and capacitance are in parallel that can be distinguished using impedance spectroscopy over a range of frequencies (Randles, 1947). This equivalent circuit is one of the empirical models that was first introduced by Randles in order to compensate for double-layer capacitance phenomenon inspired by Frumkin and Grahame (Frumkin, 1940; Grahame, 1947). Double-layer capacitance also known as electrode polarization is a phenomenon that hinders the impedance measurements of most electrolytic systems due to the accumulation of charged ions at the respective opposite charged electrodes at low frequency region [as highlighted in red-dotted boxes shown in Figure 6(a) and (b)]. This phenomenon normally will result in the distribution of dielectric relaxations of the SPEs. However, this equivalent circuit is not unique to SPEs. Display of a good fit to experimental impedance data is not sufficient to validate a model. Consequently, we demonstrate an alternative to estimate Rb value using manual graphical method in the subsequent section before venturing to equivalent circuit fitting.
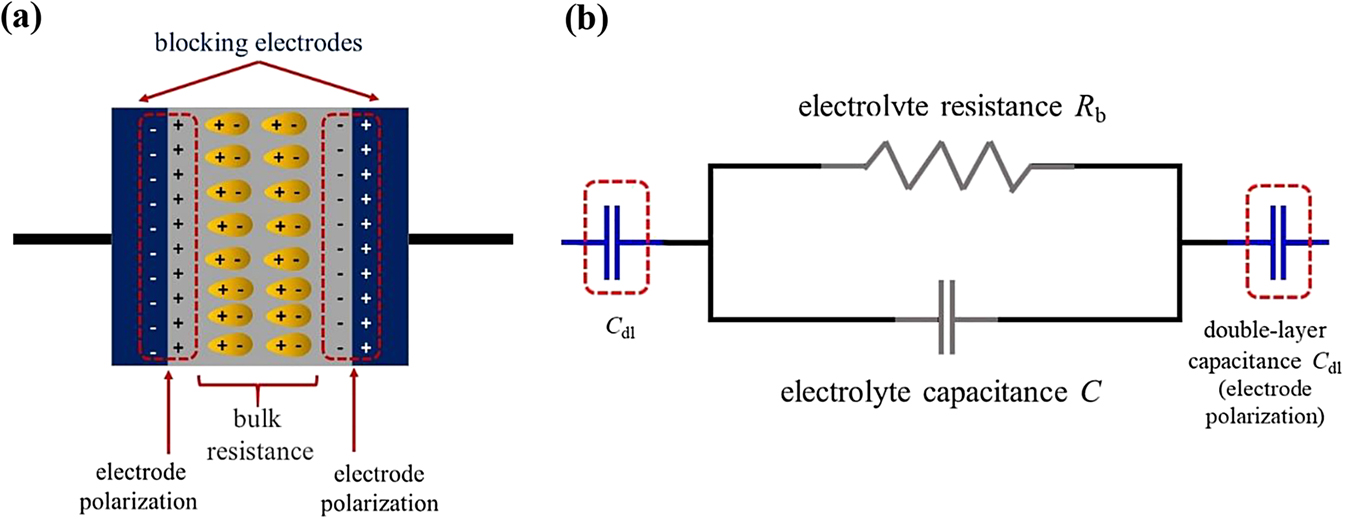
(a) Schematic drawing of SPE sandwiched in between two blocking electrodes following Debye response. (b) Equivalent circuit (model) of SPE sandwiched in between two blocking electrodes.
The data plots of Z′ against Z″ of the impedance measured under AC over a range of frequencies, where the frequency is hidden, are illustrated in Figure 7. These plots are scientifically known as frequency dispersion spectrum or frequently called as Nyquist plot (Cole & Cole, 1941). Each data point in the Nyquist plot represents the impedance of the electrolyte measured at a certain frequency. In fact, the plot is separated into frequency regions known as high frequency region and low frequency region as shown in Figure 7(a). The high frequency region is plotted toward the origin of the figure whereas the low frequency region is plotted outward from the origin of both x- and y-axes.
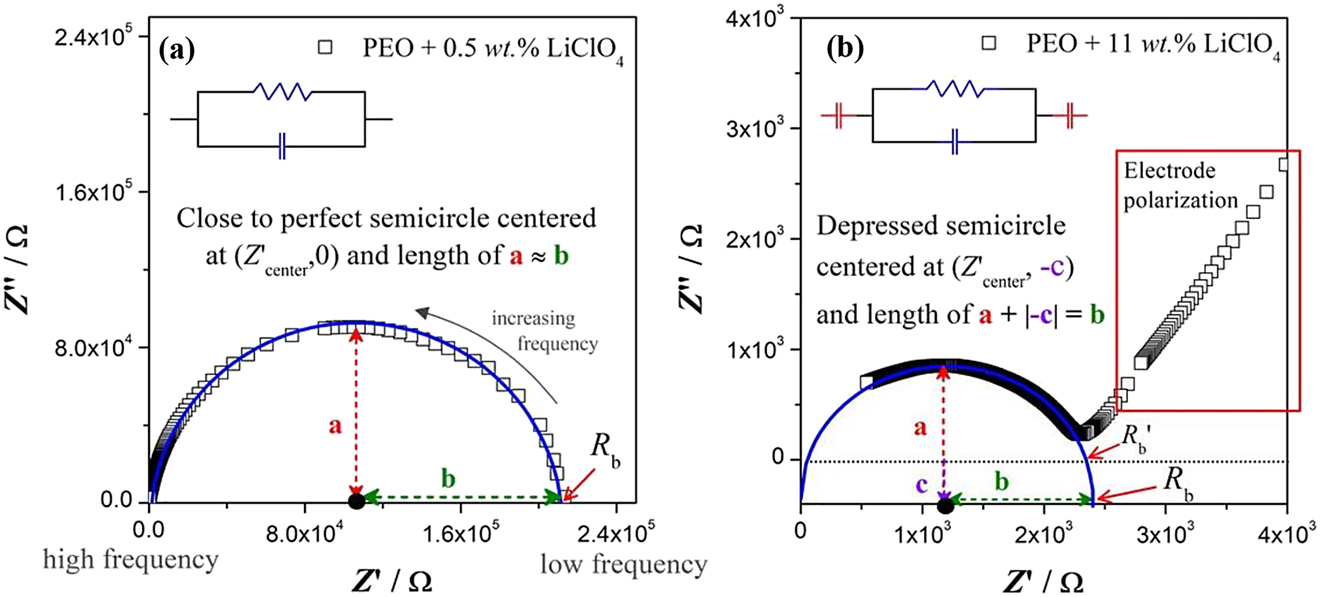
Nyquist plots for SPEs.
(a) a close to perfect semicircle following Debye response, (b) a depressed semicircle with non-Debye response. The solid blue curve is the semicircle fitting of the impedance data estimated from Equation (3).
The equivalent circuits are shown in Figure 7(a) and (b) in order to illustrate the common electrical elements used in the models used for fitting the impedance data as discussed in references (Madani, Schaltz, & Kaer, 2019; Pei, Zhao, Yuan, Peng, & Wu, 2018; Venkateswarlu & Satyanarayana, 1998). We note here, the semicircle fitting in Figure 7(a) and (b) is not following the path of equivalent circuit fitting using commercial EIS software but following the mathematical regression approach to estimate the Rb value from a Nyquist plot with semicircle that was published in reference (Abdul Karim, Chan, & Sim, 2017). The general procedures to estimate the Rb value using mathematical regression approach with commercial graphical software is enclosed in the Supplementary FileS1 – A step-by-step guideline to estimate Rb using mathematical regression with commercial graphical software. The general idea is for a perfect semicircle (that following Debye response) centered at (Rb/2, 0), Z′ = Z″. Hence, it can be seen
In this article, we also demonstrate a manual graphical approach, which can be adopted easily for estimation of Rb value even without the use of any commercial graphical software and computer. This approach is shown in detailed in Supplementary FileS2 – A step-by-step guideline to estimate Rb using manual graphical approach. This may serve as an educational tool for a beginner to get a better insight on the estimation of Rb value before venturing into commercial graphical software (e.g., S1) or commercial EIS software for estimation of Rb value (e.g., S3). Rb is one of the electrical properties of an electrolyte that determines the total resistance of the medium across the electric circuit, that is also inversely proportional to the conductivity of the materials
Figure 7 shows the fitted Nyquist plots [from Equation (3)] with the shape of close to perfect semicircle [c.f. Figure 7(a)] and incomplete depressed semicircle at high frequency region with an inclined spike (due to electrode polarization) at low frequency region [c.f. Figure 7(b)]. For the Nyquist plot with a close to perfect semicircle, the Rb of the SPE can be estimated rather straight forward using manual graphical approach (procedures refer to S2) by finding the intersection point of the semicircle and x-axis at low frequency region [c.f. Figure 7(a)]. In some cases, a depressed semicircle is observed [c.f. Figure 7(b)]. The Rb estimation should be handled with extra attention because the center of the depressed semicircle lies somewhere below Z″ = 0. The Rb value should be estimated from the intersection point of the corrected centered semicircle at Z′ axis. Figure 7(a) displays the close to perfect semicircle impedance data points that centered at (Z′center, 0), where Z′center = Rb/2 and the radius of a should be equivalent to the radius of b. Figure 7(b) displays a depressed semicircle impedance data points that centered at (Z′center, −c) with the radius of (a + ∣−c∣) is equivalent to the radius of b. Frequently, the Rb value of depressed semicircle is estimated imprecisely from the intersection point of the semicircle at Z′ axis that centered at (Z′center, 0), which we term here as Rb′.
The estimation of Rb value may differ >10% error if the estimation is done imprecisely. For instance, for PEO + 11 wt. % LiClO4 system, when a good estimation practice is followed, Rb value of 2.40 × 10³ Ω is obtained, otherwise Rb′ value of 2.10 × 10³ Ω is recorded, where >10% error is noted. It turns out that if Rb′ values are used, we obtain σDC′ instead of σDC values.
Figure 8 illustrates the data interpretation using Rband Rb′ values, respectively for PEO-salt systems. Figure 8 depicts the double-logarithmic plots of conductivity (σDC) as a function of salt concentration (YS). Salt concentration YS = (mass of salt)/(mass of polymer). It turns out the plots denote a power law distribution due to the presence of the functional relationship between the quantities (Chan & Kammer, 2008; Harun, Chan, & Winie, 2017). The double-logarithmic plot of σDC versus YS can be read as
which yields the quantity of σo and the slope of the plot can be expressed by power law exponent of x (Chan & Kammer, 2008; Harun et al., 2017). The exponent x may be designated as the extent of interaction or correlation power between salt molecules and the polymer chains. We observed lower exponent x values, x = 1.95 using Rb values as compared to x = 2.13 using Rb′ values for PEO-salt system [c.f. Figure 8(a) and (b), respectively, where Rb′ < Rb]. Similar observation for PMA. For systems display depressed semicircle of the Nyquist plots, higher conductivity (σDC′) values are estimated from Rb′ values. This may lead to imprecise data interpretation subsequently. Hence, starting from the basic in estimation of Rb values is of important for beginners in order to interpret data precisely.
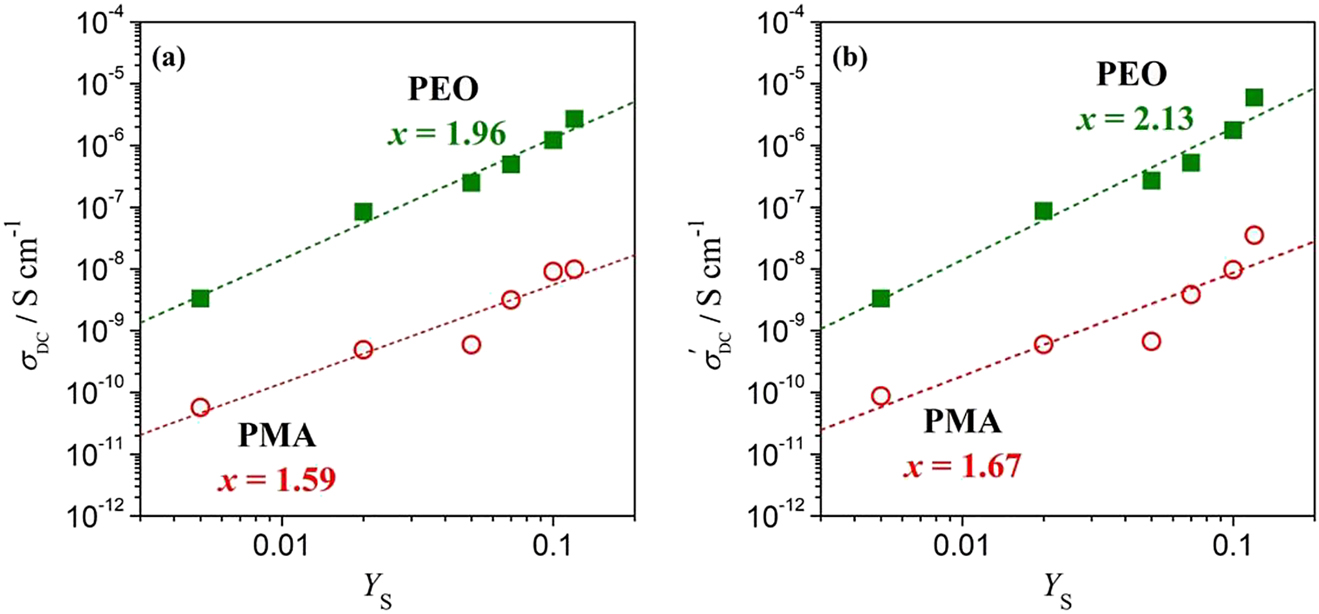
(a) σDC values estimated from Rb values and (b) imprecise σDC′ values estimated from Rb′ values for (■) PEO-salt and (○) PMA-salt systems.
The dotted line represents the linear regressions after Equation (4).
The approach for estimation of Rb value that we proposed using mathematical regression approach (refer to S1) and manual graphical approach (refer to S2) are easy to be followed by beginners. A comparison of the reproducibility of the Rb values estimated using (i) mathematical regression approach, (ii) manual graphical approach and (iii) a commercial EIS software [refer to S3 – A brief explanation on the estimation of Rb value using Nova software (version 2.1.4, Metrohm Autolab B.V., Utrecht, Netherlands)] is attempted as shown in Table 2. The reproducibility of Rb values using the three different approach can be observed.
Rb and σDC values of PEO-LiClO4 estimated using different approaches.
| Approach used | PEO + 0.5 wt. % of LiClO4Rb (Ω) [σDC (S cm−1)] | PEO + 11 wt. % of LiClO4Rb (Ω) [σDC (S cm−1)] |
|---|---|---|
| Manual graphical | 2.81 × 10⁶ [3.32 × 10⁻⁹] | 2.41 × 10³ [5.55 × 10⁻⁶] |
| Mathematical regression | 2.80 × 10⁶ [3.33 × 10⁻⁹] | 2.40 × 10³ [5.57 × 10⁻⁶] |
| EIS software (Nova, 2018) | 2.82 × 10⁶ [3.31 × 10⁻⁹] | 2.49 × 10³ [5.37 × 10⁻⁶] |
The guides in S1 and S2 enable the users to understand the basic working principles for estimation of Rb when they rely on the EIS software in the subsequent attempt. We note here, different EIS software may have different mathematical algorithms for estimation of Rb value. With the basic understanding as presented in S1 and S2, the users may choose a suitable mathematical algorithms or suitable equivalent circuit for data extraction based on the shape of the semicircle.
Besides, a more detailed explanation on phenomenological dielectric response of SPEs and non-SPEs in the classic sense as mentioned herein will be discussed in the Part 2 of the next article. We will demonstrate the frequency-dependant impedance plots are the key quantities of the interest to decouple the short-range and long-range dielectric properties of the electrolytes and their interfaces with the conducting electrodes.
Conclusion
The basic working principles of electrolyte and electrochemical impedance spectroscopy were presented here for the delivery of insightful background for beginners or young researchers from undergraduate or postgraduate levels. This article covers the background of the electrolytes, instrumentation of EIS, step-by-step procedures to elucidate Rb values of electrolytes from various approaches provided with several examples and exercises, as well as a case study of data interpretation. Next, phenomenological dielectric response of SPEs and non-SPEs will be highlighted in Part 2 of next article. This insightful initiative can be served as the self-learning resources and coaching materials for educational purposes.
This is one of the instructor’s notes based on the short course presented at the 25th POLYCHAR 2017 World Forum on Advanced Materials, Kuala Lumpur, Malaysia, October 9–13, 2017. The power point slides can be accessed via https://iupac.org/wp-content/uploads/2017/12/IUPAC_PolymEdu_Shortcourse_1ppt_ChinHanChan.pdf and the QR code.
Funding source: Universiti Teknologi MARA (UiTM)
Funding source: Ministry of Education
Acknowledgments
The authors would like to express appreciation to Mdm. Amirah Hashifudin for providing impedance result of PEO with 0.5 wt. % of LiClO4.
Author contributions: All the authors have accepted responsibility for the entire content of this submitted manuscript and approved submission.
Research funding: The authors would also like to express the greatest appreciation to Universiti Teknologi MARA (UiTM), Malaysia for granting LESTARI Grant (600-IRMI/MyRA/5/3/LESTARI (1072/2017)) and Ministry of Education, Malaysia for providing MyBrain15 (MyPhD) to financially support some experimental work of this article.
Conflict of interest statement: The authors declare no conflicts of interest regarding this article.
References
Abdul Halim, S. I., Chan, C. H., & Kammer, H.-W. (2019). About glass transition in polymer-salt mixtures. Polymer Testing, 79, 105994. https://doi.org/10.1016/j.polymertesting.2019.105994.Search in Google Scholar
Abdul Karim, S. R. B., Chan, C. H., & Sim, L. H. (2017). Impedance spectroscopy: a practical guide to evaluate parameters of a Nyquist plot for solid polymer electrolyte applications. Functional Polymeric Composites: Macro to Nanoscales, 1st edition, 97–128. https://doi.org/10.1201/9781315207452-5.Search in Google Scholar
Adar, R. M., Markovich, T., & Andelman, D. (2017). Bjerrum pairs in ionic solutions: a Poisson-Boltzmann approach. Journal of Chemical Physics, 146(19), 1–8. https://doi.org/10.1063/1.4982885.Search in Google Scholar
Baril, D., Michot, C., & Armand, M. (1997). Electrochemistry of liquids versus solids: polymer electrolytes. Solid State Ionics, 94(1–4), 35–47. https://doi.org/10.1016/s0167-2738(96)00614-5.Search in Google Scholar
Baskoro, F., Wong, H. Q., & Yen, H. J. (2019). Strategic structural design of a gel polymer electrolyte toward a high efficiency lithium-ion battery. ACS Applied Energy Materials, 2(6), 3937–3971. https://doi.org/10.1021/acsaem.9b00295.Search in Google Scholar
Chan, C. H., & Kammer, H.-W. (2008). Properties of solid solutions of poly(ethylene oxide)/epoxidized natural rubber blends and LiClO4. Journal of Applied Polymer Science, 110, 424–432. https://doi.org/10.1002/app.28555.Search in Google Scholar
Chan, C. H., & Kammer, H. W. (2015). Polymer electrolytes—relaxation and transport properties. Ionics, 21(4), 927–934. https://doi.org/10.1007/s11581-014-1256-3.Search in Google Scholar
Chan, C. H., & Kammer, H. W. (2018). Characterization of polymer electrolytes by dielectric response using electrochemical impedance spectroscopy. Pure and Applied Chemistry, 90(6), 939–953. https://doi.org/10.1515/pac-2017-0911.Search in Google Scholar
Chan, C. H., & Kammer, H. W. (2020). Low frequency dielectric relaxation and conductance of solid polymer electrolytes with PEO and blends of PEO and PMMA. Polymers, 12, 1–19. https://doi.org/10.3390/polym12051009.Search in Google Scholar
Cole, K. S., & Cole, R. H. (1941). Dispersion and absorption in dielectrics I. Alternating current characteristics. The Journal of Chemical Physics, 9(4), 341–351. https://doi.org/10.1063/1.1750906.Search in Google Scholar
Debye, P. (1929). Polar molecules (p. 94). New York: Chemical Catalogue Company.Search in Google Scholar
Debye, P., & Falkenhagen, H. (1928). Dispersion of the conductivity and dielectric constants of strong electrolytes. Physikalische Zeitschrift, 29(121–132), 401–426.Search in Google Scholar
Frumkin, A. (1940). Part II. – (A) Electrokinetic equations. The study of the double layer at the metal-solution interface by electrokinetic and electrochemical methods. Transactions of the Faraday Society, 35, 117–127. https://doi.org/10.1039/tf9403500117.Search in Google Scholar
Fuoss, R. M., Onsager, L., & Skinner, J. F. (1965). The conductance of symmetrical electrolytes. V. The conductance equation. Journal of Physical Chemistry, 69(8), 2581–2594. https://doi.org/10.1021/j100892a017.Search in Google Scholar
Grahame, D. C. (1947). The electrical double layer and the theory of electrocapillarity. Chemical Reviews, 41(3), 441–501. https://doi.org/10.1021/cr60130a002.Search in Google Scholar
Halim, S. I. A., Chan, C. H., & Winie, T. (2017). Thermal, conductivity and molecular interaction studies of poly(ethylene oxide)/poly(methyl acrylate) solid polymer electrolytes. Macromolecular Symposia, 371(1), 114–124. https://doi.org/10.1002/masy.201600050.Search in Google Scholar
Harun, F., Chan, C. H., & Winie, T. (2017). Influence of molar mass on the thermal properties, conductivity and intermolecular interaction of poly(ethylene oxide) solid polymer electrolytes. Polymer International, 66(6), 830–838. https://doi.org/10.1002/pi.5322.Search in Google Scholar
Hussin, N. S., Harun, F., & Chan, C. H. (2017). Thermal roperties and conductivity of thermally treated epoxidized natural rubber-based solid polymer electrolytes. Macromolecular Symposia, 376(1), 1–7. https://doi.org/10.1002/masy.201700049.Search in Google Scholar
Klinklai, W., Kawahara, S., Marwanta, E., Mizumo, T., Isono, Y., & Ohno, H. (2006). Ionic conductivity of highly deproteinized natural rubber having various amount of epoxy group mixed with lithium salt. Solid State Ionics, 177(37–38), 3251–3257. https://doi.org/10.1016/j.ssi.2006.08.006.Search in Google Scholar
Kong, L., Li, C., Jiang, J., & Pecht, M. G. (2018). Li-ion battery fire hazards and safety strategies. Energies, 11(9), 1–11. https://doi.org/10.3390/en11092191.Search in Google Scholar
Larson, C., Peele, B., Li, S., Robinson, S., Totaro, M., Beccai, L., … Shephard, R. (2016). Highly stretchable electroluminescent skin for optical signaling and tactile sensing. Science, 351(6277), 1071–1074. https://doi.org/10.1126/science.aac5082.Search in Google Scholar
Learn Engineering. (2019). Lithium-ion battery, How does it work? Retrieved from https://www.youtube.com/watch?v=VxMM4g2Sk8U.Search in Google Scholar
Lee, A. A., Perez-Martinez, C. S., Smith, A. M., & Perkin, S. (2017). Underscreening in concentrated electrolytes. Faraday Discussions, 199, 239–259. https://doi.org/10.1039/c6fd00250a.Search in Google Scholar
Li, Q., Chen, J., Fan, L., Kong, X., & Lu, Y. (2016). Progress in electrolytes for rechargeable Li-based batteries and beyond. Green Energy & Environment, 1(1), 18–42. https://doi.org/10.1016/j.gee.2016.04.006.Search in Google Scholar
Liu, J., Bao, Z., Cui, Y., Dufek, E. J., Goodenough, J. B., Khalifah, P., … Meng, Y. S. (2019). Pathways for practical high-energy long-cycling lithium metal batteries. Nature Energy, 4(3), 180–186. https://doi.org/10.1038/s41560-019-0338-x.Search in Google Scholar
Lopez, J., Mackanic, D. G., Cui, Y., & Bao, Z. (2019). Designing polymers for advanced battery chemistries. Nature Reviews Materials, 4(5), 312–330. https://doi.org/10.1038/s41578-019-0103-6.Search in Google Scholar
Mackanic, D. G., Yan, X., Zhang, Q., Matsuhisa, N., Yu, Z., Jiang, Y., … Chen, X. (2019). Decoupling of mechanical properties and ionic conductivity in supramolecular lithium ion conductors. Nature Communications, 10(1), 1–11. https://doi.org/10.1038/s41467-019-13362-4.Search in Google Scholar
Madani, S. S., Schaltz, E., & Kaer, S. K. (2019). An electrical equivalent circuit model of a lithium titanate oxide battery. Batteries, 5(31), 1–14. https://doi.org/10.3390/batteries5010031.Search in Google Scholar
Manthiram, A., Yu, X., & Wang, S. (2017). Lithium battery chemistries enabled by solid-state electrolytes. Nature Reviews Materials, 2(4), 1–16. https://doi.org/10.1038/natrevmats.2016.103.Search in Google Scholar
Miyamoto, A., Lee, S., Cooray, N. F., Lee, S., Mori, M., Matsuhisa, N., … Someya, T. (2017). Inflammation-free, gas-permeable, lightweight, stretchable on-skin electronics with nanomeshes. Nature Nanotechnology, 12(9), 907–913. https://doi.org/10.1038/nnano.2017.125.Search in Google Scholar
Mohd Yusoff, S. N. H., Sim, L. H., Chan, C. H., Hashifudin, A., & Kammer, H.-W. (2013). Solid solution of polymer electrolytes based on modified natural rubber. Polymer Research Journal, 7, 159–169.Search in Google Scholar
Muthukumar, M. (2012). Polymer translocation. Boca Raton: CRC Press, Taylor & Francis Group.Search in Google Scholar
Ngai, K. S., Ramesh, S., Ramesh, K., & Juan, J. C. (2016). A review of polymer electrolytes: fundamental, approaches and applications. Ionics, 22, 1259–1279. https://doi.org/10.1007/s11581-016-1756-4.Search in Google Scholar
Nova. (2018). Nova (Version 2.1.4) [Computer Software]. Utrecht, Netherlands: Metrohm Autolab B.V.Search in Google Scholar
Pei, Z., Zhao, X., Yuan, H., Peng, Z., & Wu, L. (2018). An equivalent circuit model for lithium battery of electric vehicle considering self-healing characteristic. Journal of Control Science and Engineering, 2018, 1–11. https://doi.org/10.1155/2018/5179758.Search in Google Scholar
Plante, G. (1884). Gaston plante. USA: Scientific American.Search in Google Scholar
Pratap, R., & Chandra, S. (2013). Ion transport studies in PEO:NH4ClO4 polymer electrolyte and its composite with Al2O3. Polymer Bulletin, 70(11), 3075–3089. https://doi.org/10.1007/s00289-013-1008-y.Search in Google Scholar
Raja, V., Sharma, A. K., & Rao, V. V. R. N. (2004). Impedance spectroscopic and dielectric analysis of PMMA-CO-P4VPNO polymer films. Materials Letters, 58(26), 3242–3247. https://doi.org/10.1016/j.matlet.2004.05.061.Search in Google Scholar
Ramesh, S., & Bing, K. N. (2012). Conductivity, mechanical and thermal studies on poly(methyl methacrylate)-based polymer electrolytes complexed with lithium tetraborate and propylene carbonate. Journal of Materials Engineering and Performance, 21(1), 89–94. https://doi.org/10.1007/s11665-010-9807-x.Search in Google Scholar
Ramström, O. (2019). Scientific background on the nobel prize in chemistry 2019 - lithium-ion batteries. The Royal Swedish Academy of Sciences, 1, 1–13.Search in Google Scholar
Randles, J. E. B. (1947). Kinetics of rapid electrode reactions. Discussions of the Faraday Society, 1, 11–19. https://doi.org/10.1039/df9470100011.Search in Google Scholar
Stephan, A. M. (2006). Review on gel polymer electrolytes for lithium batteries. European Polymer Journal, 42(1), 21–42. https://doi.org/10.1016/j.eurpolymj.2006.02.006.Search in Google Scholar
Su, Y.-L., Wang, J., & Liu, H.-Z. (2002). Melt, hydration, and micellization of the PEO-PPO-PEO block copolymer studied by FTIR spectroscopy. Journal of Colloid and Interface Science, 251(2), 417–23. https://doi.org/10.1006/jcis.2002.8435.Search in Google Scholar
Venkateswarlu, M., & Satyanarayana, N. (1998). AC conductivity studies of silver based fast ion conducting glassy materials for solid state batteries. Materials Science and Engineering: B, 54(3), 189–195. https://doi.org/10.1016/s0921-5107(98)00156-1.Search in Google Scholar
Voss, E. (1990). The Gaston planté medal address. Journal of Power Sources, 30, 7–10. https://doi.org/10.1016/0378-7753(93)80058-W.Search in Google Scholar
Zhang, Q. H., & Chen, D. J. (2004). Percolation threshold and morphology of composites of conducting carbon black/polypropylene/EVA. Journal of Materials Science, 39(5), 1751–1757. https://doi.org/10.1023/b:jmsc.0000016180.42896.0f.10.1023/B:JMSC.0000016180.42896.0fSearch in Google Scholar
Supplementary Material
The online version of this article offers supplementary material (https://doi.org/10.1515/cti-2020-0011).
Three supplementary files (i.e., S1 – A step-by-step guideline to estimate bulk resistance (Rb) using mathematical regression with commercial graphical software, S2 – A step-by-step guideline to estimate Rb using manual graphical approach, supplemented with several exercises and S3 – A step-by-step guideline to estimate Rb using exclusive EIS software) are provided separately for educational, practical, and self-learning purposes.
© 2021 Suhaila Idayu Abdul Halim et al., published by De Gruyter, Berlin/Boston
This work is licensed under the Creative Commons Attribution 4.0 International License.
Articles in the same Issue
- Frontmatter
- Preface
- Special issue of Chemistry Teacher International in Polymer Sciences
- Review Articles
- Fundamentals of reversible addition–fragmentation chain transfer (RAFT)
- Reversible-Deactivation Radical Polymerisation: chain polymerisation made simple
- Ring-opening polymerization
- Other
- Thermal analysis: basic concept of differential scanning calorimetry and thermogravimetry for beginners
- Review Article
- Size-exclusion chromatography as a useful tool for the assessment of polymer quality and determination of macromolecular properties
- Other
- Basics of teaching electrochemical impedance spectroscopy of electrolytes for ion-rechargeable batteries – part 1: a good practice on estimation of bulk resistance of solid polymer electrolytes
- Special Issue Paper
- Basics of teaching electrochemical impedance spectroscopy of electrolytes for ion-rechargeable batteries – part 2: dielectric response of (non-) polymer electrolytes
- Good Practice Report
- Chirality analysis of helical polymers
- Other
- Fabrication and function of polymer membranes
- Review Article
- Nano- and microgels: a review for educators
- Other
- Theoretical background on semiconducting polymers and their applications to OSCs and OLEDs
- Good Practice Report
- An understandable approach to the temperature dependence of electric properties of polymer-filler composites using elementary quantum mechanics
- Review Article
- Polymer degradation: a short review