Evaluation of double-bottom structure performance under fire accident using nonlinear finite element approach
-
Muhammad Affan Satriatama
 ,
Aditya Rio Prabowo
,
Bambang Kusharjanta
,
Aditya Rio Prabowo
,
Bambang Kusharjanta

Abstract
This study was conducted to evaluate the response of the double-bottom structure on a ship when a fire phenomenon involves temperature elevation and depreciation. Fire accidents on ships can be very detrimental, especially since ships are the main transportation for export and import activities. Therefore, this research is needed to reduce the risk of fire accidents on ships, especially on double-bottom structures. This study used the finite element modeling method in ABAQUS software. The research results found that the Von Mises stress contour, strain, and displacement values were influenced by the type of material, temperature, and plate thickness. Based on the results evaluated using the multi-attribute decision-making method, model 32 is the best model, while model 95 is the worst. Concurrently, from sensitivity analysis, it was found that temperature plays a significant role in the results of Von Mises Stress, Strain, and Displacement. The results indicated that the main factor influencing the Von Mises stress, strain, and displacement is the loading in the form of temperature, followed by material properties and plate thickness.
1 Introduction
In this era of globalization, maritime transportation remains a crucial backbone for international trade, facilitating the bulk of export-import activities globally. Export activities in Indonesia have significant potential to become the backbone of the country’s economy, based on data in Figure 1. Despite falling commodity prices and a bleak global economic outlook, the country maintained a positive trade balance, with a surplus of USD 12.25 billion in Q1 2023, up 31.3% from 2022. This increase was driven by strong global demand for non-oil and gas commodities like mineral fuels and nickel. Indonesia’s trade surplus was highest with the US, India, and the Philippines, and exports to Switzerland, Russia, Italy, Belgium, and Spain rose by over 40% in March.

Indonesia’s export, import, and trade balance (2022–2023).
Indonesia’s vast archipelago and reliance on sea routes exemplify this trend. According to the Central Statistics Agency (BPS), Indonesia’s export activities surged to a significant US$291.90 billion in 2022, with sea transportation contributing a staggering 95.4% of the total [1]. This reliance on maritime shipping will continue through 2023, highlighting the sector’s indispensable role in global logistics. However, despite its economic significance, maritime transportation is fraught with risks, especially accidents that can damage vessels or even loss of life. Various factors, such as system failures, fuel leaks, or human error, contribute to these accidents. The following data presents ship accidents categorized by their causes from 2011 to 2020. It can be observed that the number of ship accidents caused by fire has not decreased and tends to remain consistent each year. In contrast, ship accidents attributed to other factors have shown a decline (Figure 2).

Total losses by cause between 2011 and 2020.
From 2018 to 2023, maritime accidents have remained relatively stagnant, underscoring sea transportation’s persistent and urgent dangers. In the first half of 2023, the National Transportation Safety Committee (KNKT) reported investigating four major maritime accidents, three involving fires aboard ships [2]. These incidents highlight the pressing need for effective mitigation strategies to minimize damage and safeguard lives. A critical approach to addressing these risks involves the structural analysis of fire phenomena and their impact on vessels.
Past research has delved into the response of materials and structures under fire conditions using numerical and experimental methods. These studies primarily aimed to evaluate various materials’ structural integrity and resilience when subjected to intense heat [3,4,5,6,7]. An essential aspect of fire simulations is understanding the adiabatic surface temperature, which is pivotal in calculating the heat transfer to structures exposed to fire [8]. Additionally, studying conduction on surfaces is critical to accurately modeling how heat affects different materials [9].
The present research, conducted with thoroughness and precision, seeks to contribute to maritime safety by evaluating double-bottom ship structures subjected to fire. Using advanced numerical simulations conducted through ABAQUS software and employing the coupled temperature-displacement method, the study investigates the impact of fire on these structures. By varying material types, temperature levels, and plate thickness, the research aims to determine the effects of fire on critical parameters such as Von Mises stress, strain, and displacement. The results from these simulations are expected to provide valuable insights into how fire influences the structural integrity of ships, which, in turn, can inform better safety protocols and design improvements to mitigate the risks associated with maritime transportation.
2 Development of fire-structure interaction analysis
Based on existing research, several studies related to fire structure interaction serve as the foundation for this research. The study conducted by Gillie [3] is a numerical analysis of a simple beam with a shell type subjected to thermal and mechanical loading. The output data produced includes axial force and displacement, aiming to analyze the structural response to temperature changes combined with mechanical loads. The finite element method study by Silva et al. [10] analyzes a shell structure as a square panel exposed to high temperatures, integrating thermal and mechanical aspects to assess the structural performance when exposed to fire. This model focuses on the interaction between high temperatures and the mechanical response of structural materials. Additionally, Couto et al. [11] researched fire structure interaction, emphasizing the importance of understanding structural behavior under loading. The structure used in his study consisted of a column and a beam.
Based on these three previous studies, it can be concluded that the numerical approaches for fire structure interaction have provided a simple analysis to understand a structure’s response when exposed to fire. The models used in those studies are simple, serving as a foundation for understanding fire–structure interaction. However, sandwich structures have been developed significantly for more complex finite element analysis (FEA). Nurcholis et al. [12] demonstrated that a sandwich structure with square and hexagonal cores was used to analyze the response of sandwich structures during fire events. The research method employed by Nurcholis et al. is similar to that used by Gillie, which is a non-linear analysis, resulting in findings related to axial force and mid-span deflection.
Based on this evaluation, it is necessary to implement analytical methods into more complex and real-world relevant structures. One example is ship structures, which have a significant potential for fire hazards. If a ship’s structure suffers damage, it can lead to severe consequences for many stakeholders. Table 1 shows the differences between Gillie’s and Nurcholis’s research and the study to be conducted, which shows several factors that differentiate the research.
Comparison of assumptions between existing approaches and the new method
| Reference | Gillie [3] | Nurcholis et al. [12] | Present Study |
|---|---|---|---|
| Methodology | FEM | FEM | FEM |
| Geometry | Simple beam structure | Sandwich core structure | Double-bottom structure |
| Boundary condition | |||
| Displacement/rotation | X | — | — |
| Pinned | — | X | X |
| Encastre | — | X | X |
| Material | |||
| Steel | X | — | X (AH 32, AH 36, DH 32, DH 36) |
| Carbon steel | — | X | X (Medium carbon steel) |
| Study case | — | Fire accident due to hydrogen leaks | fire accident in a cargo/passanger ship |
| Statistical analysis | — | — | X (MADM and sensitivity analysis) |
| Implementation | — | Ship deck structure | Ship girder structure |
| Simulation type | Nonlinear Analysis | Nonlinear analysis | Nonlinear analysis |
| Parameter | |||
| Axial force | X | X | — |
| Von Mises stress | — | X | X |
| Strain | — | — | X |
| Displacement | X | X | X |
Ship structures can be modeled using thin plate theory. Essentially, these structures consist of various elements made from thin materials, as seen in sandwich panels, making the application of thin plate theory and its equations highly relevant for analyzing mechanical behavior under extreme conditions. Thin plate theory includes several fundamental equations [13,14], with Eq. (1) illustrating the deflection equation for thin plates.
where
The following equation demonstrates the resistance of the plate to bending. A higher value indicates greater stiffness, where
where
where it is explained that
where
where
where it is explained that
Based on Eq. (8), which relates to energy balance, it can be concluded that the change in energy within a system must be proportional to the work done by external forces. The normal stress in a thin plate expresses the relationship between moment and normal stress within the plate, as shown in Eq. (9).
where
where
3 Benchmark study
3.1 Testing profile
Several studies on structural analysis of fire conditions have been carried out, which will later become the basis of this research. The research carried out is a study with a numerical approach (see flowchart in Figure 3). The simulation was conducted to analyze the displacement and axial forces that occur in a simple structure as a beam when it is affected by a fire phenomenon. The simulation model is shown in Figure 4; the boundary condition used in the benchmarking model is of the displacement/rotation type on both sides of the model, positioned at the reference points on the right and left sides, allowing the model to move in the y-axis direction. The material used in the structure is steel with a yield strength value of 250 MPa at 0°C and decreases linearly to 0 MPa at a temperature of 1,000°C. Young’s Modulus and Coefficient Thermal Expansion were assumed to remain constant regardless of temperature, respectively 207 GPa and 1.2 × 1/°C. Apart from the temperature load, the beam is also given a uniform vertical mechanical load of 4,250 N/m. This load was chosen to maintain it when the beam was supported and heated to 800°C. The temperature applied to the model is given an amplitude, as in Figure 5.

Research flowchart.

Geometry model benchmarking.

Benchmarking temperature history.
3.2 Results
The simulation results obtained the maximum displacement at 60 mm, which occurred at 1.5 s at a temperature of 800°C. There was a decrease in the displacement value when the temperature decrease was carried out. It states that the displacement value obtained is proportional to the temperature value [15]. The displacement value will reach its maximum point when the temperature is maximum. When the temperature decreases, the displacement value will decrease linearly until it almost returns to its original shape.
Meanwhile, the axial force increases rapidly when heated because the lateral support limits the thermal expansion. The rate of development of axial forces is directly related to the stiffness of the support. At several points, the beam bends, and the deflection increases rapidly. As a result, axial forces are reduced because previously confined thermal strains can now be released through geometric elongation of the beam. The axial force continues to decrease until the end of the cycle, which occurs due to the reduction in material strength caused by changes in temperature. The results of the simulation are shown in Figure 6.

Graphs of (a) displacement and (b) axial force.
3.3 Mesh convergence study
Mesh convergence studies were conducted to obtain accuracy and stability in fire simulations [16]. Various mesh sizes are applied to determine the right mesh size to obtain accurate simulation results with ideal time duration. Therefore, the sizes and types of mesh used in this study start from 0.09, 0.14, 0.19, 0.24, 0.29, 0.34, 0.39, and 0.44 m. The results obtained from this mesh convergence study are shown in Figure 7, which shows the displacement values. It was found that the stability of the results occurred when the mesh size applied was in the range between 0.09 and 0.34 m. Meanwhile, the displacement results obtained for larger mesh sizes tend to increase from the stable area. Thus, the mesh used in the study is 0.09 m to obtain maximum stability and accuracy.

Displacement on mesh convergence study.
4 Methodology
4.1 Coupled temperature-displacement method
The coupled temperature-displacement method is a technique in which the response of a structure to deformation or displacement is observed alongside temperature changes. In fire conditions, temperature changes are closely related to structural deformation, as high temperatures can cause thermal expansion of the structural material, affecting the deformation and displacement. A comprehensive understanding of temperature and mechanical response interaction is essential for designing fire-resistant structures. Therefore, the coupled temperature-displacement analysis becomes a tool used in structural engineering to predict and understand the behavior of structures under extreme conditions such as fire. Eqs. (11) and (12) can be used as fundamental bases for this analysis to analyze the effects of temperature on the changes in structural properties under fire conditions.
The thermal expansion formula describes how materials expand when subjected to temperature changes. Specifically, it quantifies the change in length,
The stress due to temperature change formula quantifies the internal stress,
4.2 Geometrical model
In this study, the geometry used to simulate fire conditions is a double-bottom structure on a passenger ship. This structure was created using ABAQUS software with a shell model and various plate thicknesses applied. The shape of the structure can be seen in Figure 8. This double-bottom structure is 10 m long, 5.2 m wide, and 1.2 m high.

Double-bottom structure model.
4.3 Applied material
The materials used in this study are five types of materials commonly used in ship structures. These materials are AH 32 steel, AH 36 steel, DH 32 steel, DH 36 steel, and medium carbon steel. In the ABAQUS software, to carry out fire simulations using the coupled temperature-displacement method, apart from including general material properties such as Yield Strength, Young’s Modulus, and density, thermal material properties such as specific heat, thermal expansion coefficient, and conductivity are also required. Table 2 displays the property values of each material used in this study.
Material properties of the deployed naval structure
| Property of material | Modulus of elasticity (GPa) | Yield strength (MPa) | Density (kg/m3) | Specific heat capacity (J/kg K) | Thermal conductivity (W/m K) | Coefficient of thermal expansion (
|
|---|---|---|---|---|---|---|
| AH 32 Steel | 215 | 315 | 7,850 | 465 | 52 | 13.2 |
| AH 36 Steel | 200 | 350 | 7,800 | 470 | 52 | 12 |
| DH 32 Steel | 210 | 315 | 7,850 | 465 | 32 | 13.8 |
| DH 36 Steel | 210 | 350 | 7,800 | 458 | 40 | 16 |
| Medium carbon steel | 420 | 187 | 7,750 | 470 | 45 | 10.8 |
4.4 Boundary conditions and designed scenarios
4.4.1 Meshing configuration
In simulations using numerical methods, meshing is one of the most essential components that can influence the accuracy of the simulation results [17]. Therefore, choosing the right element type and mesh size is necessary to increase the accuracy of simulation results using finite element modeling (FEM). In this study, the mesh used is 0.09 m in size with S4RT thermally coupled elements. The type and size of these elements were chosen in this simulation because they have achieved stability for running fire simulations [18]. An illustration of the mesh used in this simulation is shown in Figure 9.

Mesh configuration.
4.4.2 Boundary conditions
To represent a simulation close to realistic conditions, boundary conditions are given on both sides of the structure with fixed and pinned properties on the opposite side. Figure 10 illustrates how boundary conditions are applied to a double-bottom structure. Temperature loading is carried out at the temperature-type boundary conditions on the top plate to determine the maximum temperature given to the structure. Also, the application of temperature is given an amplitude to describe the fire phenomenon, which starts from environmental temperature, reaches the maximum fire temperature, and then cools until it returns to its initial temperature. The simulation was carried out for 600 s with maximum temperature variations to obtain differences in structural damage at each temperature variation. However, the initial temperature is uniform, 27°C or equivalent to the ambient temperature. Figure 11 illustrates how the temperature in the simulation is applied.

Boundary conditions configuration.

Temperature history.
4.4.3 Simulation scenarios
The study involved formulating several comprehensive scenarios to simulate fires under different conditions by combining various parameters, such as plate thickness, material type, and temperature, as described in the model specifications. This approach explains the inherent differences in the results obtained from changes in these three main parameters. A detailed description of the scenarios used in the model is presented in Table 3, which provides a comprehensive framework for investigating fire-related phenomena and their implications for structural response.
Simulation scenarios
| Notation | Material | Temperature (°C) | Thickness (mm) |
|---|---|---|---|
| Model 1 | AH 32 Steel | 50 | 8 |
| Model 2 | AH 32 Steel | 150 | 8 |
| Model 3 | AH 32 Steel | 250 | 8 |
| Model 4 | AH 32 Steel | 350 | 8 |
| Model 5 | AH 32 Steel | 450 | 8 |
| Model 6 | AH 32 Steel | 50 | 9 |
| Model 7 | AH 32 Steel | 150 | 9 |
| Model 8 | AH 32 Steel | 250 | 9 |
| Model 9 | AH 32 Steel | 350 | 9 |
| Model 10 | AH 32 Steel | 450 | 9 |
| Model 11 | AH 32 Steel | 50 | 10 |
| Model 12 | AH 32 Steel | 150 | 10 |
| Model 13 | AH 32 Steel | 250 | 10 |
| Model 14 | AH 32 Steel | 350 | 10 |
| Model 15 | AH 32 Steel | 450 | 10 |
| Model 16 | AH 32 Steel | 50 | 11 |
| Model 17 | AH 32 Steel | 150 | 11 |
| Model 18 | AH 32 Steel | 250 | 11 |
| Model 19 | AH 32 Steel | 350 | 11 |
| Model 20 | AH 32 Steel | 450 | 11 |
| Model 21 | AH 32 Steel | 50 | 12 |
| Model 22 | AH 32 Steel | 150 | 12 |
| Model 23 | AH 32 Steel | 250 | 12 |
| Model 24 | AH 32 Steel | 350 | 12 |
| Model 25 | AH 32 Steel | 450 | 12 |
| Model 26 | AH 36 Steel | 50 | 8 |
| Model 27 | AH 36 Steel | 150 | 8 |
| Model 28 | AH 36 Steel | 250 | 8 |
| Model 29 | AH 36 Steel | 350 | 8 |
| Model 30 | AH 36 Steel | 450 | 8 |
| Model 31 | AH 36 Steel | 50 | 9 |
| Model 32 | AH 36 Steel | 150 | 9 |
| Model 33 | AH 36 Steel | 250 | 9 |
| Model 34 | AH 36 Steel | 350 | 9 |
| Model 35 | AH 36 Steel | 450 | 9 |
| Model 36 | AH 36 Steel | 50 | 10 |
| Model 37 | AH 36 Steel | 150 | 10 |
| Model 38 | AH 36 Steel | 250 | 10 |
| Model 39 | AH 36 Steel | 350 | 10 |
| Model 40 | AH 36 Steel | 450 | 10 |
| Model 41 | AH 36 Steel | 50 | 11 |
| Model 42 | AH 36 Steel | 150 | 11 |
| Model 43 | AH 36 Steel | 250 | 11 |
| Model 44 | AH 36 Steel | 350 | 11 |
| Model 45 | AH 36 Steel | 450 | 11 |
| Model 46 | AH 36 Steel | 50 | 12 |
| Model 47 | AH 36 Steel | 150 | 12 |
| Model 48 | AH 36 Steel | 250 | 12 |
| Model 49 | AH 36 Steel | 350 | 12 |
| Model 50 | AH 36 Steel | 450 | 12 |
| Model 51 | DH 32 Steel | 50 | 8 |
| Model 52 | DH 32 Steel | 150 | 8 |
| Model 53 | DH 32 Steel | 250 | 8 |
| Model 54 | DH 32 Steel | 350 | 8 |
| Model 55 | DH 32 Steel | 450 | 8 |
| Model 56 | DH 32 Steel | 50 | 9 |
| Model 57 | DH 32 Steel | 150 | 9 |
| Model 58 | DH 32 Steel | 250 | 9 |
| Model 59 | DH 32 Steel | 350 | 9 |
| Model 60 | DH 32 Steel | 450 | 9 |
| Model 61 | DH 32 Steel | 50 | 10 |
| Model 62 | DH 32 Steel | 150 | 10 |
| Model 63 | DH 32 Steel | 250 | 10 |
| Model 64 | DH 32 Steel | 350 | 10 |
| Model 65 | DH 32 Steel | 450 | 10 |
| Model 66 | DH 32 Steel | 50 | 11 |
| Model 67 | DH 32 Steel | 150 | 11 |
| Model 68 | DH 32 Steel | 250 | 11 |
| Model 69 | DH 32 Steel | 350 | 11 |
| Model 70 | DH 32 Steel | 450 | 11 |
| Model 71 | DH 32 Steel | 50 | 12 |
| Model 72 | DH 32 Steel | 150 | 12 |
| Model 73 | DH 32 Steel | 250 | 12 |
| Model 74 | DH 32 Steel | 350 | 12 |
| Model 75 | DH 32 Steel | 450 | 12 |
| Model 76 | DH 36 Steel | 50 | 8 |
| Model 77 | DH 36 Steel | 150 | 8 |
| Model 78 | DH 36 Steel | 250 | 8 |
| Model 79 | DH 36 Steel | 350 | 8 |
| Model 80 | DH 36 Steel | 450 | 8 |
| Model 81 | DH 36 Steel | 50 | 9 |
| Model 82 | DH 36 Steel | 150 | 9 |
| Model 83 | DH 36 Steel | 250 | 9 |
| Model 84 | DH 36 Steel | 350 | 9 |
| Model 85 | DH 36 Steel | 450 | 9 |
| Model 86 | DH 36 Steel | 50 | 10 |
| Model 87 | DH 36 Steel | 150 | 10 |
| Model 88 | DH 36 Steel | 250 | 10 |
| Model 89 | DH 36 Steel | 350 | 10 |
| Model 90 | DH 36 Steel | 450 | 10 |
| Model 91 | DH 36 Steel | 50 | 11 |
| Model 92 | DH 36 Steel | 150 | 11 |
| Model 93 | DH 36 Steel | 250 | 11 |
| Model 94 | DH 36 Steel | 350 | 11 |
| Model 95 | DH 36 Steel | 450 | 11 |
| Model 96 | DH 36 Steel | 50 | 12 |
| Model 97 | DH 36 Steel | 150 | 12 |
| Model 98 | DH 36 Steel | 250 | 12 |
| Model 99 | DH 36 Steel | 350 | 12 |
| Model 100 | DH 36 Steel | 450 | 12 |
| Model 101 | Medium carbon steel | 50 | 8 |
| Model 102 | Medium carbon steel | 150 | 8 |
| Model 103 | Medium carbon steel | 250 | 8 |
| Model 104 | Medium carbon steel | 350 | 8 |
| Model 105 | Medium carbon steel | 450 | 8 |
| Model 106 | Medium carbon steel | 50 | 9 |
| Model 107 | Medium carbon steel | 150 | 9 |
| Model 108 | Medium carbon steel | 250 | 9 |
| Model 109 | Medium carbon steel | 350 | 9 |
| Model 110 | Medium carbon steel | 450 | 9 |
| Model 111 | Medium carbon steel | 50 | 10 |
| Model 112 | Medium carbon steel | 150 | 10 |
| Model 113 | Medium carbon steel | 250 | 10 |
| Model 114 | Medium carbon steel | 350 | 10 |
| Model 115 | Medium carbon steel | 450 | 10 |
| Model 116 | Medium carbon steel | 50 | 11 |
| Model 117 | Medium carbon steel | 150 | 11 |
| Model 118 | Medium carbon steel | 250 | 11 |
| Model 119 | Medium carbon steel | 350 | 11 |
| Model 120 | Medium carbon steel | 450 | 11 |
| Model 121 | Medium carbon steel | 50 | 12 |
| Model 122 | Medium carbon steel | 150 | 12 |
| Model 123 | Medium carbon steel | 250 | 12 |
| Model 124 | Medium carbon steel | 350 | 12 |
| Model 125 | Medium carbon steel | 450 | 12 |
5 Results and discussion
The following analysis and discussion focus on the results of fire simulations in double-bottom structures. This study has applied several variations to evaluate factors that influence simulation results, including material variations, temperature variations, and plate thickness variations. In the end, the analysis of all simulations was evaluated using the multi-attribute decision-making (MADM) and Sensitivity Analysis methods.
5.1 Material variations
In the simulations that have been carried out, material differences are one of the factors causing differences in simulation results in fire conditions. This is due to the different properties of each material used. Simulations were carried out to determine the material difference by providing a maximum temperature of 350°C and a plate thickness of 10 mm. The results generally show differences in the Von Mises stress and strain contours. In the AH 36 steel material, it was found that the Von Mises stress distribution was wider when compared to the AH 32 steel material. The same thing happens to the strain contours produced in the simulation of these two materials, as shown in Figure 12.

Von Mises stress and strain contour on material variations: (a) AH 32 steel and (b) AH 36 steel.
In the examination of materials, it was found that for DH 36 steel material, the distribution of Von Mises stress and strains exhibits a more significant magnitude when compared with DH 32 steel across three distinct time frames. This significance disparity underscores these materials’ differing behaviors under the given conditions. The simulation contour results, exemplified in Figure 13, visually depict this contrast. Moreover, among all the materials scrutinized in this study, it was observed that medium carbon steel material showcases the least extensive strain distribution [19]. This outcome can be attributed to its possession of the highest elasticity value, as demonstrated in Figure 14.

Von Mises stress and strain contour on material variations: (a) DH 32 steel and (b) DH 36 steel.

Von Mises stress and strain contour on medium carbon steel material.
We analyzed the results of the Von Mises stress and strain contours and the displacement in the structure. The medium carbon steel material had the smallest displacement value. As previously mentioned, this material is more elastic than the other four materials, which tend to have the same displacement results. The displacement graph for material variations is depicted in Figure 15.

Displacement graph for material variations.
5.2 Temperature variations
This simulation measured temperature variations to determine the double-bottom structure’s response when given various maximum temperatures. The temperatures applied start from 50, 150, 250, 350, and 450°C using one type of material, AH 36 steel, with a plate thickness of 11 mm. Simulations using 50 and 150°C variations produced different Von Mises stress contours. However, the strain contours obtained are still the same because the temperature is not too high. An illustration of the Von Mises stress contour and strain at varying temperatures of 50 and 150°C is shown in Figure 16.

Von Mises stress and strain contour at temperature variations: (a) 50°C and (b) 150°C.
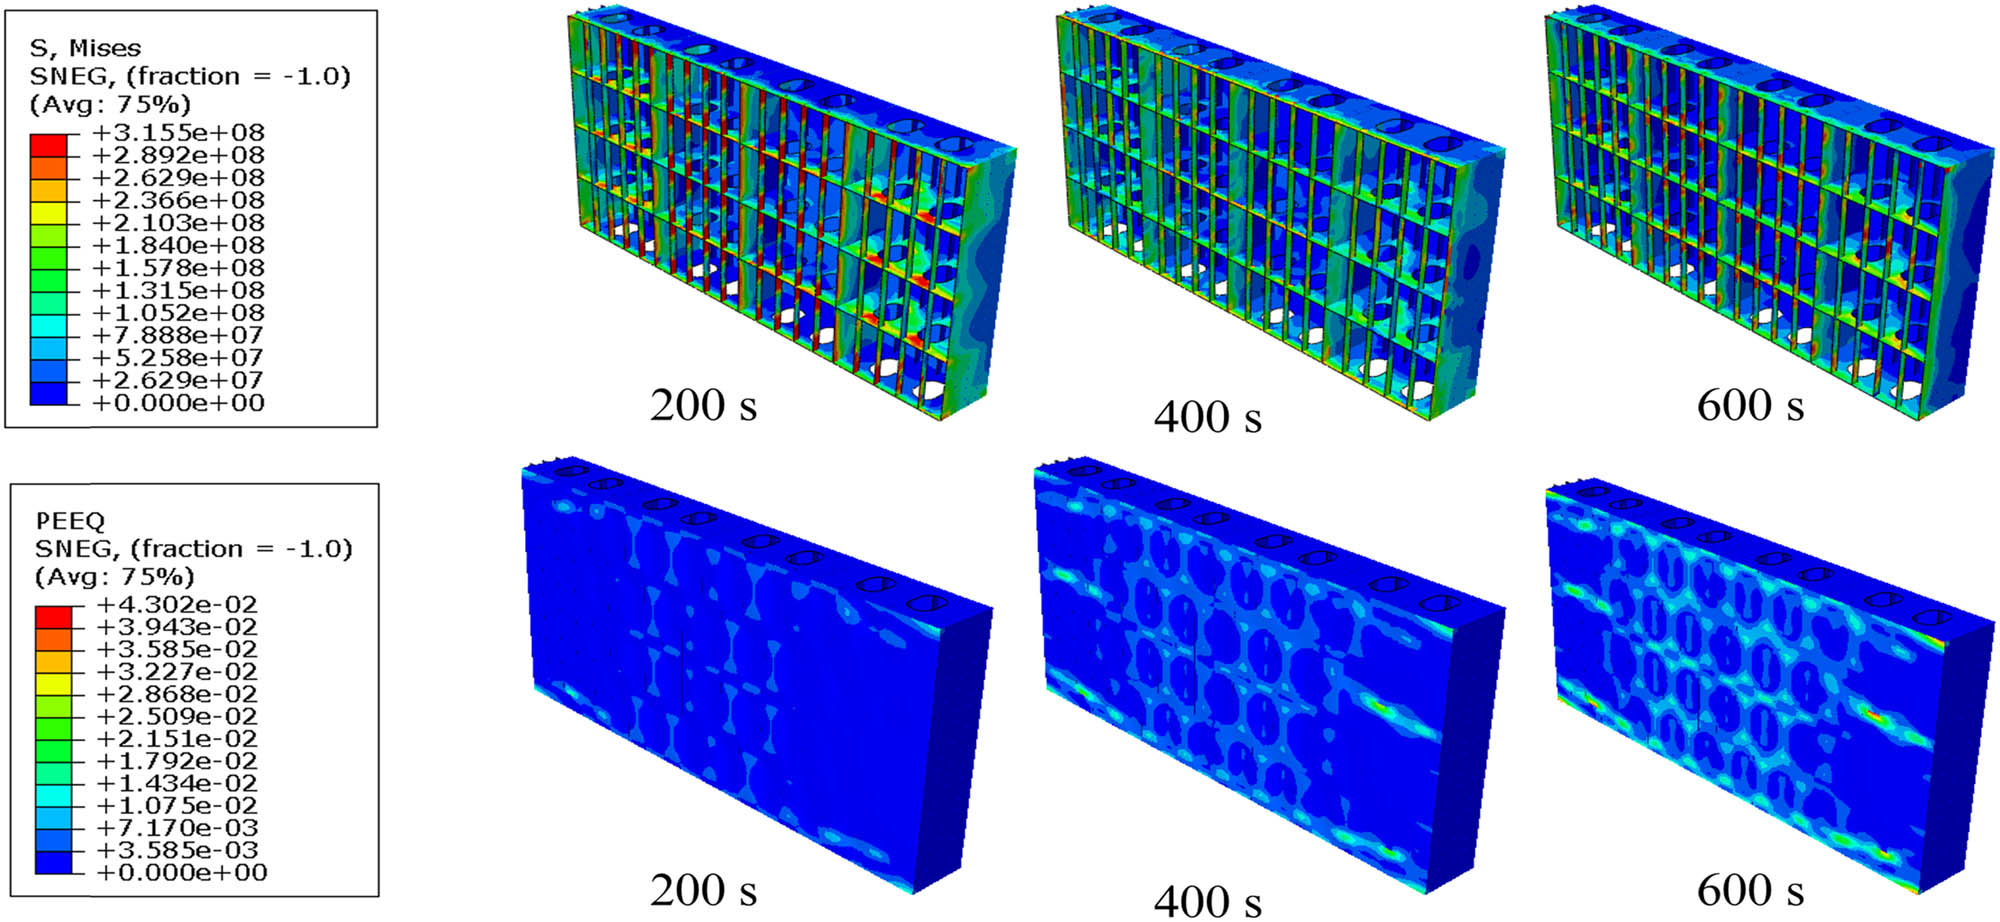
Subsequently, as the temperature escalates to 250 and 350°C, it is evident that the contours illustrating the Von Mises stress and strain distribution undergo a broadening phenomenon. This expansion in contour width can be attributed to the alterations in material properties that the double-bottom structure undergoes with increasing temperature. Figure 17 vividly illustrates these changes in the Von Mises stress and strain contours, depicting scenarios where the structure is subjected to maximum temperatures of 250 and 350°C, respectively.

Von Mises stress and strain contour at temperature variations: (a) 250°C and (b) 350°C.
Figure 18 shows the material’s response when given a maximum temperature of up to 450°C, where the distribution of Von Mises stress and the resulting strains become increasingly widespread. It explains that the higher the temperature exposed to the structure’s surface, the greater the distribution of Von Mises stress, and the resulting strains will be due to changes in material properties as the temperature increases. The same thing is true with displacement: the higher the temperature, the greater the resulting displacement value, as depicted in the graph in Figure 19.

Von Mises stress and strain contour at a temperature of 450°C.

Displacement graph under temperature variations.
5.3 Plate thickness
Plate thickness is one factor that causes differences in the response of double-bottom structures. We use a variety of plate thicknesses from 8, 9, 10, 11, and 12 mm to obtain differences in each given plate thickness. This simulation was carried out with one type of material, AH 32 steel, with fire conditions at a maximum temperature of 250°C. The results of the Von Mises stress and strain contours in simulations with plate thicknesses of 8 and 9 mm are shown in Figure 20.

Stress and strain contour at varying plate thicknesses: (a) 8 mm and (b) 9 mm.
From this illustration, it is known that at a plate thickness of 8 mm, the Von Mises stress distribution is smaller than in a structure with a plate thickness of 9 mm. It occurs because the temperature difference between the surface exposed to heat and the inside of the structure is quite large, resulting in an exceptionally significant Von Mises stress gradient [20]. The same happens with plate thicknesses of 10, 11, and 12 mm, as shown in Figures 21 and 22. It also applies to the strains that occur in the material. Because of the significant temperature difference, the deformation tends to be high, causing contours that make the resulting strain more significant.

Stress and strain contour at varying plate thicknesses: (a) 10 mm and (b) 11 mm.
Von Mises stress and strain contour at plate thickness variations of 12 mm.
The displacement results for the five models of structural plate thickness are similar. However, in structures 12 mm or the thickest, it appears that displacement occurs more slowly when compared to structures with a smaller thickness. It is caused by the longer time required for material with a plate thickness of 12 mm to propagate heat, so the transfer speed will be slower, as shown in the graph in Figure 23. However, thicker structures tend to have smaller maximum displacement values compared to other structures. which are thinner. It proves that a thicker structure is more robust when facing heat to minimize displacement.

Displacement graph for varying plate thickness.
5.4 MADM
When confronted with a fire scenario, selecting the most optimal model can be effectively addressed through the MADM method. This systematic approach entails several stages, commencing with the initial phase of establishing a priority order and assigning corresponding scores to each available option. Prior to delineating the priority order, it is imperative to furnish a configuration code tailored for the simulation, as detailed in Table 4. This preparatory step lays the groundwork for the subsequent evaluation process, ensuring a systematic and comprehensive assessment of the available models.
Simulation configuration code
| Material | Code | Temperature (°C) | Code | Thickness (mm) | Code |
|---|---|---|---|---|---|
| AH 32 Steel | M1 | 50 | T1 | 8 | T1 |
| AH 36 Steel | M2 | 150 | T2 | 9 | t2 |
| DH 32 Steel | M3 | 250 | T3 | 10 | t3 |
| DH 36 Steel | M4 | 350 | T4 | 11 | t4 |
| Medium carbon steel | M5 | 450 | T5 | 12 | t5 |
Following the configuration process, the next step involves compiling all test result values into a comprehensive table organized according to the predetermined parameters. These values represent the data obtained at the concluding stage of each model’s exposure to a fire phenomenon. These data are presented in Table 5, providing a comprehensive overview of the results obtained from all models carried out.
Parameter values for each MADM criterion
| Material | Temperature | Thickness | Notation | Von Mises stress | Strain | Displacement |
|---|---|---|---|---|---|---|
| C1 | C2 | C3 | ||||
| M1 | T1 | t1 | Model 1 | 2.564 × 10+07 | 0.000 × 10+00 | 2.185 × 10−05 |
| M1 | T2 | t1 | Model 2 | 1.949 × 10+08 | 3.272 × 10−03 | 4.175 × 10−03 |
| M1 | T3 | t1 | Model 3 | 2.992 × 10+08 | 1.040 × 10−02 | 7.257 × 10−03 |
| M1 | T4 | t1 | Model 4 | 2.979 × 10+08 | 3.377 × 10−03 | 1.525 × 10−02 |
| M1 | T1 | t2 | Model 5 | 1.041 × 10+07 | 0.000 × 10+00 | 2.209 × 10−05 |
| M1 | T2 | t2 | Model 6 | 1.818 × 10+08 | 3.553 × 10−03 | 4.586 × 10−03 |
| M1 | T3 | t2 | Model 7 | 2.991 × 10+08 | 1.122 × 10−02 | 7.846 × 10−03 |
| M1 | T4 | t2 | Model 8 | 2.902 × 10+08 | 2.172 × 10−02 | 9.599 × 10−03 |
| M1 | T5 | t2 | Model 9 | 2.819 × 10+08 | 1.321 × 10−02 | 2.819 × 10−02 |
| M1 | T1 | t3 | Model 10 | 2.629 × 10+07 | 0.000 × 10+00 | 1.509 × 10−05 |
| M1 | T2 | t3 | Model 11 | 1.186 × 10+08 | 4.773 × 10−03 | 5.020 × 10−03 |
| M1 | T3 | t3 | Model 12 | 2.990 × 10+08 | 1.182 × 10−02 | 7.834 × 10−03 |
| M1 | T4 | t3 | Model 13 | 2.938 × 10+08 | 1.827 × 10−02 | 9.018 × 10−03 |
| M1 | T5 | t3 | Model 14 | 2.831 × 10+08 | 2.078 × 10−02 | 9.108 × 10−03 |
| M1 | T1 | t4 | Model 15 | 2.531 × 10+07 | 0.000 × 10+00 | 1.243 × 10−05 |
| M1 | T2 | t4 | Model 16 | 1.259 × 10+08 | 4.904 × 10−03 | 4.517 × 10−03 |
| M1 | T3 | t4 | Model 17 | 2.989 × 10+08 | 1.083 × 10−02 | 7.348 × 10−03 |
| M1 | T4 | t4 | Model 18 | 2.930 × 10+08 | 1.735 × 10−02 | 8.919 × 10−03 |
| M1 | T5 | t4 | Model 19 | 2.868 × 10+08 | 1.422 × 10−02 | 8.628 × 10−03 |
| M1 | T1 | t5 | Model 20 | 2.698 × 10+07 | 0.000 × 10+00 | 1.250 × 10−05 |
| M1 | T2 | t5 | Model 21 | 8.557 × 10+07 | 5.131 × 10−03 | 5.193 × 10−03 |
| M1 | T3 | t5 | Model 22 | 2.971 × 10+08 | 1.444 × 10−02 | 7.416 × 10−03 |
| M1 | T4 | t5 | Model 23 | 2.925 × 10+08 | 1.763 × 10−02 | 8.155 × 10−03 |
| M1 | T5 | t5 | Model 24 | 2.862 × 10+08 | 2.430 × 10−02 | 9.139 × 10−03 |
| M2 | T1 | t1 | Model 25 | 2.324 × 10+07 | 0.000 × 10+00 | 1.418 × 10−05 |
| M2 | T2 | t1 | Model 26 | 1.660 × 10+08 | 3.359 × 10−03 | 3.684 × 10−03 |
| M2 | T3 | t1 | Model 27 | 3.206 × 10+08 | 2.900 × 10−03 | 1.516 × 10−02 |
| M2 | T1 | t2 | Model 28 | 2.312 × 10+07 | 0.000 × 10+00 | 1.838 × 10−05 |
| M2 | T2 | t2 | Model 29 | 7.042 × 10+07 | 3.447 × 10−03 | 3.129 × 10−03 |
| M2 | T3 | t2 | Model 30 | 3.261 × 10+08 | 9.976 × 10−03 | 1.094 × 10−04 |
| M2 | T4 | t2 | Model 31 | 3.160 × 10+08 | 1.644 × 10−02 | 9.417 × 10−03 |
| M2 | T5 | t2 | Model 32 | 6.554 × 10+04 | 1.563 × 10−02 | 2.645 × 10−02 |
| M2 | T1 | t3 | Model 33 | 2.300 × 10+07 | 0.000 × 10+00 | 2.271 × 10−05 |
| M2 | T2 | t3 | Model 34 | 1.735 × 10+08 | 3.516 × 10−03 | 3.819 × 10−03 |
| M2 | T3 | t3 | Model 35 | 3.231 × 10+08 | 1.167 × 10−02 | 9.992 × 10−03 |
| M2 | T4 | t3 | Model 36 | 3.189 × 10+08 | 1.238 × 10−02 | 1.126 × 10−02 |
| M2 | T5 | t3 | Model 37 | 3.083 × 10+08 | 1.964 × 10−02 | 9.452 × 10−03 |
| M2 | T1 | t4 | Model 38 | 2.251 × 10+07 | 0.000 × 10+00 | 2.024 × 10−05 |
| M2 | T2 | t4 | Model 39 | 7.580 × 10+07 | 3.619 × 10−03 | 3.981 × 10−03 |
| M2 | T3 | t4 | Model 40 | 3.099 × 10+08 | 1.222 × 10−02 | 7.390 × 10−03 |
| M2 | T4 | t4 | Model 41 | 3.194 × 10+08 | 1.482 × 10−02 | 8.855 × 10−03 |
| M2 | T5 | t4 | Model 42 | 3.124 × 10+08 | 2.289 × 10−02 | 9.850 × 10−03 |
| M2 | T1 | t5 | Model 43 | 9.894 × 10+06 | 0.000 × 10+00 | 1.968 × 10−05 |
| M2 | T2 | t5 | Model 44 | 7.602 × 10+07 | 3.985 × 10−03 | 3.787 × 10−03 |
| M2 | T3 | t5 | Model 45 | 3.254 × 10+08 | 1.070 × 10−02 | 7.525 × 10−03 |
| M2 | T4 | t5 | Model 46 | 3.158 × 10+08 | 2.174 × 10−02 | 8.407 × 10−03 |
| M2 | T5 | t5 | Model 47 | 3.119 × 10+08 | 3.537 × 10−02 | 9.378 × 10−03 |
| M3 | T1 | t1 | Model 48 | 2.754 × 10+07 | 0.000 × 10+00 | 2.055 × 10−05 |
| M3 | T2 | t1 | Model 49 | 8.032 × 10+07 | 4.848 × 10−03 | 5.029 × 10−03 |
| M3 | T3 | t1 | Model 50 | 2.968 × 10+08 | 3.256 × 10−03 | 1.452 × 10−02 |
| M3 | T1 | t2 | Model 51 | 2.694 × 10+07 | 0.000 × 10+00 | 8.003 × 10−06 |
| M3 | T2 | t2 | Model 52 | 9.624 × 10+07 | 5.207 × 10−03 | 4.800 × 10−03 |
| M3 | T3 | t2 | Model 53 | 2.993 × 10+08 | 1.048 × 10−02 | 7.851 × 10−03 |
| M3 | T1 | t3 | Model 54 | 2.467 × 10+07 | 0.000 × 10+00 | 1.341 × 10−04 |
| M3 | T2 | t3 | Model 55 | 3.393 × 10+08 | 1.712 × 10−02 | 8.545 × 10−03 |
| M3 | T3 | t3 | Model 56 | 2.879 × 10+08 | 1.174 × 10−02 | 7.750 × 10−03 |
| M3 | T4 | t3 | Model 57 | 2.926 × 10+08 | 1.002 × 10−02 | 8.927 × 10−03 |
| M3 | T5 | t3 | Model 58 | 2.882 × 10+08 | 3.033 × 10−02 | 8.817 × 10−03 |
| M3 | T1 | t4 | Model 59 | 2.675 × 10+07 | 0.000 × 10+00 | 4.415 × 10+08 |
| M3 | T2 | t4 | Model 60 | 1.027 × 10+08 | 5.332 × 10−03 | 5.141 × 10−03 |
| M3 | T3 | t4 | Model 61 | 2.991 × 10+08 | 1.309 × 10−02 | 8.084 × 10−03 |
| M3 | T4 | t4 | Model 62 | 2.925 × 10+08 | 1.770 × 10−02 | 8.735 × 10−03 |
| M3 | T5 | t4 | Model 63 | 2.862 × 10+08 | 2.890 × 10−02 | 9.173 × 10−03 |
| M3 | T1 | t5 | Model 64 | 2.663 × 10+07 | 0.000 × 10+00 | 1.437 × 10−05 |
| M3 | T2 | t5 | Model 65 | 7.028 × 10+07 | 5.131 × 10−03 | 5.193 × 10−03 |
| M3 | T3 | t5 | Model 66 | 2.970 × 10+08 | 1.614 × 10−02 | 7.862 × 10−03 |
| M3 | T4 | t5 | Model 67 | 2.899 × 10+08 | 2.556 × 10−02 | 9.446 × 10−03 |
| M3 | T5 | t5 | Model 68 | 2.827 × 10+08 | 2.430 × 10−02 | 9.491 × 10−03 |
| M4 | T1 | t1 | Model 69 | 2.751 × 10+07 | 0.000 × 10+00 | 1.978 × 10−05 |
| M4 | T1 | t2 | Model 70 | 2.904 × 10+07 | 0.000 × 10+00 | 2.345 × 10−05 |
| M4 | T2 | t2 | Model 71 | 2.681 × 10+08 | 5.037 × 10−03 | 5.385 × 10−03 |
| M4 | T3 | t2 | Model 72 | 3.312 × 10+08 | 1.051 × 10−02 | 9.023 × 10−03 |
| M4 | T4 | t2 | Model 73 | 3.259 × 10+08 | 1.884 × 10−02 | 2.772 × 10−04 |
| M4 | T5 | t2 | Model 74 | 2.906 × 10+08 | 1.050 × 10−02 | 2.602 × 10−02 |
| M4 | T1 | t3 | Model 75 | 1.453 × 10+07 | 0.000 × 10+00 | 2.400 × 10−05 |
| M4 | T2 | t3 | Model 76 | 1.859 × 10+08 | 5.630 × 10−03 | 5.695 × 10−03 |
| M4 | T3 | t3 | Model 77 | 3.321 × 10+08 | 1.177 × 10−02 | 8.901 × 10−03 |
| M4 | T4 | t3 | Model 78 | 3.250 × 10+08 | 2.769 × 10−02 | 8.851 × 10−03 |
| M4 | T5 | t3 | Model 79 | 3.176 × 10+08 | 2.662 × 10−02 | 9.728 × 10−03 |
| M4 | T1 | t4 | Model 80 | 1.381 × 10+07 | 0.000 × 10+00 | 2.614 × 10−05 |
| M4 | T2 | t4 | Model 81 | 1.165 × 10+08 | 7.142 × 10−03 | 5.482 × 10−03 |
| M4 | T3 | t4 | Model 82 | 3.311 × 10+08 | 1.861 × 10−02 | 8.507 × 10−03 |
| M4 | T4 | t4 | Model 83 | 3.245 × 10+08 | 1.959 × 10−02 | 9.311 × 10−03 |
| M4 | T5 | t4 | Model 84 | 3.161 × 10+08 | 3.694 × 10−02 | 1.367 × 10−02 |
| M4 | T1 | t5 | Model 85 | 1.482 × 10+07 | 0.000 × 10+00 | 2.755 × 10−05 |
| M4 | T2 | t5 | Model 86 | 1.037 × 10+08 | 6.923 × 10−03 | 5.542 × 10−03 |
| M4 | T3 | t5 | Model 87 | 3.309 × 10+08 | 1.642 × 10−02 | 8.815 × 10−03 |
| M4 | T4 | t5 | Model 88 | 3.235 × 10+08 | 2.908 × 10−02 | 9.073 × 10−03 |
| M4 | T5 | t5 | Model 89 | 3.160 × 10+08 | 2.744 × 10−02 | 9.793 × 10−03 |
| M5 | T1 | t1 | Model 90 | 1.805 × 10+07 | 0.000 × 10+00 | 1.677 × 10−05 |
| M5 | T2 | t1 | Model 91 | 1.188 × 10+08 | 1.287 × 10−03 | 5.851 × 10−06 |
| M5 | T3 | t1 | Model 92 | 3.886 × 10+08 | 2.710 × 10−03 | 1.535 × 10−02 |
| M5 | T1 | t2 | Model 93 | 1.795 × 10+07 | 0.000 × 10+00 | 1.447 × 10−05 |
| M5 | T2 | t2 | Model 94 | 1.016 × 10+08 | 1.554 × 10−03 | 1.168 × 10−03 |
| M5 | T3 | t2 | Model 95 | 3.910 × 10+08 | 4.951 × 10−03 | 1.786 × 10−02 |
| M5 | T1 | t3 | Model 96 | 1.785 × 10+07 | 0.000 × 10+00 | 5.506 × 10+08 |
| M5 | T2 | t3 | Model 97 | 9.659 × 10+07 | 1.914 × 10−03 | 1.208 × 10−03 |
| M5 | T3 | t3 | Model 98 | 1.066 × 10+08 | 6.013 × 10−03 | 6.700 × 10−03 |
| M5 | T4 | t3 | Model 99 | 3.904 × 10+08 | 1.177 × 10−02 | 8.788 × 10−03 |
| M5 | T5 | t3 | Model 100 | 3.790 × 10+08 | 2.572 × 10−02 | 1.255 × 10−02 |
| M5 | T1 | t4 | Model 101 | 1.745 × 10+07 | 0.000 × 10+00 | 1.795 × 10−05 |
| M5 | T2 | t4 | Model 102 | 5.467 × 10+07 | 1.745 × 10−03 | 1.296 × 10−03 |
| M5 | T3 | t4 | Model 103 | 2.160 × 10+08 | 8.602 × 10−03 | 6.101 × 10−03 |
| M5 | T4 | t4 | Model 104 | 3.830 × 10+08 | 1.316 × 10−02 | 9.413 × 10−03 |
| M5 | T5 | t4 | Model 105 | 3.788 × 10+08 | 2.067 × 10−02 | 1.738 × 10−04 |
| M5 | T1 | t5 | Model 106 | 1.770 × 10+07 | 0.000 × 10+00 | 1.882 × 10−05 |
| M5 | T2 | t5 | Model 107 | 5.323 × 10+07 | 1.836 × 10−03 | 1.385 × 10−03 |
| M5 | T3 | t5 | Model 108 | 2.363 × 10+08 | 7.486 × 10−03 | 3.722 × 10−04 |
| M5 | T4 | t5 | Model 109 | 3.902 × 10+08 | 1.651 × 10−02 | 8.983 × 10−03 |
| M5 | T5 | t5 | Model 110 | 3.784 × 10+08 | 1.876 × 10−02 | 1.032 × 10−02 |
Then, normalization is carried out to avoid data anomalies. The most minor data are taken for criteria C1 (Von Mises Stress), C2 (Strain), and C3 (Displacement). The smaller these three values, the better the model’s capabilities when dealing with fire phenomena. Normalization results for all models are shown in Table 6. After normalizing the data, MADM assessment calculations can be carried out. The model with the highest score is considered the best model. Scores can be seen in Table 7.
MADM data normalization
| Notation | Von Mises stress | Strain | Displacement |
|---|---|---|---|
| C1 | C2 | C3 | |
| Model 1 | 1.680 × 10+12 | 0.000 × 10+00 | 1.279 × 10⁻¹⁰ |
| Model 2 | 1.277 × 10+13 | 4.212 × 10−06 | 2.443 × 10−08 |
| Model 3 | 1.961 × 10+13 | 1.339 × 10−05 | 4.246 × 10−08 |
| Model 4 | 1.952 × 10+13 | 4.348 × 10−06 | 8.921 × 10−08 |
| Model 5 | 6.824 × 10+11 | 0.000 × 10+00 | 1.293 × 10⁻¹⁰ |
| Model 6 | 1.192 × 10+13 | 4.575 × 10−06 | 2.683 × 10−08 |
| Model 7 | 1.960 × 10+13 | 1.445 × 10−05 | 4.591 × 10−08 |
| Model 8 | 1.902 × 10+13 | 2.796 × 10−05 | 5.617 × 10−08 |
| Model 9 | 1.847 × 10+13 | 1.701 × 10−05 | 1.649 × 10−07 |
| Model 10 | 1.723 × 10+12 | 0.000 × 10+00 | 8.830 × 10⁻¹¹ |
| Model 11 | 7.772 × 10+12 | 6.146 × 10−06 | 2.937 × 10−08 |
| Model 12 | 1.960 × 10+13 | 1.521 × 10−05 | 4.584 × 10−08 |
| Model 13 | 1.926 × 10+13 | 2.353 × 10−05 | 5.277 × 10−08 |
| Model 14 | 1.855 × 10+13 | 2.676 × 10−05 | 5.330 × 10−08 |
| Model 15 | 1.659 × 10+12 | 0.000 × 10+00 | 7.273 × 10⁻¹¹ |
| Model 16 | 8.249 × 10+12 | 6.313 × 10−06 | 2.643 × 10−08 |
| Model 17 | 1.959 × 10+13 | 1.394 × 10−05 | 4.300 × 10−08 |
| Model 18 | 1.920 × 10+13 | 2.234 × 10−05 | 5.219 × 10−08 |
| Model 19 | 1.879 × 10+13 | 1.831 × 10−05 | 5.049 × 10−08 |
| Model 20 | 1.768 × 10+12 | 0.000 × 10+00 | 7.317 × 10⁻¹¹ |
| Model 21 | 5.608 × 10+12 | 6.606 × 10−06 | 3.039 × 10−08 |
| Model 22 | 1.947 × 10+13 | 1.859 × 10−05 | 4.339 × 10−08 |
| Model 23 | 1.917 × 10+13 | 2.270 × 10−05 | 4.772 × 10−08 |
| Model 24 | 1.875 × 10+13 | 3.128 × 10−05 | 5.348 × 10−08 |
| Model 25 | 1.523 × 10+12 | 0.000 × 10+00 | 8.299 × 10⁻¹¹ |
| Model 26 | 1.088 × 10+13 | 4.325 × 10−06 | 2.156 × 10−08 |
| Model 27 | 2.101 × 10+13 | 3.733 × 10−06 | 8.868 × 10−08 |
| Model 28 | 1.515 × 10+12 | 0.000 × 10+00 | 1.076 × 10⁻¹⁰ |
| Model 29 | 4.615 × 10+12 | 4.438 × 10−06 | 1.831 × 10−08 |
| Model 30 | 2.137 × 10+13 | 1.284 × 10−05 | 6.399 × 10⁻¹⁰ |
| Model 31 | 2.071 × 10+13 | 2.117 × 10−05 | 5.510 × 10−08 |
| Model 32 | 4.295 × 10+09 | 2.013 × 10−05 | 1.548 × 10−07 |
| Model 33 | 1.507 × 10+12 | 0.000 × 10+00 | 1.329 × 10⁻¹⁰ |
| Model 34 | 1.137 × 10+13 | 4.526 × 10−06 | 2.235 × 10−08 |
| Model 35 | 2.117 × 10+13 | 1.503 × 10−05 | 5.847 × 10−08 |
| Model 36 | 2.090 × 10+13 | 1.594 × 10−05 | 6.589 × 10−08 |
| Model 37 | 2.020 × 10+13 | 2.529 × 10−05 | 5.531 × 10−08 |
| Model 38 | 1.475 × 10+12 | 0.000 × 10+00 | 1.184 × 10⁻¹⁰ |
| Model 39 | 4.968 × 10+12 | 4.660 × 10−06 | 2.330 × 10−08 |
| Model 40 | 2.031 × 10+13 | 1.573 × 10−05 | 4.324 × 10−08 |
| Model 41 | 2.093 × 10+13 | 1.908 × 10−05 | 5.181 × 10−08 |
| Model 42 | 2.047 × 10+13 | 2.947 × 10−05 | 5.764 × 10−08 |
| Model 43 | 6.484 × 10+11 | 0.000 × 10+00 | 1.152 × 10⁻¹⁰ |
| Model 44 | 4.982 × 10+12 | 5.131 × 10−06 | 2.216 × 10−08 |
| Model 45 | 2.132 × 10+13 | 1.378 × 10−05 | 4.403 × 10−08 |
| Model 46 | 2.069 × 10+13 | 2.799 × 10−05 | 4.919 × 10−08 |
| Model 47 | 2.044 × 10+13 | 4.554 × 10−05 | 5.488 × 10−08 |
| Model 48 | 1.805 × 10+12 | 0.000 × 10+00 | 1.202 × 10⁻¹⁰ |
| Model 49 | 5.264 × 10+12 | 6.241 × 10−06 | 2.942 × 10−08 |
| Model 50 | 1.945 × 10+13 | 4.192 × 10−06 | 8.495 × 10−08 |
| Model 51 | 1.765 × 10+12 | 0.000 × 10+00 | 4.683 × 10⁻¹¹ |
| Model 52 | 6.307 × 10+12 | 6.704 × 10−06 | 2.808 × 10−08 |
| Model 53 | 1.961 × 10+13 | 1.349 × 10−05 | 4.594 × 10−08 |
| Model 54 | 1.617 × 10+12 | 0.000 × 10+00 | 7.846 × 10⁻¹⁰ |
| Model 55 | 2.224 × 10+13 | 2.204 × 10−05 | 5.000 × 10−08 |
| Model 56 | 1.887 × 10+13 | 1.512 × 10−05 | 4.535 × 10−08 |
| Model 57 | 1.918 × 10+13 | 1.290 × 10−05 | 5.223 × 10−08 |
| Model 58 | 1.889 × 10+13 | 3.904 × 10−05 | 5.159 × 10−08 |
| Model 59 | 1.753 × 10+12 | 0.000 × 10+00 | 2.583 × 10+03 |
| Model 60 | 6.731 × 10+12 | 6.865 × 10−06 | 3.008 × 10−08 |
| Model 61 | 1.960 × 10+13 | 1.685 × 10−05 | 4.731 × 10−08 |
| Model 62 | 1.917 × 10+13 | 2.278 × 10−05 | 5.111 × 10−08 |
| Model 63 | 1.876 × 10+13 | 3.721 × 10−05 | 5.368 × 10−08 |
| Model 64 | 1.745 × 10+12 | 0.000 × 10+00 | 8.408 × 10⁻¹¹ |
| Model 65 | 4.605 × 10+12 | 6.606 × 10−06 | 3.039 × 10−08 |
| Model 66 | 1.946 × 10+13 | 2.078 × 10−05 | 4.600 × 10−08 |
| Model 67 | 1.900 × 10+13 | 3.291 × 10−05 | 5.527 × 10−08 |
| Model 68 | 1.853 × 10+13 | 3.128 × 10−05 | 5.553 × 10−08 |
| Model 69 | 1.803 × 10+12 | 0.000 × 10+00 | 1.158 × 10⁻¹⁰ |
| Model 70 | 1.903 × 10+12 | 0.000 × 10+00 | 1.372 × 10⁻¹⁰ |
| Model 71 | 1.757 × 10+13 | 6.485 × 10−06 | 3.151 × 10−08 |
| Model 72 | 2.171 × 10+13 | 1.354 × 10−05 | 5.280 × 10−08 |
| Model 73 | 2.136 × 10+13 | 2.425 × 10−05 | 1.622 × 10−09 |
| Model 74 | 1.905 × 10+13 | 1.352 × 10−05 | 1.523 × 10−07 |
| Model 75 | 9.524 × 10+11 | 0.000 × 10+00 | 1.404 × 10⁻¹⁰ |
| Model 76 | 1.219 × 10+13 | 7.249 × 10−06 | 3.332 × 10−08 |
| Model 77 | 2.176 × 10+13 | 1.515 × 10−05 | 5.209 × 10−08 |
| Model 78 | 2.130 × 10+13 | 3.565 × 10−05 | 5.179 × 10−08 |
| Model 79 | 2.081 × 10+13 | 3.427 × 10−05 | 5.692 × 10−08 |
| Model 80 | 9.052 × 10+11 | 0.000 × 10+00 | 1.529 × 10⁻¹⁰ |
| Model 81 | 7.637 × 10+12 | 9.195 × 10−06 | 3.208 × 10−08 |
| Model 82 | 2.170 × 10+13 | 2.397 × 10−05 | 4.978 × 10−08 |
| Model 83 | 2.127 × 10+13 | 2.522 × 10−05 | 5.448 × 10−08 |
| Model 84 | 2.072 × 10+13 | 4.756 × 10−05 | 7.999 × 10−08 |
| Model 85 | 9.712 × 10+11 | 0.000 × 10+00 | 1.612 × 10⁻¹⁰ |
| Model 86 | 6.796 × 10+12 | 8.914 × 10−06 | 3.243 × 10−08 |
| Model 87 | 2.169 × 10+13 | 2.114 × 10−05 | 5.158 × 10−08 |
| Model 88 | 2.120 × 10+13 | 3.744 × 10−05 | 5.309 × 10−08 |
| Model 89 | 2.071 × 10+13 | 3.533 × 10−05 | 5.730 × 10−08 |
| Model 90 | 1.183 × 10+12 | 0.000 × 10+00 | 9.810 × 10⁻¹¹ |
| Model 91 | 7.787 × 10+12 | 1.658 × 10−06 | 3.424 × 10⁻¹¹ |
| Model 92 | 2.547 × 10+13 | 3.489 × 10−06 | 8.985 × 10−08 |
| Model 93 | 1.176 × 10+12 | 0.000 × 10+00 | 8.467 × 10⁻¹¹ |
| Model 94 | 6.661 × 10+12 | 2.001 × 10−06 | 6.832 × 10−09 |
| Model 95 | 2.562 × 10+13 | 6.374 × 10−06 | 1.045 × 10−07 |
| Model 96 | 1.170 × 10+12 | 0.000 × 10+00 | 3.222 × 10+03 |
| Model 97 | 6.330 × 10+12 | 2.464 × 10−06 | 7.067 × 10−09 |
| Model 98 | 6.989 × 10+12 | 7.741 × 10−06 | 3.920 × 10−08 |
| Model 99 | 2.558 × 10+13 | 1.515 × 10−05 | 5.142 × 10−08 |
| Model 100 | 2.484 × 10+13 | 3.312 × 10−05 | 7.342 × 10−08 |
| Model 101 | 1.144 × 10+12 | 0.000 × 10+00 | 1.051 × 10⁻¹⁰ |
| Model 102 | 3.583 × 10+12 | 2.247 × 10−06 | 7.582 × 10−09 |
| Model 103 | 1.415 × 10+13 | 1.107 × 10−05 | 3.570 × 10−08 |
| Model 104 | 2.510 × 10+13 | 1.694 × 10−05 | 5.508 × 10−08 |
| Model 105 | 2.483 × 10+13 | 2.662 × 10−05 | 1.017 × 10−09 |
| Model 106 | 1.160 × 10+12 | 0.000 × 10+00 | 1.101 × 10⁻¹⁰ |
| Model 107 | 3.488 × 10+12 | 2.364 × 10−06 | 8.104 × 10−09 |
| Model 108 | 1.549 × 10+13 | 9.638 × 10−06 | 2.178 × 10−09 |
| Model 109 | 2.557 × 10+13 | 2.126 × 10−05 | 5.256 × 10−08 |
| Model 110 | 2.480 × 10+13 | 2.416 × 10−05 | 6.040 × 10−08 |
MADM total results
| Notation | Von Mises stress | Strain | Displacement | Total score |
|---|---|---|---|---|
| C1 | C2 | C3 | ||
| Model 1 | 8.402 × 10+11 | 0.000 × 10+00 | 2.131 × 10⁻¹¹ | 8.402 × 10+11 |
| Model 2 | 6.386 × 10+12 | 1.404 × 10−06 | 4.071 × 10−09 | 6.386 × 10+12 |
| Model 3 | 9.804 × 10+12 | 4.462 × 10−06 | 7.077 × 10−09 | 9.804 × 10+12 |
| Model 4 | 9.762 × 10+12 | 1.449 × 10−06 | 1.487 × 10−08 | 9.762 × 10+12 |
| Model 5 | 3.412 × 10+11 | 0.000 × 10+00 | 2.154 × 10⁻¹¹ | 3.412 × 10+11 |
| Model 6 | 5.958 × 10+12 | 1.525 × 10−06 | 4.472 × 10−09 | 5.958 × 10+12 |
| Model 7 | 9.800 × 10+12 | 4.815 × 10−06 | 7.651 × 10−09 | 9.800 × 10+12 |
| Model 8 | 9.508 × 10+12 | 9.322 × 10−06 | 9.362 × 10−09 | 9.508 × 10+12 |
| Model 9 | 9.237 × 10+12 | 5.669 × 10−06 | 2.749 × 10−08 | 9.237 × 10+12 |
| Model 10 | 8.615 × 10+11 | 0.000 × 10+00 | 1.472 × 10⁻¹¹ | 8.615 × 10+11 |
| Model 11 | 3.886 × 10+12 | 2.049 × 10−06 | 4.896 × 10−09 | 3.886 × 10+12 |
| Model 12 | 9.798 × 10+12 | 5.072 × 10−06 | 7.640 × 10−09 | 9.798 × 10+12 |
| Model 13 | 9.628 × 10+12 | 7.843 × 10−06 | 8.794 × 10−09 | 9.628 × 10+12 |
| Model 14 | 9.276 × 10+12 | 8.919 × 10−06 | 8.883 × 10−09 | 9.276 × 10+12 |
| Model 15 | 8.294 × 10+11 | 0.000 × 10+00 | 1.212 × 10⁻¹¹ | 8.294 × 10+11 |
| Model 16 | 4.124 × 10+12 | 2.104 × 10−06 | 4.405 × 10−09 | 4.124 × 10+12 |
| Model 17 | 9.795 × 10+12 | 4.648 × 10−06 | 7.166 × 10−09 | 9.795 × 10+12 |
| Model 18 | 9.601 × 10+12 | 7.447 × 10−06 | 8.698 × 10−09 | 9.601 × 10+12 |
| Model 19 | 9.397 × 10+12 | 6.104 × 10−06 | 8.415 × 10−09 | 9.397 × 10+12 |
| Model 20 | 8.839 × 10+11 | 0.000 × 10+00 | 1.219 × 10⁻¹¹ | 8.839 × 10+11 |
| Model 21 | 2.804 × 10+12 | 2.202 × 10−06 | 5.065 × 10−09 | 2.804 × 10+12 |
| Model 22 | 9.735 × 10+12 | 6.196 × 10−06 | 7.232 × 10−09 | 9.735 × 10+12 |
| Model 23 | 9.583 × 10+12 | 7.566 × 10−06 | 7.953 × 10−09 | 9.583 × 10+12 |
| Model 24 | 9.377 × 10+12 | 1.043 × 10−05 | 8.913 × 10−09 | 9.377 × 10+12 |
| Model 25 | 7.614 × 10+11 | 0.000 × 10+00 | 1.383 × 10⁻¹¹ | 7.614 × 10+11 |
| Model 26 | 5.440 × 10+12 | 1.442 × 10−06 | 3.593 × 10−09 | 5.440 × 10+12 |
| Model 27 | 1.051 × 10+13 | 1.244 × 10−06 | 1.478 × 10−08 | 1.051 × 10+13 |
| Model 28 | 7.575 × 10+11 | 0.000 × 10+00 | 1.793 × 10⁻¹¹ | 7.575 × 10+11 |
| Model 29 | 2.308 × 10+12 | 1.479 × 10−06 | 3.052 × 10−09 | 2.308 × 10+12 |
| Model 30 | 1.068 × 10+13 | 4.282 × 10−06 | 1.066 × 10⁻¹⁰ | 1.068 × 10+13 |
| Model 31 | 1.036 × 10+13 | 7.057 × 10−06 | 9.184 × 10−09 | 1.036 × 10+13 |
| Model 32 | 2.147 × 10+09 | 6.710 × 10−06 | 2.580 × 10−08 | 2.147 × 10+09 |
| Model 33 | 7.536 × 10+11 | 0.000 × 10+00 | 2.215 × 10⁻¹¹ | 7.536 × 10+11 |
| Model 34 | 5.686 × 10+12 | 1.509 × 10−06 | 3.724 × 10−09 | 5.686 × 10+12 |
| Model 35 | 1.059 × 10+13 | 5.009 × 10−06 | 9.745 × 10−09 | 1.059 × 10+13 |
| Model 36 | 1.045 × 10+13 | 5.312 × 10−06 | 1.098 × 10−08 | 1.045 × 10+13 |
| Model 37 | 1.010 × 10+13 | 8.431 × 10−06 | 9.218 × 10−09 | 1.010 × 10+13 |
| Model 38 | 7.377 × 10+11 | 0.000 × 10+00 | 1.974 × 10⁻¹¹ | 7.377 × 10+11 |
| Model 39 | 2.484 × 10+12 | 1.553 × 10−06 | 3.883 × 10−09 | 2.484 × 10+12 |
| Model 40 | 1.015 × 10+13 | 5.244 × 10−06 | 7.207 × 10−09 | 1.015 × 10+13 |
| Model 41 | 1.047 × 10+13 | 6.360 × 10−06 | 8.636 × 10−09 | 1.047 × 10+13 |
| Model 42 | 1.024 × 10+13 | 9.822 × 10−06 | 9.606 × 10−09 | 1.024 × 10+13 |
| Model 43 | 3.242 × 10+11 | 0.000 × 10+00 | 1.919 × 10⁻¹¹ | 3.242 × 10+11 |
| Model 44 | 2.491 × 10+12 | 1.710 × 10−06 | 3.693 × 10−09 | 2.491 × 10+12 |
| Model 45 | 1.066 × 10+13 | 4.594 × 10−06 | 7.338 × 10−09 | 1.066 × 10+13 |
| Model 46 | 1.035 × 10+13 | 9.329 × 10−06 | 8.199 × 10−09 | 1.035 × 10+13 |
| Model 47 | 1.022 × 10+13 | 1.518 × 10−05 | 9.146 × 10−09 | 1.022 × 10+13 |
| Model 48 | 9.025 × 10+11 | 0.000 × 10+00 | 2.004 × 10⁻¹¹ | 9.025 × 10+11 |
| Model 49 | 2.632 × 10+12 | 2.080 × 10−06 | 4.904 × 10−09 | 2.632 × 10+12 |
| Model 50 | 9.726 × 10+12 | 1.397 × 10−06 | 1.416 × 10−08 | 9.726 × 10+12 |
| Model 51 | 8.827 × 10+11 | 0.000 × 10+00 | 7.805 × 10⁻¹² | 8.827 × 10+11 |
| Model 52 | 3.154 × 10+12 | 2.235 × 10−06 | 4.681 × 10−09 | 3.154 × 10+12 |
| Model 53 | 9.806 × 10+12 | 4.497 × 10−06 | 7.656 × 10−09 | 9.806 × 10+12 |
| Model 54 | 8.085 × 10+11 | 0.000 × 10+00 | 1.308 × 10⁻¹⁰ | 8.085 × 10+11 |
| Model 55 | 1.112 × 10+13 | 7.347 × 10−06 | 8.333 × 10−09 | 1.112 × 10+13 |
| Model 56 | 9.433 × 10+12 | 5.039 × 10−06 | 7.558 × 10−09 | 9.433 × 10+12 |
| Model 57 | 9.589 × 10+12 | 4.300 × 10−06 | 8.706 × 10−09 | 9.589 × 10+12 |
| Model 58 | 9.444 × 10+12 | 1.301 × 10−05 | 8.598 × 10−09 | 9.444 × 10+12 |
| Model 59 | 8.766 × 10+11 | 0.000 × 10+00 | 4.305 × 10+02 | 8.766 × 10+11 |
| Model 60 | 3.366 × 10+12 | 2.288 × 10−06 | 5.013 × 10−09 | 3.366 × 10+12 |
| Model 61 | 9.801 × 10+12 | 5.618 × 10−06 | 7.884 × 10−09 | 9.801 × 10+12 |
| Model 62 | 9.585 × 10+12 | 7.594 × 10−06 | 8.519 × 10−09 | 9.585 × 10+12 |
| Model 63 | 9.379 × 10+12 | 1.240 × 10−05 | 8.946 × 10−09 | 9.379 × 10+12 |
| Model 64 | 8.726 × 10+11 | 0.000 × 10+00 | 1.401 × 10⁻¹¹ | 8.726 × 10+11 |
| Model 65 | 2.303 × 10+12 | 2.202 × 10−06 | 5.065 × 10−09 | 2.303 × 10+12 |
| Model 66 | 9.732 × 10+12 | 6.925 × 10−06 | 7.667 × 10−09 | 9.732 × 10+12 |
| Model 67 | 9.500 × 10+12 | 1.097 × 10−05 | 9.212 × 10−09 | 9.500 × 10+12 |
| Model 68 | 9.264 × 10+12 | 1.043 × 10−05 | 9.256 × 10−09 | 9.264 × 10+12 |
| Model 69 | 9.016 × 10+11 | 0.000 × 10+00 | 1.929 × 10⁻¹¹ | 9.016 × 10+11 |
| Model 70 | 9.516 × 10+11 | 0.000 × 10+00 | 2.286 × 10⁻¹¹ | 9.516 × 10+11 |
| Model 71 | 8.786 × 10+12 | 2.162 × 10−06 | 5.252 × 10−09 | 8.786 × 10+12 |
| Model 72 | 1.085 × 10+13 | 4.512 × 10−06 | 8.800 × 10−09 | 1.085 × 10+13 |
| Model 73 | 1.068 × 10+13 | 8.085 × 10−06 | 2.704 × 10⁻¹⁰ | 1.068 × 10+13 |
| Model 74 | 9.523 × 10+12 | 4.507 × 10−06 | 2.538 × 10−08 | 9.523 × 10+12 |
| Model 75 | 4.762 × 10+11 | 0.000 × 10+00 | 2.340 × 10⁻¹¹ | 4.762 × 10+11 |
| Model 76 | 6.093 × 10+12 | 2.416 × 10−06 | 5.554 × 10−09 | 6.093 × 10+12 |
| Model 77 | 1.088 × 10+13 | 5.051 × 10−06 | 8.681 × 10−09 | 1.088 × 10+13 |
| Model 78 | 1.065 × 10+13 | 1.188 × 10−05 | 8.632 × 10−09 | 1.065 × 10+13 |
| Model 79 | 1.041 × 10+13 | 1.142 × 10−05 | 9.487 × 10−09 | 1.041 × 10+13 |
| Model 80 | 4.526 × 10+11 | 0.000 × 10+00 | 2.549 × 10⁻¹¹ | 4.526 × 10+11 |
| Model 81 | 3.818 × 10+12 | 3.065 × 10−06 | 5.346 × 10−09 | 3.818 × 10+12 |
| Model 82 | 1.085 × 10+13 | 7.988 × 10−06 | 8.296 × 10−09 | 1.085 × 10+13 |
| Model 83 | 1.063 × 10+13 | 8.406 × 10−06 | 9.080 × 10−09 | 1.063 × 10+13 |
| Model 84 | 1.036 × 10+13 | 1.585 × 10−05 | 1.333 × 10−08 | 1.036 × 10+13 |
| Model 85 | 4.856 × 10+11 | 0.000 × 10+00 | 2.687 × 10⁻¹¹ | 4.856 × 10+11 |
| Model 86 | 3.398 × 10+12 | 2.971 × 10−06 | 5.405 × 10−09 | 3.398 × 10+12 |
| Model 87 | 1.084 × 10+13 | 7.047 × 10−06 | 8.597 × 10−09 | 1.084 × 10+13 |
| Model 88 | 1.060 × 10+13 | 1.248 × 10−05 | 8.848 × 10−09 | 1.060 × 10+13 |
| Model 89 | 1.036 × 10+13 | 1.178 × 10−05 | 9.551 × 10−09 | 1.036 × 10+13 |
| Model 90 | 5.913 × 10+11 | 0.000 × 10+00 | 1.635 × 10⁻¹¹ | 5.913 × 10+11 |
| Model 91 | 3.894 × 10+12 | 5.525 × 10−07 | 5.706 × 10⁻¹² | 3.894 × 10+12 |
| Model 92 | 1.273 × 10+13 | 1.163 × 10−06 | 1.497 × 10−08 | 1.273 × 10+13 |
| Model 93 | 5.881 × 10+11 | 0.000 × 10+00 | 1.411 × 10⁻¹¹ | 5.881 × 10+11 |
| Model 94 | 3.330 × 10+12 | 6.670 × 10−07 | 1.139 × 10−09 | 3.330 × 10+12 |
| Model 95 | 1.281 × 10+13 | 2.125 × 10−06 | 1.742 × 10−08 | 1.281 × 10+13 |
| Model 96 | 5.849 × 10+11 | 0.000 × 10+00 | 5.370 × 10+02 | 5.849 × 10+11 |
| Model 97 | 3.165 × 10+12 | 8.213 × 10−07 | 1.178 × 10−09 | 3.165 × 10+12 |
| Model 98 | 3.495 × 10+12 | 2.580 × 10−06 | 6.534 × 10−09 | 3.495 × 10+12 |
| Model 99 | 1.279 × 10+13 | 5.051 × 10−06 | 8.571 × 10−09 | 1.279 × 10+13 |
| Model 100 | 1.242 × 10+13 | 1.104 × 10−05 | 1.224 × 10−08 | 1.242 × 10+13 |
| Model 101 | 5.719 × 10+11 | 0.000 × 10+00 | 1.751 × 10⁻¹¹ | 5.719 × 10+11 |
| Model 102 | 1.791 × 10+12 | 7.491 × 10−07 | 1.264 × 10−09 | 1.791 × 10+12 |
| Model 103 | 7.077 × 10+12 | 3.692 × 10−06 | 5.950 × 10−09 | 7.077 × 10+12 |
| Model 104 | 1.255 × 10+13 | 5.646 × 10−06 | 9.180 × 10−09 | 1.255 × 10+13 |
| Model 105 | 1.241 × 10+13 | 8.872 × 10−06 | 1.695 × 10⁻¹⁰ | 1.241 × 10+13 |
| Model 106 | 5.800 × 10+11 | 0.000 × 10+00 | 1.835 × 10⁻¹¹ | 5.800 × 10+11 |
| Model 107 | 1.744 × 10+12 | 7.881 × 10−07 | 1.351 × 10−09 | 1.744 × 10+12 |
| Model 108 | 7.743 × 10+12 | 3.213 × 10−06 | 3.629 × 10⁻¹⁰ | 7.743 × 10+12 |
| Model 109 | 1.279 × 10+13 | 7.086 × 10−06 | 8.760 × 10−09 | 1.279 × 10+13 |
| Model 110 | 1.240 × 10+13 | 8.052 × 10−06 | 1.007 × 10−08 | 1.240 × 10+13 |
After getting the total score from all variation models, ranking can be done to obtain the ten best and worst variation models shown in Tables 8 and 9. Based on the ranking results above, the best model is the one using AH 36 steel material with a plate thickness of 9 mm at a temperature of 450°C, with a final score of 2.147 × 10+09. In comparison, the model with the immense final value, 1.281 × 10+13, belongs to the model variation using medium carbon steel material with a plate thickness of 9 mm at a temperature of 250°C.
Ranking for 10 best models from MADM
| Model | Total score | Ranking |
|---|---|---|
| Model 32 | 2.147 × 10+09 | 1 |
| Model 43 | 3.242 × 10+11 | 2 |
| Model 5 | 3.412 × 10+11 | 3 |
| Model 80 | 4.526 × 10+11 | 4 |
| Model 75 | 4.762 × 10+11 | 5 |
| Model 85 | 4.856 × 10+11 | 6 |
| Model 101 | 5.719 × 10+11 | 7 |
| Model 106 | 5.800 × 10+11 | 8 |
| Model 96 | 5.849 × 10+11 | 9 |
| Model 93 | 5.881 × 10+11 | 10 |
Ranking for 10 worst models from MADM
| Model | Total score | Ranking |
|---|---|---|
| Model 77 | 1.088 × 10+13 | 1 |
| Model 55 | 1.112 × 10+13 | 2 |
| Model 110 | 1.240 × 10+13 | 3 |
| Model 105 | 1.241 × 10+13 | 4 |
| Model 100 | 1.242 × 10+13 | 5 |
| Model 104 | 1.255 × 10+13 | 6 |
| Model 92 | 1.273 × 10+13 | 7 |
| Model 109 | 1.279 × 10+13 | 8 |
| Model 99 | 1.279 × 10+13 | 9 |
| Model 95 | 1.281 × 10+13 | 10 |
5.5 Sensitivity analysis
This research utilizes a linear regression method to conduct sensitivity analysis and obtain coefficient values, standard errors, R values, p-values, and significant F values to comprehensively understand the impact of variations in temperature, plate thickness, and thermal expansion coefficient on structural strength during a fire phenomenon. Table 10 meticulously presents the sensitivity analysis results of the Von Mises stress value criteria, elucidating the intricate relationships between these variables and the structural response to fire incidents.
Sensitivity analysis of Von Mises stress results
| Von Mises Stress | |||
|---|---|---|---|
| Indicator | Variable | ||
| Temperature | Thickness | Coefficient thermal expansion | |
| Coefficient | 5.0731 × 10+10 | 6.3589 × 10+11 | 2.8369 × 10+11 |
| Standard error | 5.0800 × 10+12 | 8.6913 × 10+12 | 8.7187 × 10+12 |
| P – Values | 3.6424 × 10⁻²⁷ | 3.1248 × 10−01 | 5.5817 × 10−01 |
| R Square | 0.6616 | 0.0094 | 0.0032 |
| Significant F | 3.6424 × 10⁻²⁷ | 3.1248 × 10−01 | 5.5817 × 10−01 |
Based on the data above, temperature has a significant effect because it has the largest R-value. The coefficient value, standard error, and p-values show that variations in plate thickness and Coefficient Thermal Expansion have less significant influence on the final test results. Table 11 presents the sensitivity analysis results of the Strain criteria, clarifying the intricate relationships between these variables and the structural response to fire incidents.
Sensitivity analysis of strain results
| Strain | |||
|---|---|---|---|
| Indicator | Variable | ||
| Temperature | Thickness | Coefficient thermal expansion | |
| Coefficient | 7.5847 × 10−08 | 2.9978 × 10−06 | 1.4539 × 10−06 |
| Standard error | 5.8819 × 10−06 | 1.1461 × 10−05 | 1.1874 × 10−05 |
| P – Values | 9.0090 × 10−36 | 4.3833 × 10−04 | 2.9189 × 10−02 |
| R Square | 0.7652 | 0.1086 | 0.0433 |
| Significant F | 9.0090 × 10−36 | 4.3833 × 10−04 | 2.9189 × 10−02 |
Based on the data above, temperature has a significant effect because it has the largest R-value compared to the other variables. Apart from that, the coefficient value, standard error, and p-values show that variations in plate thickness and Coefficient Thermal Expansion have less significant influence on the final test results of the simulation. The results of the sensitivity analysis on the displacement criteria are shown in Table 12.
Sensitivity analysis of displacement results
| Displacement | |||
|---|---|---|---|
| Indicator | Variable | ||
| Temperature | Thickness | Coefficient thermal expansion | |
| Coefficient | −0.5010 | 6.0210 | −17.9036 |
| Standard error | 387.4882 | 393.7048 | 392.5567 |
| P – Values | 0.0626 | 0.8324 | 0.4121 |
| R Square | 0.0317 | 0.0004 | 0.0062 |
| Significant F | 0.0626 | 0.8324 | 0.4121 |
The data presented show that temperature significantly influences the highest R-value. In addition, the coefficient values, standard errors, and p-values show that variations in plate thickness and Coefficient Thermal Expansion have a minor influence on the final test results. Thus, it can be concluded that the sensitivity analysis confirms that temperature is the most influential factor in the results of Von Mises stress, strain, and displacement.
6 Conclusions
Based on the tests that have been carried out, it was found that when material variations were carried out, the Von Mises stress contour and the resulting strain were similar; however, for the medium carbon steel material, the strain contour was smaller. This is because the material has high elasticity. Similar to the displacement that occurs, the medium carbon steel material also has the smallest displacement value when compared to other materials that have similar displacement values. Meanwhile, when varying the temperature, the movement of the Von Mises stress contour and the resulting strain and displacement values are proportional to the increase in temperature obtained. With variations in plate thickness, the thicker the structure, the greater the Von Mises stress contour and the strains obtained. It happens because the temperature difference between the surface exposed to heat and the inside of the structure is quite large, resulting in a reasonably significant Von Mises stress gradient. The displacement results with the highest plate thickness produce slower displacement than other plate thicknesses because the time required for the structure to propagate heat is longer, so the transfer speed will be slower.
The MADM analysis, a crucial part of our research, identified model 32 with AH 36 steel material, a plate thickness of 9 mm, and a temperature of 450°C as the best model, with a final score of 2.147 × 10+09. On the other hand, model 95, with the most significant final score of 1.281 × 10+13, used medium carbon steel material, a plate thickness of 9 mm, and a temperature of 250°C is considered the worst model. Our sensitivity analysis further confirmed the importance of temperature, as it was found to be the factor with the most significant influence on the results of Von Mises stress, strain, and displacement. This is due to the high R-value at temperature compared to the other two variables.
Acknowledgements
This work is part of a collaboration project between the Faculty of Engineering, Universitas Sebelas Maret (UNS), and Research Center of Testing Technology and Standard, National Research and Innovation Agency (BRIN) with Collaboration Agreement Numbers 179/V/KS/06/2024 and 541/UN27.08.1/HK.07.00/2024.
-
Funding information: The authors state no funding involved.
-
Author contributions: All authors have accepted responsibility for the entire content of this manuscript and consented to its submission to the journal, reviewed all the results, and approved the final version of the manuscript. MAS: writing – original draft, formal analysis, data curation, and investigation. APP: investigation, formal analysis, and conceptualization. TM: supervision, conceptualization, methodology. ARP: methodology, project administration, supervision, writing – review & editing, project administration, funding acquisition. BK: supervision, visualization, and writing – review & editing. HF: investigation, methodology, and software.
-
Conflict of interest: The authors state no conflict of interest.
-
Data availability statement: The authors confirm that the data supporting the findings of this study are available within the article.
References
[1] Badan Pusat Statistik (BPS). “Ekspor Menurut Moda Transportasi Tahun 2021–2022”. Katalog BPS 8202028; 2022. Diakses dari http://www.bps.go.id/, accessed on 7 April 2023.Search in Google Scholar
[2] Komite Nasional Keselamatan Transportasi. Laporan Statistik Investigasi Kecelakaan Transportasi Tahun 2023 Semester I; 2023.Search in Google Scholar
[3] Gillie M. Analysis of heated structures: Nature and modelling benchmarks. Fire Saf J. 2009;44(5):673–80.10.1016/j.firesaf.2009.01.003Search in Google Scholar
[4] Elghazouli AY, Izzuddin BA, Richardson AJ. Numerical modelling of the structural fire behaviour of composite buildings. Fire Saf J. 2000;35:279–97.10.1016/S0379-7112(00)00044-8Search in Google Scholar
[5] Duthinh D, McGrattan K, Khaskia A. Recent advances in fire–structure analysis. Fire Saf J. 2008;43:161–7.10.1016/j.firesaf.2007.06.006Search in Google Scholar
[6] Sun J, Meng F, Andisheh K, Clifton GC. Numerical analysis of restrained continuous steel columns under standard fire. Fire. 2023;6(9):330.10.3390/fire6090330Search in Google Scholar
[7] Kong S, Liu K, Qiu W, Gao Z, Wang J. Numerical and experimental analysis of fire resistance for bulkhead and deck structures of ships and offshore installations. J Mar Sci Eng. 2023;11:1200.10.3390/jmse11061200Search in Google Scholar
[8] Wickström U. The plate thermometer – a simple instrument for reaching harmonized fire resistance tests. Fire Technol. 1994;30(2):195–208.10.1007/BF01040002Search in Google Scholar
[9] Florea GD, Vlasin NI, Simon AB, Manea F, Vass Z. Computational simulation of heat conduction on different surfaces. MATEC Web Conf. 2021;342:01014.10.1051/matecconf/202134201014Search in Google Scholar
[10] Silva JCG, Landesmann A, Ribeiro FLB. Fire-thermomechanical interface model for performance-based analysis of structures exposed to fire. Fire Saf J. 2016;83:66–78.10.1016/j.firesaf.2016.04.007Search in Google Scholar
[11] Couto C, Silva T, Carić M, Real PV, Skejić D. Performance based design of unbraced steel frames exposed to natural fire scenarios. Proceedings of the International Conference in Dubrovnik, Dubrovnik, Croatia. 10.14311/asfe.2015.026.Search in Google Scholar
[12] Nurcholis A, Prabowo AR, Muhayat N, Yaningsih I, Tjahjana DD, Jurkovič M, et al. Performances of the sandwich panel structures under fire accident due to hydrogen leaks: Consideration of structural design and environment factor using FE analysis. Curved Layer Struct. 2024;11(1):20240005.10.1515/cls-2024-0005Search in Google Scholar
[13] Wang CM, Reddy JN, Lee KH. Chapter 7 – Bending relationships for simply supported plates. Shear deformable beams and plates. Amsterdam, Netherlands: Elsevier Science; 2000; p. 111–32.10.1016/B978-008043784-2/50007-1Search in Google Scholar
[14] Katsikadelis JT. Chapter two – BEM for plate bending analysis. The boundary element method for plate analysis. Cambridge, United States: Academic Press; 2014. p. 21–111.10.1016/B978-0-12-416739-1.00002-0Search in Google Scholar
[15] Chen S, Zhang Y, Yan W, Kim KS. Experimental study and analysis on the collapse behavior of an inferior column in a steel structure under local fire. Adv Struct Eng. 2016;19:173–86.10.1177/1369433215624318Search in Google Scholar
[16] Zhang Y, Cai W. A study on mesh convergence for finite element analysis of structural problems. Eng Struct. 2019;195:187–98.Search in Google Scholar
[17] Liu X, Cai G. Thermal analysis and rigid-flexible coupling dynamics of a satellite with membrane antenna. Int J Aerosp Eng. 2022;2022:3256825.10.1155/2022/3256825Search in Google Scholar
[18] Bhowmik A, Chakraborty A. Mesh convergence study of heat transfer problems using finite volume method. Int J Heat Mass Transf. 2017;115:1025–35.Search in Google Scholar
[19] Ratner TLW. Part III – Optimization of typical structures. Non-Linear theory of elasticity and optimal design. Amsterdam, Netherlands: Elsevier Science; 2003. p. 107–44.10.1016/B978-044451427-1/50006-2Search in Google Scholar
[20] Fang HS, Jin ZL, Zhang MJ, Zhang Z, Zhao CJ. Role of internal radiation at the different growth stages of sapphire by Kyropoulos method. Int J Heat Mass Transf. 2013;67:967–73.10.1016/j.ijheatmasstransfer.2013.08.074Search in Google Scholar
© 2024 the author(s), published by De Gruyter
This work is licensed under the Creative Commons Attribution 4.0 International License.
Articles in the same Issue
- Research Articles
- Flutter investigation and deep learning prediction of FG composite wing reinforced with carbon nanotube
- Experimental and numerical investigation of nanomaterial-based structural composite
- Optimisation of material composition in functionally graded plates for thermal stress relaxation using statistical design support system
- Tensile assessment of woven CFRP using finite element method: A benchmarking and preliminary study for thin-walled structure application
- Reliability and sensitivity assessment of laminated composite plates with high-dimensional uncertainty variables using active learning-based ensemble metamodels
- Performances of the sandwich panel structures under fire accident due to hydrogen leaks: Consideration of structural design and environment factor using FE analysis
- Recycling harmful plastic waste to produce a fiber equivalent to carbon fiber reinforced polymer for reinforcement and rehabilitation of structural members
- Effect of seed husk waste powder on the PLA medical thread properties fabricated via 3D printer
- Finite element analysis of the thermal and thermo-mechanical coupling problems in the dry friction clutches using functionally graded material
- Strength assessment of fiberglass layer configurations in FRP ship materials from yard practices using a statistical approach
- An enhanced analytical and numerical thermal model of frictional clutch system using functionally graded materials
- Using collocation with radial basis functions in a pseudospectral framework to the analysis of laminated plates by the Reissner’s mixed variational theorem
- A new finite element formulation for the lateral torsional buckling analyses of orthotropic FRP-externally bonded steel beams
- Effect of random variation in input parameter on cracked orthotropic plate using extended isogeometric analysis (XIGA) under thermomechanical loading
- Assessment of a new higher-order shear and normal deformation theory for the static response of functionally graded shallow shells
- Nonlinear poro thermal vibration and parametric excitation in a magneto-elastic embedded nanobeam using homotopy perturbation technique
- Finite-element investigations on the influence of material selection and geometrical parameters on dental implant performance
- Study on resistance performance of hexagonal hull form with variation of angle of attack, deadrise, and stern for flat-sided catamaran vessel
- Evaluation of double-bottom structure performance under fire accident using nonlinear finite element approach
- Behavior of TE and TM propagation modes in nanomaterial graphene using asymmetric slab waveguide
- FEM for improvement of damage prediction of airfield flexible pavements on soft and stiff subgrade under various heavy load configurations of landing gear of new generation aircraft
- Review Article
- Deterioration and imperfection of the ship structural components and its effects on the structural integrity: A review
- Erratum
- Erratum to “Performances of the sandwich panel structures under fire accident due to hydrogen leaks: Consideration of structural design and environment factor using FE analysis”
- Special Issue: The 2nd Thematic Symposium - Integrity of Mechanical Structure and Material - Part II
- Structural assessment of 40 ft mini LNG ISO tank: Effect of structural frame design on the strength performance
- Experimental and numerical investigations of multi-layered ship engine room bulkhead insulation thermal performance under fire conditions
- Investigating the influence of plate geometry and detonation variations on structural responses under explosion loading: A nonlinear finite-element analysis with sensitivity analysis