Common Prosperity and Reshaping China’s Economic Cycle: Theoretical Logic and Empirical Evidence from a Political Economic Perspective
-
Xiaonan Qiao
 ,
Xin Li
,
Xin Li

Abstract
Fostering a new development dynamic is in nature about reshaping the relations between domestic and international economic cycles to achieve self-reliance and self-strengthening at higher levels. Economic cycle is the integration of various links such as production, distribution, exchange and consumption. This paper attempts to study the influence on economic cycle from income distribution based on the principles of political economy and therefore link common prosperity with the new development dynamic. It finds that labor income share is central to income distribution. On the supply side, income distribution affects choice of technology and production efficiency through changing wages; on the demand side, it influences size of demand and level of capacity utilization both directly and indirectly. Specifically, changing wages lead to changing size of reproduction and consumption by laborers in the direct way and cause changing profit margins and thus affect accumulation in the indirect way. The two channels produce effects simultaneously, yet in opposite directions, which justifies the categorization of economies into “profit-oriented” and “wage-oriented” ones according to the different influence of changing wages on the level of capacity utilization. In this theoretical logic, the paper comprehensively analyzes China’s income distribution, wages, all labor productivity, organic composition of capital, profit margins, accumulation rates, level of capacity utilization and relations between domestic and international economic cycles, and finds that Chinese economy has turned from “profit-oriented” to “wage-oriented” since the turning point of 2010. It signals both necessity and feasibility of promoting common prosperity and fostering a new development dynamic. This paper also proposes some policy suggestions on promoting common prosperity from the perspectives of ownership, distribution, government-market relations and spatial structure.
1 Introduction and Literature Review
The report of the 20th National Congress of the Communist Party of China (CPC) defined high-quality development as the primary task for building a modern socialist country in all respects and highlighted the necessity of accelerating the creation of a new development dynamic featuring dual circulation, in which domestic and overseas markets reinforce each other, with the domestic market as the mainstay.
Fostering a new development dynamic is in nature about reshaping the relations between domestic and international economic cycles to achieve self-reliance and self-strengthening at higher levels, which justifies the necessity of starting with economic cycle for relevant research. The process of social reproduction is manifested by the economic cycle that incorporates production, distribution, exchanges and consumption. Unlike economic view of distribution, political economics regards production relations in the economic cycle as an adjustable variable and believes it is feasible to change the structure of economic cycle and influence the productivity by adjusting distribution. Under the premise of upholding and improving the basic economic system, starting with distribution to steadily advance common prosperity can act as an important breakthrough in reshaping the economic cycle and promoting high-quality development. In another word, high-quality development, an essential requirement to realize Chinese path to modernization, is logically consistent with the realization of common prosperity for all and also intertwined with the creation of a new development dynamic. To this end, study on common prosperity and reshaping of China’s economic cycle based on the principles of political economics can offer a new perspective different from western economics, contribute to theoretical innovation in socialist political economy with Chinese characteristics, and deepen the understanding on Xi Jinping’s Economic Thought.
Xi (2023) pointed out that to accelerate the fostering of a new development dynamic is a strategic decision made to realize the goal with development and security and a strategic step for taking the initiative in development. Research has been conducted on the theoretical basis, connotations and measurement of the new development dynamic (Huang and Ni, 2021; Pei and Liu, 2021; Qiao and Wang, 2021). Xi (2021) also noted that common prosperity is for everyone, and covers enrichment of people’s lives in both material and non-material sense. His views comprehensively elaborate on major issues such as the principles, thinking and strategies for making progress in common prosperity. Detailed research has been conducted on the connotations, goal setting and strategies of common prosperity (Gao, 2013; Li, 2021).
This paper attempts to combine the new development dynamic and common prosperity for study based on the principles and methods of political economy. As promoting common prosperity mainly involves income distribution and fostering a new development dynamic engages economic cycle, it’s workable to establish the logical chain of advancing common prosperity and promoting the reshaping of economic cycle by studying the comprehensive influence of distribution on production, consumption and exchanges. Meanwhile, the paper also uses China’s input-output table to provide necessary empirical evidence for the theoretical mechanism. These are where the innovations of the paper lies.
This paper mainly seeks to address the following three issues. First, on the theoretical level, it analyzes the mechanism of income distribution adjustment affecting the economic cycle on the demand side and supply side respectively. This helps better understand the theoretical connotation of “integrating the implementation of the strategy to expand domestic demand with the efforts to deepen supply-side structural reform” proposed in the report of the 20th National Congress of the CPC. Second, on the empirical level, the paper puts forward an analytic framework of comprehensively understanding China’s economic development since 2000. It also discusses the wage and labor income share in the field of income distribution, industrialization on the supply side and rise of total labor productivity, relations of domestic and international economic cycles on the demand side, and changes with capacity utilization rate. Third, on the policy level, the paper proposes several policy suggestions on making progress in common prosperity to enhance the intrinsic power of domestic economic cycle.
2 Theoretical Logic
2.1 Economic Cycle in the Process of Social Reproduction
Political economy interpretes economic development as a process of social reproduction. Social reproduction of an economy in a specific period is always based on a particular economic cycle and incorporates the four steps of production, distribution, exchanges and consumption. Production lies on the supply side and consumption on the demand side, making supply-demand macro-analysis essentially the study on the relations between value creation and value use. In the short term, with technical conditions given, demand will drive or determine supply; in the long term, in combination with technical change, supply creates demand. Obviously, social reproduction requires the integration of labor and combined production factors in production, distribution, exchanges and consumption to realize circular flow. Smooth cycles will lead to effective expanded reproduction, higher output and accumulation of material wealth, while less smooth cycles will cause expanded reproduction to be delayed and even interrupted.
With a dynamic view of economic cycle in combination with the accumulation theory, from commodity production to commodity exchange, from value creation to value realization, they are both continuously circulating processes of reproduction. Movement of total social capital is not only about value compensation, but also about material compensation. It is subject to the constraints of both ratios among value components of social products and the use value or material forms social products. In addition, to study the whole process of production, it’s also necessary to include distribution on the basis of production and circulation and especially unify the “production – distribution relations” and “production – realization conditions” to study the long-term changing trend of profit margins and the dynamic adjustment of accumulation methods. Reasonable accumulation methods are crucial to long-term economic stability, while those failing to adapt to internal main social contradictions and external economic systems will be unsustainable and even lead to crises.
2.2 Distribution in the Economic cycle
Political economics perceives the determinants of distribution in an economic cycle differently from western economics. Western economics holds that the distribution between capital and labor in the market mechanism is determined by respective marginal productivity of the two and thus does not involves exploitation of labor by capital. Political economics, on the other hand, upholds the labor theory of value, maintaining that profit of capital is actually surplus value created by labor and that possession of means of production is the foundation for capital to harvest profit. On such basis, political economics advocates that ownership of means of production determines distribution. In another word, adhering to the basic socialist economic system is the prerequisite and foundation of eliminating exploitation, eradicating polarization and realizing common prosperity.
Adjustment of income distribution not only concerns common prosperity, but produces an effect on the economic cycle in the reproduction process (see Figure 1). On the supply side, wage changes will affect technical change and production efficiency; on the demand side, the distribution structure will alter the structure of consumption and accumulation. In both ways, distribution will act on capacity utilization at the level of value realization and further influence the economic cycle. Besides, adjustment of income distribution will also change the income gap and thus have an impact on Gini coefficient.

Influence of Distribution on the Economic Cycle
Note: Solid lines represent the circular relations and dotted lines refer to the influencing mechanism.
2.3 The Mechanism of Distribution Affecting the Economic Cycle on the Supply Side
Adjustment of income distribution is reflected by the changes of wage in kind, which further influence the technology choice and R&D direction of production entities and therefore the supply-side production efficiency.
Total labor productivity can be adopted to measure production efficiency. Total labor productivity (TLP) refers to quantity of products that can be produced in one unit labor time. “Labor time” includes both materialized labor time incorporated in means of production and living labor time of workers’ labor. In the linear production model, (a,l)→1 represents production technology and means that to produce one unit product requires input and consumption of a unit of means of production and l unit of living labor. The ratio between means of production and living labor is fixed. 1− a > 0 satisfies the possible condition of net output. λ represents the magnitude of value of unit commodity, which is measured by socially necessary labor time:
The reciprocal of λ is TLP. Obviously, smaller a and l lead to higher TLP.
The theory of modern mechanical industry based on materialist conception of history points out that human society promotes the development of productivity by replacing labor with machines. Marx emphasized that the technological composition of capital and its determined value composition would keep increasing, which is named by follow-up research as “capital-using and labor-saving technology” (CU-LS technology) (Roemer, 1981). Using machines to produce machines, extend the production chain, construct the machine system, and realize industrialization is the inevitable path towards modernization.
Political economics holds that in a market economy, use of technology serves the need of capital for making profits, which defines profitability as the key factor for technology choice and R&D. To this end, the determination of the profit rate need be introduced:
b, p and r respectively refer to wage in kind, production price and average profit rate. For a single-department model, production price can be standardized as 1. Apparently, rising b will result in declining r, reflecting the antagonism between wage and profit.
On the static level, with the given technology (a,l)→1 , wage in kind b has its boundary. bmin is defined as the minimum amount of consumption to maintain the reproduction of labor force, i.e. the lower bound of wage in kind. According to the Formula (1), magnitude of value of commodities is λ a + l = λ, and living labor l is the added value. Necessary labor time λbl is distributed to workers as wage and the remaining part l −λbl > 0 turns into accumulation for expanded reproduction. The result is TLP = 1/λ > b, indicating that wage in kind has to be smaller than TLP. On such basis, the minimum amount of consumption required by unit labor to repreduce and the quantity of commodities produced in unit labor time are respectively the lower and upper limits of wage in kind:
On the dynamic level, changes of wage in kind b will influence technology choices and R&D strategies of capital and further affect technical change. Okishio (1961) and Roemer (1981) proposed that capital makes technology choices according to the cost-saving principle. In the case of rising wages in kind, capital will inevitably choose to reduce labor-using technologies, which usually increase the use of means of production (Foley and Michl, 1999). As far as the long-term changing trend of profit margins is concerned, as the organic composition of capital determined by technical composition of capital increases, Marx made the point of the long-term declining of profit rate. Later, however, some scholars held that under the condition of given price of production means, technology choice based on the cost-saving principle would inevitably cause rising profit margins. However, research has proven that the conclusions are applicable only to the technical changes that are “once and for all”, and if technology diffusion is allowed to exist, the law of declining profit rate still applies (Qiao and Li, 2021). In the process of technology diffusion, some producers will be encouraged by excess returns to use new high-efficiency technologies first, but when the new technologies are adopted by all producers as a result of diffusion, excess returns will disappear and average profit margins will decline.
According to the static and dynamic analysis, the influence of distribution on technology can be summarized as follows. First, capital seeks to make profit, and wage adjustment will affect the direction of technical change by changing profit. Second, from the perspective of technical composition of capital, capital will, in accordance with increasing or decreasing wage, select technologies of varying ratios between machines and labor input. Third, based on the materialist conception of history, changing wage in kind will affect technical change. In its study on the technical change, political economics pays attention to three areas: whether it is CU-LS technical change in the dimension of technical composition and organic composition of capital, whether TLP is improved in the dimension of production efficiency, and whether the rate of profit are lowered in the dimension of profit margins. If the answer is “yes” in all of the three dimensions, the technical change can be called Marx-biased Technical Change (MBTC). MBTC reflects the technical change characteristics of industrialization in history, and it is accompanied by wage rise.
Though technical progress and efficiency improvement can consolidate the material foundation and raise the “ceiling” of the products available for distribution, they are not key determinants of distribution, which is mainly decided by ownership. The relations between wage and technology can be summarized as follows. First, wage affects technology. Although wage is not the sole influencing factor, changes of wage influence technology choice. Second, technology affects wage in return, but technical advance does not necessarily bring higher wage. If we correspond technology (production efficiency) and wage (income distribution) respectively to productivity and production relations, the two exactly reflect the dialectical relationship between productivity and production relations.
2.4 The Mechanism of Distribution Affecting the Economic Cycle on the Demand Side
Different social groups differ in their goals and behaviors. Distribution in different proportions among the groups inevitably produces differentiated characteristics of aggregate demand and further affects expanded reproduction.
A model including capital owners, laborers international trade is considered. Aggregate demand of this economy consists of consumption, investment, and net exports. Assume laborers spend all their wages to consumption, while capital owners use the surplus for investment in addition to consumption. Consequently, exogenous changes of wage in kind will affect aggregate demand and level of capacity utilization. On the basis of the previous assumption, define the stock of production means owned by the society in the period t as Kt and labor force as sufficient. When Kt is fully utilized, output is xt = Kt / a. Define the equilibrium output determined by aggregate demand as
If output is xt, means of production consumed to make up for simple reproduction is axt and labor consumption is blxt. Assume consumption and new investment of capital owners as Ct and It respectively and Et as net exports, the supply-demand relations of social reproduction is:
By fixing the ratio between consumption and investment of capital owners, we have Ct = hIt and h > 0 . The equilibrium output is:
σ means aggregate expenditure multiplier. Because (a,l) and b need to meet the condition for the existence of surplus and profit, we have 0 < 1− (a + bl) < 1 , σ > 1 . The dynamic equation of capital stock leads to accumulation rate gt:
According to Formula (6), we get ∂σ / ∂b > 0 . Political economics holds that profit rate determines the willingness of capital for accumulation, meaning I = I (r) and I' (r) > 0 . Accordingly, we get the relations of transductive relation among profit margin, accumulation rate, equilibrium output, and capacity utilization rate.
In combination with ∂r / ∂b < 0 and I' (r) > 0 , we get ∂I / ∂b < 0 . Suppose external demand remains unchanged. Then the increase of wage in kind will affect the size of equilibrium output in the two channels of consumption effect (or multiplier effect) and investment effect, but in opposite directions, making the total influence uncertain. In the case of ∂δ / ∂b > 0, we call it “wage-oriented economy”, while in the case of ∂δ / ∂b < 0, we call it “profit-oriented economy”. Mathematically speaking, the exact type of economy depends on the sensitivity of accumulation to changes with profit rate. On the level of production relations, differences of the two types of economy are reflected by the space of cooperation between labor and capital (Bhaduri and Marglin, 1990).
2.5 Influence of Wage Adjustment in Distribution on Labor Income Share and Income Gap
Previous discussion of distribution focuses on the adjustment of wage, while relations between wage and profit necessarily influence income distribution. Though income gap includes that among laborers and among capital owners, the gap reflected by labor income share is obviously the principal contradiction; in another word, with constant number of laborers, higher labor income share results in smaller income gap. This stand is shared by political economics and western economics (Piketty, 2014 and 2016).
To study the relations between wage and labor income share with models, we use l to represent the value created by living labor and λbl to represent the value of labor force. Then λbl / l = λb is labor income share in the dimension of unit commodity value, and for a linear production system, social labor income share with total production taken into consideration remains λb . Therefore, wage in kind b and TLP ( TLP = 1 / λ) are important influencing factors for labor income share. In other words, wage and its relative change with TLP will affect the changing trend of labor income share. If TLP outgrows wage, distribution tilts in favor of capital, causing labor income share to drop; conversely, distribution tilts in favor of labor, driving labor income share to rise. If TLP is used to represent level of productivity development and wage to reflect production relations, the dynamic changes of labor income share are a concrete manifestation of the movement of productivity and production relations.
2.6 The Logic of Socialist Reproduction with Chinese Characteristics and Reshaping of the Economic Cycle
In the study of China’s economic issues by applying the theory of social reproduction, it is important not only to pay attention to the allocation of aggregate social labor in the proportion of the two categories, but also to analyze the logic of socialist social reproduction with Chinese characteristics based on China’s basic economic system. In the socialist market economy with Chinese characteristics, the dialectical unity of production, distribution and exchange is reflected as follows. The ownership structure of means of production, which keeps public ownership as the mainstay of the economy and allows diverse forms of ownership to develop side by side, is the core of the basic socialist economic system. On such basis, the distribution system, in which distribution according to work is dominant and a variety of modes of distribution coexist, and the socialist market-based economic system is practiced. Socialist reproduction with Chinese characteristics adheres to public ownership as the mainstay of the economy and gives full play to the leading role of the state-owned sector of the economy. Meanwhile, it encourages, supports, and guides non-public sector of the economy to play a role in supporting growth, promoting innovation, expanding employment, and increasing taxes.
The form of economic cycle in social reproduction needs to be adapted to the tasks and goals at particular development stages and the domestic and international environment. In the course of history, the form exhibited different features in various historical periods in China (Qiao, 2021). Specifically, the economic development after New China was founded went through three stages. During the first stage, on the basis of the completed socialist revolution, socialist construction proceeded by adopting the planned economic system mainly in the domestic economic cycle, and a complete set of industrial system and national economic system were set up, taking the first leap in industrialization “out of nothing”. At the second stage, China promoted socialist modernization after reform and opening up, gradually set up the socialist market economic system, and mainly relied on the international economic cycle to participate in economic globalization and solve capital, technology and market issues, realizing the second leap of “growing larger” in industrialization. At the third stage as we are in currently, the 5th economic cycle has turned into depression since the global financial crisis in 2008, resulting in sluggish economic growth worldwide and normalized capitalist economic stagnation. Socialism with Chinese characteristics has entered a new era. In order to fulfill the tasks of achieving the first centenary goal and beginning a new journey towards the second centenary goal, the Communist Party of China has implemented the national rejuvenation strategy within the wider context of once-in-a-century changes taking place in the world and made new scientific judgments accordingly. On the one hand, with demand declining and uncertainty rising in the international market, Chinese economy that has been deeply globalized is objectively required to balance security and development and gradually shift from international economic cycle to domestic economic cycle. On the other hand, though China is already a large economy in industrial manufacturing, the imbalanced structure with insufficient high-end manufacturing and surplus low-end manufacturing remains prominent. This requests China to adapt to the changes of the environment and foster a new development dynamic to take the third leap of “growing stronger” in industrialization and consolidate the material production foundation in Chinese path to modernization.
According to the previous theoretical discussion on adjusting income distribution to promote reshaping of the economic cycle, this paper proposes a systematic framework of empirical analysis (Figure 2) and comprehensively studies China’s economic development since 2000. The framework involves the influencing mechanisms for nine sets of variables. Specifically, they are:  rising labor income share causing the Gini coefficient to drop;
 increase of hourly wage resulting in the increase of labor income share;
 higher organic composition of capital leading to higher TLP;
 higher organic composition of capital simultaneously leading to lower profit rate;
 relative changes between TLP and hourly wage;
 decline in share of external demand causing capacity utilization rate to drop in export-oriented sectors;
 higher hourly wage bringing about lower profit rate;
 drop of profit rate bringing down capacity utilization rate through accumulation willingness;
 higher hourly wage driving capacity utilization rate to climb through higher consumption.

Overall Framework of the Empirical Analysis
3 Empirical Analysis [1]
3.1 Distribution: Hourly Wage, Labor Income Share and Gini Coefficient
Figure 3 shows the changes of labor income share (magnitude of value) during 2002–2020, dropping first from 48.12% in 2002 to 42.78% in 2005 and then rising in fluctuation to 49.68% in 2020. It also illustrates three types of labor income share in monetary forms, basically consistent with the trend of the share calculated in magnitude of value.

Comparison of the Four Types of Labor Income Share
Source: Calculated with statistics from the National Bureau of Statistics of China.
On such basis, and
and in Figure 2 are verified.
 represents the influence of labor income share on the Gini coefficient and
  the influence of hourly wage on labor income share. The Gini coefficient issued by the National Bureau of Statistics climbed from 0.4730 in 2004 to 0.4910 in 2008 and then dropped to 0.4620 in 2015 before a mild rebound. Figure 4 (a) shows the scatter diagram of labor income share (magnitude of value) and Gini coefficient. With the two being negatively correlated, increase of labor income share narrows down the income gap. Under constant labor input, wage becomes the primary influencing factor for labor income share. The industry-wide average hourly wage in 2002–2020 rose from RMB4.50/hour in 2002 to RMB 19.21/hour in 2020. Figure 4 (b), the scatter diagram of hourly wage and labor income share, reflects positive correlation between the two, which means higher hourly wage drives labor income share to climb.

Relations of Hourly Wage, Labor Income Share and Gini Coefficient
3.2 Supply Side: Changing Organic Composition of Capital during Industrial Accumulation
Under the leadership of the CPC, New China established a full-range modern industrial system almost from scratch and realized the historic transformation from a poor agricultural country to the world’s No.1 manufacturing economy. Its deep involvement in globalization further accelerated the industrialization process especially after China’s entry into the World Trade Organization. Denominated in renminbi current price, China’s industrial value-added was RMB 4.57 trillion in 2000, over RMB10 trillion in 2006, and up to RMB38.43 trillion in 2020. The share of China’s manufacturing value-added in the world exceeded 10% in 2006 and reached 28.55% in 2020. The acceleration of industrialization was inseparable from industrial accumulation. Since 2000, the country’s new investments in fixed assets were concentrated in manufacturing, infrastructure construction and real estate. In particular, the new fixed assets investments in manufacturing occupied a share of 21.28% in 2000, 31.67% in 2004, reached the peak of 42.94% in 2012, and though the share dropped afterwards, yet still remain as the top among industries. Investments in real estate and infrastructure construction, the other two among the top three, were indeed related with the course of urbanization driven by industrialization as well and could be taken as the necessary support and extension of manufacturing accumulation.
The industrialization is featured by CU-LS technical change and the organic composition of capital in the production sector rises accordingly. The changes of the average organic composition of capital in China’s production sector in 2002–2020 are illustrated in Figure 5. The organic composition of total capital significantly increased from 4.71 in 2002 to 7.50 in 2010 and then fluctuated for a while before dropping to 6.64 in 2020. Overcapacity has already emerged as a problem in China since 2015, while the supply-side structural reform sought to restrain the excessive growth of organic composition of capital and mitigate its negative impact on profit margins by slowing down the growth of fixed capital.

Changes of the Organic Composition of Capital
3.2.1 Influence of the Organic Composition of Capital on TLP and Average Profit Rate
With the trend of the organic composition of capital being identified, two direct relations can be further verified, namely the influence of organic composition of capital on TLP, andthe influence of organic composition of capital on average profit rate in Figure 2.
For production sectors, a panel data model is constructed for analysis. Define TLPit of production sector i as an explained variable and its organic composition of fixed capital tkit and organic composition of working capital tait as explanatory variables. Given the different technical structures across production sectors, the fixed effect of production sectors is used for regression and the random effect for verification. An econometric model is developed as follows:
 . The econometric model is:
According to Table 1, organic composition of capital, mainly that of fixed capital, shows significant positive influence on TLP, and TLP of other production sectors also plays a significant positive role of improvement. Meanwhile, the influence should also be analyzed in combination with capacity utilization rate. In the case of full utilization, rising organic composition of capital usually means higher level of industrialization and therefore helps with higher efficiency of production. In the case of overcapacity, however, declining organic composition of capital as a result of “cutting overcapacity” can help reduce cost rather than producing effects on production efficiency.
The Influence of Organic Composition of Capital on TLP
| TLP |
||||
|---|---|---|---|---|
| Department fixed effect | Department fixed effect | Random effect | Random effect | |
| Organic composition of fixed capital | 4.2094*** (9.4533) | 2.3040*** (3.3823) | 3.5329*** (7.7707) | 2.4233*** (4.1494) |
| Organic composition of working capital |
0.2523 (0.2925) |
−0.2768 (−0.5413) |
−0.2165 (−0.4914) |
−0.3819 (−1.5293) |
| Other industries TLP impact | − | 1.9917*** (14.4861) | − | 1.7845*** (13.6628) |
| Constant term | 15.9625*** (3.3337) | −4.1345 (−1.5324) | 21.6773*** (6.7163) | −0.7285 (−0.3301) |
| Observed value | 270 | 270 | 270 | 270 |
| Adjusted R2 | 0.1671 | 0.7793 | 0.3141 | 0.6851 |
Note: Value in parentheses for fixed effect is t-value under cluster-robust standard errors and that in parentheses for random effect is z-value under cluster-robust standard errors. *, ** and *** respectively refer to significance at the 10%, 5% and 1% level. Adjusted R2 in fixed effect is the within value in the regression result, and adjusted R2 in random effect the overall value in the regression result.
In verification of in Figure 2, i.e. the relations between organic composition of capital and average profit rate, Figure 6 (a) illustrates the changes of average profit rate in 2002–2020, dropping from 17.44% in 2002 to 10.16% in 2015 and then rebounding to 13.96% in 2020. Figure 6 (b) is the scatter diagram between organic composition of total capital and average profit rate, demonstrating a negative correlation between the two. In another word, rise in organic composition of capital causes profit margins to decline.
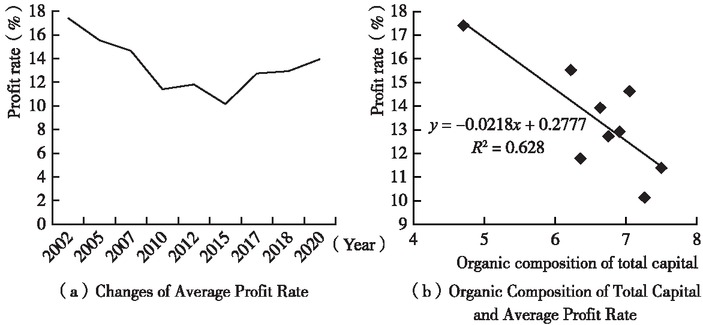
Relations between the Average Profit Rate and the Organic Composition of Capital
3.2.2 Relative Changes of TLP and Wage
 in Figure 2 describes the relative change of TLP and hourly wage. Specifically, TLP reflects the output in unit labor time, while hourly wage measures labor income for unit time. Figure 7 compares the TLP growth and average hourly wage growth of production sectors in 2002–2020. The fact that hourly wage gradually outgrew TLP after 2005 up until 2015 indicated income distribution in this period turned in favor of labor income, which echoed the aforesaid rising labor income share in 2005–2015. After 2015, growth of hourly wage approached and turned slightly lower than that of TLP, while the rising trend of labor income share in the same period gradually weakened and turned downward.

TLP Growth and Hourly Wage Growth of Production Sectors
TLP determines the upper bound of hourly wage, but TLP improvement doesn’t necessarily mean corresponding raise of hourly wage. Relative changes between the two depict the basic pattern of income distribution. Define hourly wage wait of production sectors as an explained variable and TLPit an explanatory variable, and analyze if changes of the two share common features with the panel data model of production sectors. Given that sectoral characteristics are related to the influence of efficiency on wage, we use the fixed effect of production sectors for regression and the random effect for verification. The econometric model is as the Formula (10), with μi and eit respectively representing the fixed effect of production sectors and error term.
Table 2 indicates the significant positive correlation between TLP and hourly wage. Hourly wage has been continuously growing along with the rapid rise of TLP in China since 2000, meaning laborers had access to the benefit of efficiency improvement.
The Panel Model Estimation of the Influence of TLP on Hourly Wage of Production Sectors
| Hourly wage |
|||
|---|---|---|---|
| Fixed effect | Random effect | ||
| TLP | 0.3074*** (15.5547) | 0.3024*** (15.5051) | |
| Constant term | 1.4958** (2.1556) | 1.6727*** (4.5129) | |
| Observed value | 270 | 270 | |
| Adjusted R2 | 0.8585 | 0.6762 | |
3.3 Demand Side: Changing Capacity Utilization Rates in the Context of Dual Circulation
Shortly after the reform and opening up, China, with its relatively low productivity and low per capita income, needed to introduce necessary capital, technology and market from the international economic cycle to advance industrialization. After its entry into the WTO, China deepened its participation in the international division of labor and grew into a large industrial economy based on the export-oriented economic system. The situation, however, changed as global financial crisis broke out. Political economics believed that the current world system is dominated by capitalism and the global financial crisis is the point where the fifth capitalist economic cycle turned from expansion to depression. Therefore, the change of the external environment was in nature the structural adjustment of the world system as a result of the basic contradiction of capitalism. It was not subject to the influence of any economy and requested participating economies to finish economic restructuring accordingly (Qiao and Wang, 2021). As a result, along with the evolvement of the world system and the outbreak of structural contradictions, China’s structure of domestic and international economic cycles changed apparently (Huang and Ni, 2021). Figure 8 shows the share of net export in GDP in China, which changed after the turning point of global financial crisis. Since 2000, China has been maintaining trade surplus, with the share of net export in GDP reaching the peak 8.66% in 2007, dropping to 0.77% in 2018, and rebounding to 2.59% in 2020. The accelerated industrialization in the international economic cycle was also reflected in the balance of international payments. In addition to the accelerated growth in current account surplus, introduction of foreign investment also resulted in long-term surplus of capital account and financial account. Though the “twin surpluses” helped accumulate foreign exchange reserves, it caused loss of efficiency (Lu and Yu, 2012).

China’s Share of Net Export in GDP
Capacity utilization rate reflects economic operations on the level of value realization. Figure 9 displays the changes of average capacity utilization rate in 15 manufacturing sectors. [1] According to the result, China’s capacity utilization rate gradually declined since 2002, hitting the bottom in 2010, and then rebounded in fluctuation.

Change of Average Capacity Utilization Rate
Influencing factors for capacity utilization rate can be categorized into external demand and internal demand. Stronger external demand usually drives the rate of export-oriented industrial sectors to rise. In order to verify in Figure 2, i.e. influence of external demand on capacity utilization rate, this paper constructs a panel data model for eight export-oriented sectors out of 15 manufacturing sectors. Define capacity utilization rate capit of industrial sector i as an explained variable and share of net export in total output rhit of industrial sector i as an explanatory variable for regression. Given the connection between such influence and characteristics of the technical system of the period, the paper adopts time fixed effect for regression and random effect for verification. The econometric model is as the Formula (11), with zt and eit respectively representing the time fixed effect and error term.
In further consideration of the correlation across sectors, the paper holds that external demand of other manufacturing sectors may produce influence on capacity utilization rate of a sector that simultaneously provides products to other manufacturing sectors. The influence is conducted as downstream sectors purchase intermediate products from particular upper-stream sectors and reflected as backward linkage effect, which can be measured with the direct distribution coefficient. The sum of products of rhjt of other manufacturing sectors and corresponding direct distribution coefficient σijt is introduced as a control variable for regression to further verify . The econometric model is:
The regression result in Table 3 reveals that external demand of an export-oriented manufacturing sector has significant positive influence on its capacity utilization rate. Influence of the share of net export of other sectors is less significant and the coefficient value of explanatory variables before and after including the share of other industries differs only mildly, indicating capacity utilization rate of export-oriented manufacturing sectors is mainly subject to the impact of their own external demand. External demand can be taken as an exogenous variable because of its susceptibility to the world system and economy of importing countries. In case of intended trade frictions initiated by other countries, export-oriented sectors may be affected by the external demand. It’s therefore necessary to judge the trend of the world system and adjust the relations between domestic and international economic cycles in time to stabilize local economy.
Influence of the Share of Net Export in Total Output Value on Capacity Utilization Rate
| Capacity utilization rate |
||||
|---|---|---|---|---|
| Time fixed effect | Time fixed effect | Random effect | Random effect | |
| Share of net export in total output value of an industry | 5216.5997*** (6.2240) | 5072.9722*** (6.0606) | 4613.7371*** (4.2048) | 4510.5796*** (3.3361) |
| Influence of net export share in total output value of other industries | − | 2195.8990 (1.3581) | − | 1553.5802 (0.6056) |
| Constant term | 316.1847** (2.8918) | 302.6858** (2.7543) | 394.8313*** (3.1901) | 385.4821*** (3.2603) |
| Observed value | 72 | 72 | 72 | 72 |
| Adjusted R2 | 0.5793 | 0.5897 | 0.3453 | 0.3491 |
In addition to external demand, influence of internal demand on capacity utilization rate can be studied as well. Hourly wage produces indirect influence on investment through profit rate, as embodied in and
and in Figure 2, and poses direct influence through consumption, as reflected by
 in Figure 2. In summary, hourly wage affects capacity utilization rate both directly and indirectly.
As to the indirect channel, the scatter diagram of average hourly wage and average profit rate (see Figure 10) can be drawn to verify in Figure 2. The diagram shows features of negative correlation between the two, with rising hourly wage causing profit rate to drop. This, however, is not evident for the reason that changes of profit rate are related not only with wage, but also with organic composition of capital.
 can be studied by constructing a scatter diagram of profit rate and capacity utilization rate of manufacturing sectors (see Figure 11), indicating positive correlation. In the direct channel, rising hourly wage will curb profit rate, which is accompanied by decrease of capacity utilization rate. At the stage of industrialization, investment is an important driving force of economic growth. China’s total investment in fixed assets and gross fixed capital formation in 2000–2020 both declined in growth, consistent with the downward trend of profit rate.

Scatter Diagram of Average Hourly Wage and Average Profit Rate

Scatter Diagram of Average Profit Rate and Average Capacity Utilization Rate
With respect to the direct channel, in which wage affects capacity utilization rate through consumption, higher hourly wage helps expand consumption and drive up capacity utilization rate.
Through both channels, wage poses uncertain influence on capacity utilization rate. In the scatter diagram of hourly wage and capacity utilization rate (see Figure 12), the period 2002–2010 corresponds to the scatter points on the left side and the slope of fit line is negative, indicating decreased capacity utilization rate along with rising hourly wage in the period and main influence is through the indirect channel. The period 2010–2020 corresponds to the scatter points on the right side and the slope of fit line is positive, showing primary influence is from the direct channel. Does this justify the judgment that after the turning point of 2010, Chinese economy turned from profitoriented to wage-oriented? If the judgment is valid, it means the changes with internal industrial accumulation and external relations between domestic and international economic cycles drove the basic logic of Chinese economic growth to change accordingly. Furthermore, advancing common prosperity and promoting accelerated Chinese economic transformation with domestic circulation as the mainstay will be necessary and feasible and become the empirical evidence for adjusting income distribution and reshaping China’s economic cycle.

Scatter Diagram of Average Hourly Wage and Capacity Utilization Rate
4 Conclusions and Policy Implications
This paper mainly studies the influencing mechanisms of income distribution adjustment on the economic cycle based on political economic principles and explores effective approaches for fostering a new development dynamic and enhancing the internal driving force of domestic economic cycle. If the labor-favored distribution structure brings about greater effect of consumption improvement than effect of investment reduction, it will be feasible to promote social reproduction to transform towards the new development dynamic with domestic economic cycle as the mainstay in advancing common prosperity. Based on such theoretical analysis, the paper gradually verifies that Chinese economy at the new development stage has already shown features of transition from profit-oriented to wage-oriented economy and further demonstrates the necessity and feasibility of making progress in common prosperity to facilitate the reshaping of Chinese economic cycle.
The important articles of President Xi Jinping fully elaborated on the goals, principles, thoughts and strategies of making solid progress in common prosperity (Xi, 2021), which has became the programmatic documents for China to promote common prosperity. On such basis, this paper summarizes and interprets the policy framework in the logic of political economy as follows. First, the crucial prerequisite of making progress in common prosperity is to continuously increase TLP and keep its growth basically at par with wage growth. Second, the institutional foundation of common prosperity is to adhere to public ownership as the mainstay of the economy, carry out distribution according to work, and consolidate the material foundation of state economic regulation. Third, realization of common prosperity requires not only “efficient market”, but more importantly “promising government”. Fourth, in terms of the spatial structure of promoting common prosperity, concentration of production and unified market should be the pivots to promote efficiency improvement and spatial balance in the per capita sense.
References
Bhaduri, A., & Marglin, S. (1990). Unemployment and the Real Wage: The Economic Basis for Contesting Political Ideologies. Cambridge Journal of Economics, 14(4), 375–393.10.1093/oxfordjournals.cje.a035141Suche in Google Scholar
Foley, D., & Michl, T. (1999). Growth and Distribution. Cambridge: Harvard University Press.Suche in Google Scholar
Gao, P. (2013). The Income Distribution System Reform Based on the Tax Reform. Economic Research Journal (Jingji Yanjiu), 3, 8–9.Suche in Google Scholar
Huang, Q., & Ni, H. (2021). Measurement of Domestic and International Double Cycle of China’s Economy: The Essential Characteristics of the New Development Pattern. Journal of Management World (Guanli Shijie), 12, 40–58.Suche in Google Scholar
Li, S. (2021). China’s Goal and Paths of Common Prosperity. Economic Research Journal (Jingji Yanjiu), 11, 4–13.Suche in Google Scholar
Lu, F., & Yu, Y. (2012). “Double Surplus”, Capability Gap and Innovation: A Macro- and A Micro- Perspective on the Transformation of the Chinese Mode of Economic Development. Social Sciences in China (Zhongguo Shehui Kexue), 6, 91–114+207.Suche in Google Scholar
Okishio, N. (1961). Technical Changes and the Rate of Profit. Kobe University Economic Review, 7(1), 85–99.Suche in Google Scholar
Pei, C., & Liu, H. (2021). Research on the Scientific Connotation of New Development Pattern. China Industrial Economics (Zhongguo Gongye Jingji), 6, 5–22.10.1515/cfer-2021-0014Suche in Google Scholar
Piketty, P. (2014). Capital in the Twenty-First Century (Ba, S., Chen, J., Yu, J., Zhou, D., Li, Q., & Tang, D., translated). Beijing: China CITIC Press. (In Chinese)10.4159/9780674369542Suche in Google Scholar
Piketty, P. (2016). The Economics of Inequality (Zhao, Y., translated). Beijing: China Renmin University Press. (In Chinese)Suche in Google Scholar
Qiao, X. (2021). The Logic and Experience of Coordinating the Dual Circulation to Advance Industrialization by the Communist Party of China. Study & Exploration (Xuexi Yu Tansuo), 10, 97–105.Suche in Google Scholar
Qiao, X., & Li, X. (2021). Heterogeneous Capital and Technological Changes: A Rethinking of the Theoretical Flaws of Roemer’s Theorem. The Journal of World Economy (Shijie Jingji), 11, 3–26.Suche in Google Scholar
Qiao, X., & Wang, Y. (2021). A Mathematical Analysis of Long Waves Theory and Its Enlightenment to the New Development Pattern: In Memory of Mr. Gao Feng. China Review of Political Economy (Zhengzhi Jingjixue Pinglun), 2, 36–61.Suche in Google Scholar
Roemer, J. (1981). Analytical Foundations of Marxian Economic Theory. Cambridge: Cambridge University Press.10.1017/CBO9780511528286Suche in Google Scholar
Xi, J. (2021). Making Solid Advances toward Common Prosperity. Qiushi Journal (Qiushi), 20, 4–8.Suche in Google Scholar
Xi, J. (2023). Accelerating the Creation of a New Development Dynamic and Taking the Initiative in Development. Qiushi Journal (Qiushi), 8, 4–8.Suche in Google Scholar
© 2023 Xiaonan Qiao, Xin Li, Peizhi Pu, published by De Gruyter
This work is licensed under the Creative Commons Attribution 4.0 International License.
Artikel in diesem Heft
- Frontmatter
- Common Prosperity and Reshaping China’s Economic Cycle: Theoretical Logic and Empirical Evidence from a Political Economic Perspective
- Globalization and Inflation
- Digital Transformation, Information Search, and Women’s High-Quality Employment
- Fiscal Pressure, Inter-Industrial Allocation of Land and Agglomerations Effects
- Analysis on Trade Gains from the Economic Dual Circulation in China
- Digital Trade Rules and the Position of Chinese Enterprises in the Global Value Chain