
Theoretical Logic and Empirical Facts of Consumption Structure Upgrade and Domestic Value Chain Circulation under the New Development Pattern
-
Bin Liu
 und
Qiujing Li
und
Qiujing Li

Abstract
Under the new development pattern, this paper explores the characteristic tendencies and intergenerational changes of consumption structure upgrade (CSU) as well as the theoretical logic and empirical paradigm affecting the domestic value chain circulation. This paper constructs a region-industry decomposition framework for domestic value chain circulation based on backward demand to explore the impact of CSU on domestic value chain circulation. The results show that: first, CSU can optimize the structure of domestic value chain circulation and strengthen inter-regional value chain linkage; second, CSU promotes domestic value chain circulation through innovation drive, resource optimization and industrial coupling; finally, the domestic value chain circulation effect caused by CSU may be constrained by market segmentation, and accelerating regional economic integration across a country can help build up the main position of domestic value chain.
1 Introduction
In May 2020, the meeting of the Standing Committee of the Political Bureau of the CPC Central Committee pointed out that China should “further the supply-side structural reform to give full play to its super-large market advantages and domestic demand potentials and building a new development pattern in which domestic and international circulations reinforce each other”. In March 2021, the Outline of the 14th Five-Year Plan (2021–2025) for National Economic and Social Development and the Long-Range Objectives through the Year 2035 of the People’s Republic of China pointed out that “strategies to expand domestic demand will be implemented to enhance the role of consumption in economic growth and allow investment to play a key role in improving the supply structure. This shift is expected to lead to a stronger domestic market and stronger demand for consumption and investment”. Therefore, accelerating the construction of a new development pattern and promoting consumption across the board is not only a long-term strategy to adapt to the restructuring of global value chains, but also a strategic choice to comply with the deepening and upgrading of the domestic division of labor.
With a strong resilience to external shocks, high-quality effective demand is an important base for promoting China’s value chain circulation. Although China has played a core role in the global division of labor (Ju et al., 2020), it is undeniable that the global value chain system is still dominated by multinationals of developed countries. China not only faces the dilemma of “low-end locking” and lacks the division-of-labor dominance and pricing advantage, but also are confronted with the dilemma of its global value chain status being “double-sided attack”. Due to the US-China trade friction and the COVID-19 outbreak, the international supply chain has been hit hard, and even some cutting-edge industries are facing the risk of decoupling. However, opportunities originate in the crisis.
As the core link to unleash the potential of domestic demand market, the CSU enhances inter-regional R&D cooperation by stimulating companies’ indigenous innovation. The optimal allocation of supply factors across regions is achieved by improving the allocation efficiency of resources. The value chain circulation across regions is promoted by strengthening intra-product division of labor networks and inter-industry integration and complementarity. In summary, the CSU can link the domestic value chain circulation through demand and supply-demand matching.
This paper examines the effect characteristics and path dependence of CSU on the domestic value chain circulation and explores the feasible path and model for China to enhance the main position of domestic value chain under the new development pattern. Contribution margins are embodied in the following three aspects. First, the two key characteristic variables of CSU and domestic value chain circulation under the new development pattern are incorporated into the theoretical analysis framework. The characteristic facts and structural evolution of CSU and domestic value chain circulation are elaborated to reveal the conditions, basis and mechanism of the linkage of CSU with domestic value-added trade and deduce the interaction mechanism of “CSU–innovation drive, resource optimization and industrial coupling–value creation”. Second, based on the value-added analysis framework at the region-industry level, this paper measures value chain indicators such as internal value added of regional consumption and value added of extraterritorial inflows. It also econometrically tests the impact of CSU on domestic value chain circulation and its structure as well as the internal mechanism of action, thus providing theoretical support and empirical evidence for enhancing the main position of domestic value chain circulation under the new development pattern. Third, the CSU usually leads to cross-regional industrial linkages, which are inevitably constrained by the integration of domestic markets. On this basis, this paper further examines the moderating role of domestic market segmentation.
The rest of this paper is structured as follows. The second part is a literature review; the third part is the characteristic facts of CSU and domestic value chain circulation; the fourth part is the theoretical logic of CSU driving domestic value chain circulation; the fifth part is the idea and framework of indicator measurement and econometric model; the sixth part is the econometric results, mechanism and extension analysis; and the final part is the conclusion and insight.
2 Literature Review
The study on the evolution of CSU can be traced back to Marx who made the initial division of consumer goods in his work Capital (1953), with the issue of consumption structure receiving theoretical attention. Marshall (2011) creatively introduced the consumption structure into the Western classical system for economic theories, which laid a theoretical foundation for studying consumption structure.
In recent years, the phenomenon of domestic CSU has sparked continuous attention from the academic community. All the literature mainly argues that the CSU is a basic prerequisite for promoting industrial technological progress and forming a virtuous cycle of economic development (Aoki et al., 2002; Acemoglu and Joshua, 2004; Fan, 2007; Yu and Fang, 2015; Yang and Chen, 2018). Some scholars have analyzed the impact mechanism of CSU on economic development from different perspectives. First, the CSU affects the upgrading of industrial structure. The promotion effect of CSU on industry upgrading is embodied in the Engel effect and Baumol effect. The former is a direct effect that the CSU may increase the demand for higher-level consumer goods and services, thus driving industry upgrading. The latter is an indirect effect that the CSU may enable investors to adjust their expectations of related industries, which may influence the flow of production factors and ultimately result in industry restructuring (Xu and Zhang, 2020). Second, the CSU boosts the high-quality development of economy. The new consumption model has stronger growth dynamics, thus leading to inter-industry transfer of capital and labor factors. The consumption structure causes changes in the production structure, which results in structural changes in the economy (Ngai et al., 2007; Foellmi and Josef, 2008; Li and Gong, 2012; Yan et al., 2018). The existing studies provide a valuable reference for this paper to recognize and understand the impact of CSU on the China’s economy, but the existing literature has not yet involved such an impact on the domestic value chain circulation.
For a long time, scholars at home and abroad have conducted extensive and in-depth research on the issue of global value chains. A domestic value chain refers to a production system based on the geographic division of labor by comparative advantage of each region within a sovereign country, emphasizing the allocation and integration of domestic resources (Li, 2016). The importance of domestic value chains to China’s economy has been recognized by a growing number of scholars (Su, 2016; Li and Pan, 2016). However, most existing studies focus on the relations between domestic and global value chains. Hong and Shang (2019) studied China’s position and ascending path in the international “conjoint circulation”, discovering that the space for Chinese enterprises to integrate themselves into global value chains and achieve the ascending status of division of labor was being narrowed. Sheng et al. (2020) found that participation in both global and domestic value chains could promote economic growth and both global and domestic value chains could complement each other. Li (2020) empirically analyzed China’s embedding behavior into the dual value chains from the perspective of dual value chains, revealing that coastal provinces have mainly participated in global value chains as a role of processors and manufacturers.
There is also a part of the literature that focuses on analyzing the domestic value chain circulation. Su et al. (2019) studied the spillover effects of domestic value chains on economic growth from the perspective of static and dynamic spillovers, finding that domestic value chains enhance the resilience and driving force of economic growth and that the marketization improves the spillover effects of domestic value chains on the economy. Shao et al. (2018) studied the effects of domestic value chains on regional economic synergy cycles, unveiling that domestic value chains strengthen inter-regional economic linkages and industrial synergy.
As the current COVID-19 pandemic and deglobalization pose severe challenges to China’s economy, it has become particularly important to give full play to China’s super-large market advantages and stimulate consumption potentials. Unfortunately, there is a lack of research from the backward demand perspective on the relations between CSU and the domestic value chain circulation. In the past, most of the studies on domestic value chains were conducted from the perspective of inter-provincial trade and international trade but did not take into account the added value of local products absorbed locally. Consequently, it was impossible to obtain the real situation of domestic value chain circulation. Therefore, according to existing studies, this paper analyzes the impact of CSU on domestic value chain circulation from the backward demand perspective.
3 Typical Facts
3.1 Characteristic Facts of Consumption Structure Upgrade
In 2019, China’s retail sales of social consumer goods totaled RMB 41.2 trillion, making the country ranked as the world’s second-largest commodity consumer market. Throughout history, the consumption structure has undergone three upgrades. In the first stage, depressed consumer demand was rapidly released in the period from the beginning of reform and opening up to the early 1980s. In the second stage, from the 1990s to 2012, the opening of market enriched the supply of products in the domestic market and boosted the upgrading of demand. Since the 18th CPC National Congress in 2012, China has been in the third stage of the CSU. The CSU has demonstrated two important features: first, the shift of consumption demand from basic functional consumption to enjoyment-oriented consumption; and second, the shift of consumption to an integrated model of offline experience and online services. After the outbreak of COVID-19, China’s consumer market was hit hard. However, the anti-pandemic efforts have also provided an opportunity to accelerate the CSU, strengthen the cloud consumption underpinned by the internet, big data, AI and other digital technologies, and further empower the service industry to thrive.
3.2 Structural Evolution of Domestic Value Chain Circulation
Before China’s entry into the World Trade Organization (WTO), domestic consumption demand and production capacity were small and domestic value-added trade amounted to USD 1 trillion in 2000. After China joined the WTO, varieties of high-quality products from abroad have surged into the country. National consumption has undergone a period of rapid upgrading, with the proportion of overseas goods consumed at home increasing. In addition, domestic enterprises have drawn on the experiences concerning technology, management and sales of foreign-funded products and enterprises, laying a solid foundation for the expansion of later production capacity. The share of domestic value chain circulation gradually declined to 71.7% in 2006, rising to USD 2 trillion. Afterwards, domestic companies’ technological upgrading and market demand were being unlocked, interregional commodity flows and international trade grew, and the share of the domestic market continued to rise. Domestic value chain circulation reached USD 8.4 trillion or 80.6% in 2014. Figure 1 shows domestic value-added trade statistics based on a backward demand approach, i.e., the value added and the share of domestic production and, ultimately, domestic consumption, over the period from 2000 to 2014. [1] In terms of aggregate volume, output and domestic value chain trade achieved double growth. The total output in 2014 was 8.6 times larger than that in 2000, with a corresponding 8.5-fold increase in domestic value chain trade. From a structural perspective, the trade share of domestic value chain has gone through the stage of decreasing and then leaping up, showing an obvious feature of “smile”.
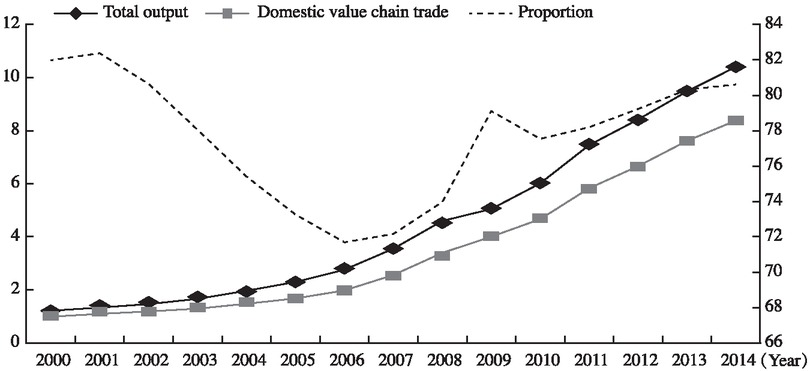
“Smile Curve” of Domestic Value Chain Trade
Note: The unit of main vertical axis is trillion US dollars, and that of auxiliary vertical axis is %. Source: World Input-Output Database (WIOD).
4 Theoretical Logic
This paper argues that the structurally upgraded consumption has a more prominent impact on the domestic value chain circulation than traditional consumption in the three areas such as innovation drive, resource optimization and industrial coupling, as follows.
4.1 Innovation-Driven Effect
The CSU induces companies to make technological innovations and drives innovation in production model changes, which facilitates the domestic value chain circulation (Acemoglu and Linn, 2004). The traditional consumption structure does have a catalytic effect on innovation, but the scale, depth and force of the effect are weaker than the impact of CSU. The CSU means that the focus of consumption changes from basic necessities to non-essentials, thus pushing enterprises to shift from a highly independent production model to a highly collaborative and specialized production model. In addition, the focus increases the R&D and innovation of superior parts and components, accelerates the upgrading of production processes and improves the delivery of service elements. It also forces domestic enterprises to shift their innovation model from imitation to self-reliant development, catering to the high-end, rich and upgraded consumption structure in the domestic market. This is not available in the traditional consumption. [1]
The CSU has presented higher requirements of products in design, R&D and manufacturing, thus enhancing the efforts on cross-regional collaborative R&D and production among enterprises and the domestic value chain circulation. In terms of production linkage, the supply of upstream intermediate goods provides the technology and input base for downstream companies. The demand for downstream intermediate goods forces upstream companies to develop technologies and upgrade products, thus forming a virtuous cycle of upstream and downstream industrial collaboration. Regarding factor linkage, the CSU promotes the inter-regional outsourcing and production of intermediate goods, optimizes the spatial distribution of innovation factors, which facilitates the great circulation of production factors across regions.
4.2 Optimization Effect of Resources
CSU uses the demand to drive the segmentation of production processes, forms a more in-depth and efficient vertical division of labor system and promotes the dynamic coordination and connection of supply and demand, which promotes the inter-regional value-added circulation. Compared with traditional consumption, the resource optimization effect of upgraded consumption is mainly embodied in two aspects: product utility and supply chain efficiency. First, the goods consumption in transportation and the service consumption concerning communication and medical care under the CSU are more convenient and immediate, which gives rise to innovation in consumption models. The CSU demonstrates strong ability to improve efficiency in business models and commercialization of technological inputs, such as AI recognition and search algorithms. This consumption model improves the consumer demand engagement and increases the frequency of products used and customer satisfaction. [1] Second, the CSU requires that the final products and services contain higher technical complexity, which raises the production difficulty of manufacturers and puts forward higher requirements for the quality and responsiveness of supply chain products. In this case, for the purpose of production efficiency and cost saving, companies may split and outsource the production process. In other words, the CSU reconfigures the supply chain model and stimulates companies to optimize the layout and efficiency of the supply chain. [2] Furthermore, the inter-regional allocation of resources and processes is optimized to facilitate developing a more refined network for intra-product value chains.
4.3 Industry Coupling Effect
The industry coupling effect of CSU propels the domestic value chain circulation from two perspectives of intra-product division of labor networks and inter-industry integration and complementarity. Compared with traditional consumption, the higher technical complexity of goods or services in the CSU results in a stronger demand for cross-sectoral elements and a higher level of product demand. [1] To put it differently, by breaking transmission model of traditional production lines and reconfiguring the production logic, the consumer structure upgrade forces enterprises to respond quickly to user demand, thus enabling them to achieve resource cooperation not only in capital, supply chain and sales but also in production synergy among various industries. In terms of the intra-industry division of labor network, the CSU drives forward production with backward demand, prompting enterprises to produce more specialized intermediate goods and final products. Furthermore, it also empowers the interregional division of labor layout and model to evolve toward specialization, gradation and verticalization (Ju et al., 2015). Regarding inter-industry integration and complementarity, the CSU promotes the deep integration of the IT application and industrialization and the dynamic complementarity of production services and manufacturing. In particular, the growth of service consumption gives a stronger boost to industrial integration and domestic value chain circulation. The CSU can drive the mutual input of factors and intermediate goods between industries and facilitate the service-oriented manufacturing and the manufacturing-based service industry. In short, the CSU results in the interaction and integration of business models for manufacturing and the service industry as well as in the integration, complementarity, coordination, coupling and promotion of factors and products.
5 Econometric Analysis
5.1 Ideas and Framework of Decomposition and Calculation of Region-Industry Value Chain
By examining the impact of CSU on the value-added demand from different regional sources, this paper needs to further build an analytical framework for value chain disassembling and measurement that can distinguish the value added from the inflow value added in a region. The decomposition method of Wang et al. (2013) on the backward demand of final products provides a practical solution for this paper to calculate the detailed indicator of region-industry value chain from the perspective of product end-use. However, the data underlying their decomposition method are derived tables of the world input-output table. The decomposition idea is best applied to the world input-output database. How to match its decomposition theory and method with China’s inter-provincial input-output table needs further theoretical and literature support. According to the studies of Li and Pan (2016), Su (2016) and Sheng et al. (2020) used the input-output tables across eight regions and inter-provincial input-output tables in China, respectively, focusing on the synergistic development and coupling relations between domestic and global value chains. The above studies on the preprocessing methods of China’s inter-provincial input-output table is worthy of reference in this paper. Based on the studies, this paper simplifies the inter-regional input-output table into a model for G regions and N industries. In the row direction, the sum of three region-industry items, namely, intermediate use, regional end use and export amount, is the total output; in the column direction, the region-industry sum of intermediate input, import amount and value-added input amount is the total input. The total input and total output are balanced. It needs to be noted that this paper no longer distinguishes the value added of foreign imports as the value added of return flows and that of pure imports. Considering that the CSU affects aggregate demand, this paper decomposes the demand based on the backward output method of final goods. [1] From the perspective of aggregate demand, the final region-industry demand can be decomposed into five items such as local value added, value-added outflow, value-added inflow, value-added return and value-added re-outflow, as shown in Table 1.
Value Added Decomposition Indexes from the Perspective of Backward Demand
| Decomposition index | Detailed description | |
|---|---|---|
| Final product (Y) | Local value added (D) | Local value added of production and consumption |
| Value-added outflow (RT) | Local value added in the form of final products flowing out to other regions for consumption | |
| Value-added inflow (A) | Value added of other regions that is consumed locally | |
| Value-added return (B) | Local value added after flowing out of a region and then returning | |
| Extraterritorial value added for re-outflow (C) | Value added of other regions contained in the products flowing out of a region |
It should be noted that authoritative inter-provincial trade statistics on intermediate goods are not available. This paper uses inter-regional input-output tables to measure intra-regional and inter-regional value-added trade data, a dataset that is widely used in studying regional value chain trade. The years are 2002, 2007, 2010, 2012 and 2015. There are 21 industries in 30 regions in 2002, 30 industries in 30 regions in 2007, 2010 and 2012, and 42 industries in 31 regions (including Xizang) in 2015. [1]
5.2 Setting of Measurement Equation
In this paper, we construct the following measurement equation.
In the above equation, VA on the left side of the equation is the value-added share of the s industry in r region in year t, which will be detailed below. UP, the core independent variable of this paper, denotes CSU. Controls, a collection of control variables, contain regional GDP, capital intensity, workforce, industry specialization, marketization and infrastructure development. Meanwhile, fixed effects are introduced to eliminate the estimation bias caused by unobservable factors in the region, industry and time dimensions. υr, υS and υt denote the fixed effects at the region, industry and year levels, respectively, and ε rst represents the random disturbance term.
5.3 Variable Description
CSU (UP). This paper examines the impact of the region-level CSU on intra- and inter-regional value-added flows for the years 2002, 2007, 2010, 2012 and 2015. Considering the issue of data availability, this paper uses the annual consumption expenditure data per capita of urban and rural households by region that are released in the China Statistical Yearbook in previous years to construct the CSU indicator. Specifically, the per capita consumption expenditure of urban and rural households is the sum of eight refined indicators such as food; clothing; housing; household appliance & services; transportation & communication; cultural, educational and recreational goods and services; health care and other goods and services. Of them, food, clothing and housing are subsistence consumption expenditure, while the last five are development and enjoyment expenditure. Therefore, this paper uses the share of five expenditure items such as household appliance & services; transportation & communication; cultural, educational and recreational goods and services; health care; and other goods and services in the total as an indicator of residents’ CSU (Xu and Zhang, 2020). [1]
The control variables include regional GDP (GDP); capital intensity (Capital), expressed as the share of fixed assets in GDP (Sun and Xu, 2018); workforce (Employment), expressed as the number of employees at the end of year in the whole society (Yao and Yu, 2009); the industry specialization (VS), expressed as the region-industry value-added output as a share of the industry’s output (Amiti, 2008); marketization (Market), expressed as the marketization index; and the infrastructure development (Infra), expressed as the unit area of road construction.
6 Empirical Test
6.1 Analysis of Baseline Estimation Results
The estimation results are reported in Table 2. Columns (1) and (2) show the estimation results without introducing control variables, while columns (3) and (4) with introducing control variables. The dependent variable in columns (1) and (3) is the share of the intra-regional value chain circulation (Regionshare), or that of local value added in the total output. The dependent variable in columns (2) and (4) is the inter-regional value chain circulation share (VCshare), which is the share of value added from extraterritorial inflows in total output. It can be found that the estimated coefficient of the intra-regional value chain circulation share is not statistically significant, which indicates that the CSU does not constitute a significant impact on the intra-regional value-added share of regional consumption. The estimated coefficient of inter-regional value chain circulation share is significantly positive, indicating that CSU empowers a region to embed itself in domestic value chain circulation. [2] For every 1% increase in CSU, the inter-regional value chain circulation intensity increases by 0.4%. According to the above analysis, the CSU promotes the use of extra-territorial elements in a region and strengthens the linkage between regional and extra-territorial value-added trade.
Benchmark Estimation Results
| Dependent variable | (1) | (2) | (3) | (4) |
|---|---|---|---|---|
| Independent variable | Regionshare | VCshare | Regionshare | VCshare |
| UP | 0.0514 (1.58) | 0.1682*** (9.68) | 0.3544 (0.05) | 0.3990*** (5.28) |
| GDP | 2.6531 (0.74) | 2.0296*** (6.99) | ||
| Capital | 1.2849 (0.80) | 2.3361** (2.28) | ||
| Employment | −3.3669* (−1.60) | 0.8976** (3.77) | ||
| VS | −0.2134 (−0.13) | 0.1155*** (6.73) | ||
| Market | 2.3284 (1.45) | 0.1284*** (7.06) | ||
| Infra | −0.5817 (−0.87) | 0.1073*** (4.52) | ||
| Constant term | 9.5430*** (7.62) | 4.5090*** (6.74) | −1.0566 (−0.39) | 1.1356*** (3.66) |
| Region fixed effects | Yes | Yes | Yes | Yes |
| Industry fixed effects | Yes | Yes | Yes | Yes |
| Year fixed effects | Yes | Yes | Yes | Yes |
| Observations | 4632 | 4632 | 4632 | 4632 |
| R2 | 0.350 | 0.266 | 0.002 | 0.061 |
Note: The t-statistic in parentheses applies the clustering-robust standard error at the regional level. *, ** and *** represent significance at the 10%, 5% and 1% levels, respectively. The same as below.
6.2 Robustness Test
Omitted Variable Test. In this paper, multi-dimensional control variables and fixed effects are added to the estimation equation to control the effects of observable and unobservable factors on the estimation results, but the problem of omitted variables is still unavoidable. Meanwhile, the cumulative effect of continuous production and the effect of “learning through practice” indicate the impact of value added in the previous period on the current period. In other words, the dependent variable may be “sticky” in this paper. Therefore, first-order lag terms of the dependent variable are introduced to construct dynamic panels and region-industry fixed effects are added to control the possible estimation bias problem caused by regional industrial policies (Su et al., 2019).
Table 3 shows the estimation results of the omitted variable test. To simplify the table, L.1 reports the estimation results corresponding to the first-order lag term of the dependent variable in each column. It can be found that the lag terms of the dependent variable all significantly positively affect the dependent variable, indicating that there is a dynamic correlation of regions’ production and a clear dynamic path-dependent feature of the division of labor model. The estimated significance of the CSU variable does not change substantially, which fully demonstrates that the impact of CSU on regional value-added production and demand and value chain structure remains significant after the omitted variable problem and cumulative production effects are considered.
Estimation Results of Omitted Variable Test
| Dependent variable Independent variable | (1) Regionshare | (2) VCshare | (3) Regionshare | (4) VCshare |
|---|---|---|---|---|
| L.1 | 0.0004** (2.02) | 0.5143*** (31.21) | 0.0026** (2.15) | 0.6000*** (7.49) |
| UP | 7.2294 (0.81) | 0.3103*** (4.51) | 1.0601 (0.05) | 0.1501*** (4.28) |
| Constant term | −215.1167 (−0.60) | 2.3097 (0.84) | −2.3893 (−0.57) | −0.3218 (−0.29) |
| Whether variables to add control | No | No | Yes | Yes |
| Year fixed effects | Yes | Yes | Yes | Yes |
| Region-industry fixed ef ects | Yes | Yes | Yes | Yes |
| Observations | 3330 | 3330 | 3330 | 3330 |
| R2 | 0.001 | 0.435 | 0.003 | 0.381 |
Test of Instrumental Variable Method. This paper further applies the instrumental variable method to overcome the potential endogeneity problem and uses the population mortality rate in each region from 1958 to 1960 (the three-year difficult period) as an instrumental variable for the CSU. The reason is that natural disasters in the three-year difficult period reduced the output of basic necessities such as food, which caused material scarcity and soaring prices. Against such a backdrop, residents had to cut consumption expenditures to save money. The people who grew up in the three-year difficult period have a long memory of their hard living at that time. The consumption and lifestyle of local residents have obvious inertia-dependent characteristics, which are characterized by low consumption and high savings or the mentality of “having food in hand and no panic in mind”. The mentality and habit are passed onto next generations in the intergenerational education. Therefore, regions with higher mortality rates in the three-year difficult period exhibited the lower capacity and tendency of CSU, satisfying the correlation requirement for selecting instrumental variables. Of course, the mortality rate is a historical variable that do not directly affect the intra-regional value chain circulation and structure. It is unlikely that regional value chains affect mortality rates in history, so it is reasonable to choose the natural-disaster population mortality in the three-year difficult period as an instrumental variable.
Table 4 reports the estimation results of the instrumental variable method. Durbin-Wu-Hausman (DWH) reports the model endogeneity test, showing that there is some degree of endogeneity problem. The statistics of Kleibergen-Paap rk LM (K-P rk LM) and Cragg-Donald Wald F (C-D Wald F) reject the original hypotheses of under-identification and weak identification of instrumental variables, respectively, demonstrating that the selection of instrumental variables is reasonable. Meanwhile, the sign and significance of the estimated coefficients of CSU variables remain consistent with the benchmark estimates, indicating that the conclusion of CSU promoting domestic value chain circulation remains robust after the endogeneity problem is overcome.
Estimation Results of Instrumental Variables
| Dependent variable Independent variable | (1) Regionshare | (2) VCshare | (3) Regionshare | (3) VCshare |
|---|---|---|---|---|
| UP | 15.4517 (0.81) | 1.5598*** (6.52) | −11.3089 (-0.50) | 1.3311*** (4.37) |
| Constant term | −5.2385 (−0.71) | −3.2732*** (−3.53) | 1.4393 (0.32) | 2.1430*** (4.53) |
| D-W-H | 0.042 | 0.044 | 0.039 | 0.042 |
| K-P rk LM | 149.30*** | 255.28*** | 144.12*** | 139.16*** |
| C-D Wald F | 154.62*** | 271.17*** | 140.89*** | 169.93*** |
| Whether to add control variables | No | No | Yes | Yes |
| Region fixed effects | Yes | Yes | Yes | Yes |
| Industry fixed effects | Yes | Yes | Yes | Yes |
| Year fixed effects | Yes | Yes | Yes | Yes |
| Observations | 4284 | 4284 | 4284 | 4284 |
| R2 | 0.007 | 0.300 | 0.011 | 0.057 |
6.3 Mechanism Test
Innovation-Driven Effect. Based on the above analysis that CSU drives domestic value chain circulation through innovation, this section constructs a mechanism variable (Patent) that can characterize indigenous innovation using region-level enterprise patent data. [1] The estimated results are shown in columns (1) and (2) of Table 5. It can be seen that the estimated results of the interaction term between CSU and indigenous innovation are significantly positive, indicating that CSU stimulates innovation and thus promotes the domestic value chain circulation.
Estimation Results of Mechanism Analysis
| Dependent variable Independent variable | (1) Regionshare | (2) VCshare | (3) Regionshare | (4) VCshare | (5) Regionshare | (6) VCshare |
|---|---|---|---|---|---|---|
| Interaction term | 0.3323 (0.38) | 0.1127*** (3.70) | −0.1010 (−0.22) | 0.0270*** (6.86) | 2.6277 (0.13) | 0.3783*** (2.71) |
| UP | 0.1694 (0.53) | 0.8733*** (3.11) | 1.1641 (0.80) | 0.5412*** (4.36) | 6.7438 (0.42) | 0.1456** (2.26) |
| Patent | 0.1517 (0.99) | 0.2967** (2.21) | ||||
| RE | −4.8925 (−0.25) | 0.9563*** (5.65) | ||||
| IO | 1.9502 (0.26) | 3.4150*** (6.35) | ||||
| Constant term | −7.8700 (−0.55) | 5.9604*** (4.77) | 1.8607 (0.29) | 5.0391*** (9.18) | 2.2977 (0.32) | 9.2326* (1.79) |
| control Whether variables to add | Yes | Yes | Yes | Yes | Yes | Yes |
| Regional fixed effects | Yes | Yes | Yes | Yes | Yes | Yes |
| Industry fixed effects | Yes | Yes | Yes | Yes | Yes | Yes |
| Time fixed effects | Yes | Yes | Yes | Yes | Yes | Yes |
| Observations | 4632 | 4632 | 4590 | 4590 | 4632 | 4632 |
| R2 | 0.015 | 0.447 | 0.015 | 0.463 | 0.015 | 0.634 |
Optimization Effect of Resources. This section tests the mechanism through which CSU promotes domestic value chain circulation by optimizing regional resource allocation. By referring to the research of Bai and Liu (2018), an indicator of the resource misallocation at the regional level is constructed, and the regional resource misallocation variable is taken as the inverse (RE). From the estimation results shown in columns (3) and (4) of Table 5, it can be seen that the estimated results of the interaction term between CSU and resource misallocation are significantly positive, indicating that CSU promotes the domestic value chain circulation by reducing resource misallocation.
Industry Coupling Effect. The CSU promotes intra-product division and coordination of labor and inter-industry input-output linkage and advances industrial integration and dynamic complementarity, which in turn facilitates the domestic value chain circulation. This section further tests the mechanism by applying the industry complete consumption coefficient (IO) of each region to represent inter-regional industry coupling (Liu and Zhao, 2020). [1] From the estimation results shown in columns (5) and (6) of Table 5, it can be seen that the estimated results of the interaction term between CSU and industry coupling are significantly positive. This indicates that CSU promotes the domestic value chain circulation by facilitating industry coupling.
6.4 Expansion Analysis
Although market segmentation policies by local governments have the potential to increase local employment and other economic benefits in the short term, they may limit regional resource endowment advantages, inter-regional industrial coordination and production capacity and economies of scale potential and increase inter-regional industrial competition and resource misallocation in the long run, making market segmentation a short-sighted policy choice that deviates from comparative advantage (Lu et al., 2018). What about the impact of market segmentation on intra-regional and inter-regional supply and demand and value chain structure of intermediate goods from the perspective of value-added trade? To explore this issue, this paper measures the market segmentation in the region-industry-time dimension by referring to the studies of Lu and Chen (2009) and Sheng and Mao (2011) and introduces the interaction term between market segmentation and CSU for regression. In order to visualize the impact of different market segmentation levels on CSU, the estimation results are reported graphically in this paper, as shown in Figure 2 below.

Moderating Effect of Market Segmentation
Figure 2 reports the average marginal effect of the CSU variable on the dependent variable when the market segmentation takes various values. The vertical coordinate is the estimated coefficient value and the horizontal coordinate is the regional market segmentation, which takes values in the range [–1.14, 1.71], with a mean value of 0 (close). The slope of the falling thick solid line is the marginal effect corresponding to market segmentation. The line segments extending above and below the dots indicate confidence intervals with a threshold of 95%. Meanwhile, this paper plots the dashed line when the vertical coordinate corresponds to the value of 0. When the confidence interval lies exactly above or below the horizontal dashed line, it indicates that the regional market segmentation within this interval significantly promotes or suppresses the positive effect of CSU on the dependent variable. When the confidence interval crosses the horizontal dashed line, it indicates that the marginal effect of the regional market segmentation is not statistically significant.
Figure 2(a) shows the estimation results when the share of a region’s value added in a region’s total output is the dependent variable for regional production and consumption. As the market segmentation increases, the marginal effect of CSU on the value-added share of a region gradually decreases, but it is not statistically significant. Figure 2(b) reports the regression results on the share of value added to the total output from extraterritorial inflows, where the overall market segmentation inhibits the lifting effect of CSU on the share of extraterritorial value added. The marginal effect of CSU on the share of extraterritorial value added gradually decreases as market segmentation deepens, when the regional market segmentation lies within the interval of [–1.14, 0.05]. This is because of the large differences in endowment advantages and industrial technologies between China’s regions. The slight market segmentation between regions can give rise to market arbitrage and enhance the specialization of production and division of labor. [1]
7 Conclusion and Insight
According to the findings of this paper, CSU can significantly promote value-added trade circulation and value chain structure upgrade within and between regions and facilitate inter-regional value chain linkages. The above findings remain robust after a series of robustness method tests. Based on the expansion research, regional market segmentation inhibits the positive contribution effect of CSU to the value chain circulation.
The above conclusions provide empirical evidence and theoretical support for China to accelerate the construction of a domestic value chain circulation system under the new development pattern, with important policy implications. As China’s economy is facing greater external uncertainty, it should accelerate the upgrading of domestic consumer market, advance the supply-side structural reform of forward factors and products with effective demand, and build a value chain circulation system with people’s final consumption demand as the main focus.
Funding statement: Funded by: “Research on WTO Reform in the Context of Global Economic & Trade Rules Restructuring” (21JZD023) under Major Projects of Philosophy and Social Sciences Research of China’s Ministry of Education; “Service-Oriented Manufacturing Inputs, Trade Barriers in Services and International Production Segmentation” (71973025) under the National Natural Science Foundation of China; and the Grant Program for Outstanding Young Scholars of the University of International Business and Economics (19JQ08). The authors thank anonymous reviewers for their valuable comments. The authors take full responsibility for the views expressed herein.
References
Acemoglu, D., & Linn, J. (2004). Market Size in Innovation: Theory and Evidence from the Pharmaceutical Industry. Quarterly Journal of Economics 119(3), 1049–1090.10.3386/w10038Suche in Google Scholar
Amiti, M., & Javorcik, B. (2008). Trade Costs and Location of Foreign Firms in China. Journal of Development Economics 85(1), 129–149.10.1596/1813-9450-3564Suche in Google Scholar
Aoki, M., & Hiroshi, Y. (2002). Demand Saturation-Creation and Economic Growth. Journal of Economic Behavior & Organization 48(2), 127–154.10.1016/S0167-2681(01)00229-3Suche in Google Scholar
Bai, J., & Liu, Y. (2018). Can OFDI Improve China’s Resource Misallocation? China Industrial Economics (Zhongguo Gongye Jingji) 1, 60–78.Suche in Google Scholar
Fan, H. (2007). Effective Demand Scale Hypothesis, Research and Development Investment and National Indigenous Innovation Capability. Economic Research Journal (Jingji Yanjiu) 3, 33–43.Suche in Google Scholar
Foellmi, R., & Josef, Z. (2008). Structural Change, Engel’s Consumption Cycles and Kaldor’s Facts of Economic Growth. Journal of Monetary Economics 55(7), 1317–1328.10.1016/j.jmoneco.2008.09.001Suche in Google Scholar
Hong, J., & Shang, H. (2019). Concurrent Circulation of China’s Open Economy: Theory and Evidence. Social Sciences in China (Zhongguo Shehui Kexue) 1, 42–64.Suche in Google Scholar
Ju, J., Lin, J., & Wang, Y. (2015). Endowment Structures, Industrial Dynamics, and Economic Growth. Journal of Monetary Economics 76(8), 244–263.10.1596/1813-9450-5055Suche in Google Scholar
Ju, J., Yu, X., Lu, B., & Li, X. (2020). Analysis of the Three-Legged Pattern in the Global Value Chain Network. China Journal of Economics (Jingji Xuebao) 7, 1–20.Suche in Google Scholar
Li, F. (2016). China’s National Value Chain Division from the Perspective of Value Added: Based on Improved Regional Input-Output Model. China Industrial Economics (Zhongguo Gongye Jingji) 3, 52–67.Suche in Google Scholar
Li, F. (2020). China’s Provincial Role Embedded in Dual Value Chains: A Comprehensive Theoretical Analysis Framework. China Industrial Economics (Zhongguo Gongye Jingji) 1, 136–154.Suche in Google Scholar
Li, G., & Pan, W. (2016). How Domestic Value Chains are Embedded in Global Value Chains: A Value-Added Perspective. Management World (Guanli Shijie) 7, 10–22.Suche in Google Scholar
Li, S., & Gong, L. (2012). Inconsistent Preference, Internal Preference Structure and Economic Structural Changes. Economic Research Journal (Jingji Yanjiu) 7, 35–47.Suche in Google Scholar
Liu, B., & Zhao, X. (2020). Service-Oriented Manufacturing Inputs, Trade Barriers in Services and Division of Labor in Global Value Chains. Economic Research Journal (Jingji Yanjiu) 7, 159–174.Suche in Google Scholar
Lu, M., & Chen, Z. (2009). Economic Growth in Segmented Markets: Why Economic Openness May Intensifies Local Protection? Economic Research Journal (Jingji Yanjiu) 3, 412–425.Suche in Google Scholar
Lu, Y., Sheng, B., & Lu, Y. (2018). Will China’s Market Segmentation Lead to Decline in Domestic Value-Added Rate of Enterprises’ Exports? China Industrial Economics (Zhongguo Gongye Jingji) 5, 5–23.Suche in Google Scholar
Marshall, A. (2011). Principles of Economics. Beijing: The Commercial Press. (in Chinese)Suche in Google Scholar
Marx, K. (1953). Das Kapital. Beijing: People’s Publishing House. (in Chinese)Suche in Google Scholar
Ngai, R., & Pissarides, C. (2007). Structural Change in a Multisector Model of Growth. American Economic Review 97 (1) , 429–443.10.1257/aer.97.1.429Suche in Google Scholar
Shao, C., Li, K., & Su, D. (2018). Domestic Value Chain and Regional Economic Cycle Synergy: Empirical Evidence from China. Economic Research Journal (Jingji Yanjiu) 3, 187–201.Suche in Google Scholar
Sheng, B., & Mao, Q. (2011). Trade Opening, Domestic Market Integration and China’s Inter-Provincial Economic Growth from 1985 to 2008. Journal of World Economy (Shijie Jingji) 11, 44–66.Suche in Google Scholar
Sheng, B., Su, D., & Shao, C. (2020). Global Value Chains, Domestic Value Chains and Economic Growth: Substitution or Complementarity. Journal of World Economy (Shijie Jingji), 4, 3–27.Suche in Google Scholar
Su, D., Sheng, B., & Shao, C. (2019). Domestic Value Chains, Marketization and Spillover Effects of Economic Growth. Journal of World Economy (Shijie Jingji) 10, 143–168.Suche in Google Scholar
Su, Q. (2016). Decomposition of the Value Added of China’s Provincial Exports and Its Application. Economic Research Journal (Jingji Yanjiu) 1, 84–98.Suche in Google Scholar
Sun, Z., & Xu, X. (2018). Industrial Innovation and Consumption Structure Upgrade: An Empirical Study Based on the Perspective of Supply-Side Structural Reform. China Industrial Economics (Zhongguo Gongye Jingji) 7, 98–116.Suche in Google Scholar
Wang, Z., Wei, S., & Zhu, K. (2013). Quantifying International Production Sharing at the Bilateral and Sector Levels. NBER Working Papers, 19677.10.3386/w19677Suche in Google Scholar
Xu, C., & Zhang, B. (2020). Domestic Demand Expansion in the Transition of Economic Structure: From the Perspective of Service-Industry Supply Suppression. Social Sciences in China (Zhongguo Shehui Kexue) 1, 64–83.Suche in Google Scholar
Yan, S., Guo, K., & Hang, J. (2018). Demand Structure Change, Industrial Structure Transformation and Productivity Improvement. Economic Research Journal (Jingji Yanjiu) 12, 83–96.Suche in Google Scholar
Yang, T., & Chen, M. (2018). Driving Effect of Consumption Structure Upgrade on the Promotion of Middle and High-End Industries: Theoretical Logic and Empirical Evidence. Economist (Jingji Xuejia) 11, 48–54.Suche in Google Scholar
Yao, Y., & Yu, M. (2009). Labor, Population and China’s Export-Oriented Growth Model. Financial Research (Jinrong Yanjiu) 9, 1–13.Suche in Google Scholar
Yu, J., & Fang, F. (2015). Impact of China’s Urban and Rural Residents’ Consumption Structure Upgrade on Economic Growth. Journal of Renmin University of China (Zhongguo Renmin Daxue Xuebao) 9, 68–78.Suche in Google Scholar
© 2022 Bin Liu, Chuanchuan Li, Qiujing Li, published by De Gruyter
This work is licensed under the Creative Commons Attribution 4.0 International License.
Artikel in diesem Heft
- Theoretical Logic and Empirical Facts of Consumption Structure Upgrade and Domestic Value Chain Circulation under the New Development Pattern
- Financial Shocks, Deleveraging and Macroeconomic Fluctuations in China
- Local Government Borrowing’s Expansionary Monetary Effect and Its Policy Synergy
- Distance Puzzle: An Explanation from Global Value Chain Perspective
- Exchange Rate Change, Factor Market Distortion and Company Performance
- Policy Innovation Diffusion and PPP Spatial Distribution