An isotope dilution-liquid chromatography-tandem mass spectrometry-based candidate reference measurement procedure for the quantification of mycophenolic acid glucuronide in human serum and plasma
-
Tobias Schierscher
 ,
Christoph Seger
,
Christoph Seger


Abstract
Objectives
A candidate reference measurement procedure (RMP) based on isotope dilution (ID) liquid chromatography-tandem mass spectrometry (LC-MS/MS) was developed and validated to accurately measure serum and plasma concentrations of mycophenolic acid glucuronide (MPAG).
Methods
Quantitative nuclear magnetic resonance (qNMR) spectroscopy was utilized for determining the absolute content (mass fraction; g/g) of the reference material, thereby, establishing the traceability to SI units. Separation of MPAG from potential interferences, whether known or unknown, was accomplished by using a Phenomenex Luna C18(2) column. For sample preparation, a protocol based on protein precipitation followed by a high-dilution step was established. A multi-day validation experiment evaluated precision and accuracy. Reproducibility was determined by comparing the results of the procedure between two independent laboratories. Measurement uncertainty (MU) was assessed in accordance with current guidelines.
Results
The RMP demonstrated high selectivity and specificity enabling the quantification of MPAG in the range between 0.750 and 600 μg/mL. The intermediate precision and repeatability (n=60, measurements) were found to be in the range from 0.9 to 3.7 % for serum samples and from 1.2 to 4.6 % for plasma samples. The repeatability was less than 3.5 % for serum samples and less than 4.0 % for plasma samples. The relative mean bias ranged from −0.9 to 3.2 % for serum samples and from −0.3 to 2.9 % for plasma samples. The expanded measurement uncertainties (k=2) for single measurements ranged between 2.4 and 7.7 % and were further reduced performing a target value assignment (n=6) resulting in expanded measurement uncertainties between 1.8 and 3.3 % (k=2), respectively.
Conclusions
We herein present a new LC-MS/MS-based candidate RMP for MPAG in human serum and plasma which offers a traceable and reliable platform for the standardization of routine assays and evaluation of clinically relevant samples.
Introduction
The target analyte, mycophenolic acid β-D-glucuronide (MPAG), is a key metabolite of mycophenolic acid (MPA) [1]. MPA is an immunosuppressant drug limiting de novo guanosine nucleotide synthesis by inhibiting the key enzyme inosine-5-monophosphate dehydrogenase. It is widely used in transplantation medicine, and its pharmacokinetics are well understood. The half-life time of MPA is 8–16 h; a dosage of 2–3 g per day, divided into two doses is standard of care [1]. MPA glucuronidation via uridine glucuronosyltransferase predominantly produces MPA 7-O-glucuronide, commonly referred to as MPAG. Additionally, glucuronidation of the terminal aliphatic acid function yields the minor MPA metabolite acid acyl glucuronide (AcMPAG). MPA excretion is almost exclusively via active tubular secretion of MPAG into the urine, hence MPAG is the pharmacological key catabolite of MPA.
Under steady-state pharmacokinetic conditions, MPAG plasma levels exceed MPA levels by approximately fifty to one hundred times. Typical MPAG concentrations have been reported as 100–300 μg/mL early post transplantation and around 35–150 mg/mL in later steady state [1], [2], [3], [4], [5]. Impaired renal secretion due to various factors, including co-medication, can lead to an increase in the enterohepatic circulation (EHC) of MPA and its metabolites [1]. The release of MPA from MPAG occurs through enzymatic activities of the intestinal microbiota. This process is significantly modulated by the patient’s individual microbiome [6], 7]. The variability of MPAG levels in conjunction with re-metabolism in the context of EHC can therefore lead to unexpected fluctuations in MPA exposure in individual patients during therapy. This makes optimal patient management considerably more difficult. EHC also makes PK/PD modeling challenging, which in turn has led to expanded scientific activities in this field.
Currently commercially available ligand binding assays (immunoassays, enzyme activity-based assays) are not capable of distinguishing MPA from its metabolites MPAG and AcMPAG [1]. MPAG and AcMPAG cross reactivities in the MPA readout were reported to lead to MPA drug level overestimations compared to chromatographic methods [1], 8]. Taken together, such assays are significantly influenced by MPA metabolites without the possibility to identify their amount or nature. In chromatographic assays with UV (HPLC-UV) or tandem mass spectrometry (LC-MS/MS) based detection, MPAG and AcMPAG are distinguishable from MPA and often quantified in clinical research settings [1], [2], [3], [4], [5].
Like MPA measurements, MPAG measurements are not metrological traceable to higher order references due to the overall lack of MPA and MPAG reference measurement systems, materials and services [9]. It is however well understood and reported for MPA [1], that to minimize inter-laboratory measurement accuracy and inter-laboratory and inter-test variability, reference measurement procedures (RMPs) play a pivotal role [10]. They are free of systematic error, traceable to a higher order reference material and in accordance with ISO guidelines (ISO 17511) [11].
Consequently, our group recently established a candidate reference measurement system for MPA [12]. Considering the remarkable intra- and interindividual plasticity of MPA metabolism including the role of EHC related MPAG reconversion to MPA, a need for traceable MPAG plasma level monitoring is present – both for research and routine. Establishing a sound MPAG traceability chain will aid caretakers and industry to improve the understanding of MPAG exposure in individual transplant recipients. Hence, within this publication we are outlining an additional and novel candidate RMP for MPAG meeting the requirements of the ISO 15193 guideline [13].
In this RMP quantitative nuclear magnetic resonance (qNMR) methodology has been used to characterize MPAG reference materials and assign an absolute mass-fraction value (g/g) along with establishing the SI-traceability to both the kilogram and mole.
The highest order qNMR internal standard (ISTDs) are traceable directly to NIST benzoic acid 350b (Coulometric) and/or NIST PS1 (benzoic acid; the first primary qNMR standard). These commercially available qNMR ISTDs can be obtained from SigmaAldrich (TraceCert Standards) and from Wako (TraceSure standards; traceable to NMIJ CRMs). Moreover, the latest IUPAC Technical Report identifies qNMR as a potential primary RMP, ideally suited for the characterization of primary reference materials.
Additionally, the RMP should meet performance specifications based on the measurement uncertainty goal for MPAG. It should be no more than one-third of the measurement uncertainty of routine methods and/or the biological variability as described by Braga and Panteghini [14]. Using an approach based on the pharmacokinetic [15] and the expected drug level range [16], 17] of MPAG, the target measurement uncertainty (k=1) was calculated to be 2.1 and 2.2 %, respectively. Leading to an expanded target measurement uncertainty (k=2) of 4.2 and 4.3 % for the pharmacokinetic and expected drug level range approaches, respectively. Hence, we propose that an RMP for MPAG should have measurement uncertainties of ≤2.1 % (k=1).
To facilitate the reproduction of the candidate RMP by other laboratories, details are described in three supplementary documents focusing on the technical implementation of the procedure, the qNMR-based reference material characterization, and the calculation of measurement uncertainty.
Materials and methods
A detailed operation procedure including a full list of materials and equipment used as well as a step-by-step instruction for the application of the method is given within Supplementary Material 1.
Chemicals and reagents
The standard MPAG (C23H28O12, molecular weight=496.5 g/mol, conversion factor to molar unit [µmol/L]=2.0; CAS 31528-44-6, Cat. No. C2565, Lot JA-ALS-21-093-P3) was bought from Alsachim (Illkirch, France). MPA (CAS 24280-93-1) was purchased from LGC (Dr. Ehrenstorfer) (Luckenwalde, Germany). [2H3]-MPAG (CAS 31528-44-6 (unlabeled), Cat. No. M831522, Lot 14-YSW-5-1) was bought from Toronto Research Chemicals (Toronto, Canada).
qNMR for determination of the purity of the standard materials
Glucuronides, known for their extreme hygroscopicity, pose significant challenges when it comes to accurate weighing on an ultra-microbalance [18], [19], [20]. To circumvent this issue, we equilibrated the analyte open air with regular stirring, which facilitated the material’s saturation with moisture and subsequently enabled precise weighing [18], 19]. Subsequently, we developed the qNMR methodology for this saturated material. A single-pulse 1H{13C}NMR was utilized for the quantitation (δ=6.30 ppm; 1H; methyl-3,5-dinitrobenzoate as SI traceable qNMR ISTD; pyridine-d5 as solvent) with an inter-scan delay of 70 s (Supplementary material 2 Figures 1 and 2). The identity of this resonance was confirmed by 2D-TOCSY, 2D-gHSQCAD and 2D-gHMBCAD pulse sequences (Supplementary material 2 Figures 3 and 4).
The choice of pyridine-d5 as the solvent was deliberate, given its aromatic solvent-induced separation (ASIS) effects that enable optimal resolution of the quantitative resonance. This meticulous selection was crucial for verifying the analyte as the O-aryl glucuronide as opposed to the O-acyl glucuronide, a distinction that was substantiated by the 3JCH correlation observed in the 2D-gHMBCAD spectrum. Furthermore, this specific resonance allows for a clear differentiation between MPAG and MPA, establishing it as the sole identifiable and quantifiable signal for MPAG, particularly in scenarios where the pure analyte is unavailable. Comprehensive details on the NMR acquisition and processing parameters are documented in Supplementary Material 2 (Table 1, Figures 1–4).
Utilizing these parameters, six individual experiments, each involving separate weighings, yield a final absolute content value of 93.7±0.4 % (k=1).
Additionally, we also performed quantum chemical calculations to ascertain the conformer distribution of MPAG in solution because the Boltzmann average of these structures constitute the NMR spectrum. Computational calculations to determine the most reactive chemical bond towards de-protonation was also performed owing to the labile nature of the methylene protons in the internal lactone group. Finally, DFT single-point calculations were performed at the wB97X-V/def2-TZVP level of theory and all the information is presented in Supplementary Material 2. These theoretical analyses contributed in the determination of ideal quantitative resonance for both analytes.
Preparation of calibrators and quality control samples
Two calibrator stock solutions were prepared which were further used for the preparation of spike solutions and the final matrix-based calibrator levels. To obtain concentrations of 120 mg/mL, approximately 600 mg of MPAG was weighed directly into a volumetric flask on an analytical balance and dissolved in 5 mL of DMSO.
The concentration of the stock solutions was precisely calculated based on the purity of the reference material (93.7±0.4 % determined by qNMR) and the exact amount weighed. The stock solutions were subsequently diluted with DMSO to obtain working solutions with concentrations of 3.00 mg/mL. Stock and working solutions were used for further preparation of the eight calibrator spike solutions in DMSO. Final matrix-based calibrators, uniformly distributed from 0.750 to 600 μg/mL, were prepared by a 1+99 dilution (v+v) into analyte-free human serum. The conversion factor from µg/mL to µmol/L is 2.0.
Four levels of matrix-based quality control levels were prepared using a third independent stock solution and resulting spike solutions, following the same approach as described for the calibrator levels. The concentrations for the control levels were established at four crucial points: above the lower limit of the measuring interval (LLMI) (2.00 μg/mL), at the lower margin of the expected steady state MPAG drug level range (40.0 μg/mL), at the upper margin of expected steady state drug level range (200 μg/mL), and above any expected drug level range (400 μg/mL).
Internal standard solution
For the preparation of the MPAG ISTD stock solution, [2H3]-MPAG was dissolved in the appropriate amount of DMSO to obtain a 1,000 μg/mL ISTD stock solution. The ISTD working solution was prepared by mixing 100 µL of ISTD stock solution with 3,900 µL Milli-Q water to receive a concentration of 25.0 μg/mL [2H3]-MPAG.
Sample preparation
100 µL of the ISTD working solution was pipetted into a 2 mL tube (Eppendorf, Hamburg, Germany) and 50 µL of the sample specimen (calibrator/QC/native sample) was added. For protein precipitation, 1,000 µL precipitation solution (75 % methanol (v+v)). 10 µL of the supernatant was first mixed with 1,000 µL 45 % acetonitrile in mobile phase A (v+v) followed by another 1+9 (v+v) dilution directly in an HPLC vial (Wicom, Heppenheim, Germany) with 45 % acetonitrile in mobile phase A (v+v).
Liquid chromatography mass spectrometry
An Agilent 1290 Infinity II LC system (Santa Clara, California, USA), equipped with a binary pump, a vacuum degasser, an autosampler at 7 °C and a column compartment tempered to 40 °C, was used for chromatographic separation. Baseline separation of MPAG and MPA, MMF and acyl-MPAG were achieved using a Phenomenex Luna C18(2) column (100 × 3 mm, 3 μm, Phenomenex, Lane Cove, Australia) using a gradient elution over 9 min with a flow of 0.6 mL/min. The mobile phases consisted of 2 mM ammonium acetate in Milli-Q water with 0.1 % formic acid (A) and 2 mM ammonium acetate in methanol with 0.1 % formic acid (B). Contamination of the mass spectrometer was reduced by switching the eluent flow until 0.5 min and from 4.5 min to the waste.
MPAG was detected in selected reaction monitoring (SRM) mode using an AB Sciex Triple Quad 6500+ and Q-Trap 6500+ mass spectrometer operating in positive electrospray ionization mode. The quantifier ion transition (MPAG m/z 514.2 → 303.1) and the corresponding ISTD transition ([2H3]-MPAG m/z 517.2 → 306.1) served as the basis for MPAG quantitation. Supplementary Material 1 includes detailed LC and MS methods.
System suitability test
To check the sensitivity and chromatographic performance of the system a system suitability test (SST) was performed prior to each analysis and data was only collected if the SST was passed. Using a MPAG stock solution (1 mg/mL dissolved in DMSO), two samples (SST1 and SST2) were prepared in mobile phase A with concentrations corresponding to processed calibrator levels 1 and 8, respectively.
To pass the SST, signal-to-noise ratio of the quantifier transition had to be ≥50 for SST1 and the retention time for SST1 and SST2 had to be within 3.0 ± 0.5 min. To assess possible technical carry-over effects, SST2 was injected followed by two solvent blanks. The analyte peak area observed in the first blank after the injection of SST2 had to be ≤20 % of the analyte peak area of SST1.
Calibration and structure of analytical series and data processing
The final calibration function was obtained by measuring the calibration levels 1 to 8 in increasing concentration at the beginning and the end of the analytical series. The analyte to ISTD area ratios (y) was plotted against the analyte concentration (x), resulting in a quadratic regression model (y=a0 + a1x + a2x 2 ). Data processing was performed using Analyst® software (version 1.6.3 or higher) with the IntelliQuant algorithm. The peaks were integrated at a retention time of 3.0±0.5 min using a smoothing factor of five, a peak splitting factor of one, a noise percent of 80 %, and a base sub-window of 0.8 min.
Method validation
Assay validation and determination of measurement uncertainty were performed according to the Clinical & Laboratory Standard Institute (CLSI) Guidelines C62A “Liquid Chromatography-Mass Spectrometry Methods” [21], the International Conference on Harmonization (ICH) guidance document “Harmonised Tripartite Guideline Validation of Analytical Procedures: Text and Methodology Q2 (R1)” [22] and the Guide to the expression of uncertainty in measurement (GUM) [23].
Selectivity
Baseline separation of MPAG was assessed by spiking MPAG, MPA (m/z 338.2 to 207.1), MMF (m/z 434.1 to 114.2) and acyl-MPAG (m/z 514.1 to 207.0) at concentrations of 15.0 μg/mL into analyte-free human serum, TDM-free serum, and Li-heparin plasma. To examine potential interfering matrix signals matrix blanks were checked at the expected retention time of MPAG. Furthermore, analyte-free matrices were spiked with deuterated ISTD to evaluate a potential quantity of residual unlabeled analyte.
Matrix effects
In a post-column infusion setting, a neat solution (75 ng/mL MPAG in mobile phase A/mobile phase B 50+50 [v+v]) was infused into the HPLC column effluent via a T-piece at flow rate of 7 μL/min. To exclude possible matrix effects (MEs), analyte-free human serum, TDM-free serum and plasma matrices (Li-heparin, K2-EDTA and K3-EDTA) were analyzed. Any shift of the MRM analyte signal at the expected retention time would indicate a matrix component mediated effect on the ionization.
Furthermore, a comparison of calibration curves in terms of coefficient of determination and mean slopes was performed comparing following matrices: neat solution (45 % acetonitrile in mobile phase A [v+v]), analyte-free human serum, TDM-free serum, and Li-Heparin plasma according to Matuszewski [24]. The 95 % confidence interval (CI) must overlap, and the coefficients of determination must be ≥0.999. Moreover, the neat calibration was set as standard, evaluating the calibrator samples in analyte-free human serum, TDM-free serum and Li-heparin plasma as controls. Recoveries were stated as the percentage of recovery of the measured concentration in relation to the nominal concentration.
In addition, a comparison of absolute areas of analyte and ISTD was performed according to Matuszewski [25]. Analytes and ISTD solutions were spiked into neat (75 % methanol [v+v]), analyte-free human serum, TDM-free serum, and Li-heparin plasma after protein precipitation for three levels spread over the working range (2.00, 40.0 and 400 μg/mL). Ion enhancement (values >100 %) or suppression (values <100 %) was evaluated by comparing the mean peak areas of analyte and ISTD as well as area ratios of the matrix samples against the neat samples. The percentage deviation has to be within the range of 100 ± 10 %.
Linearity
To determine the linearity, calibrators were prepared six-fold. Additionally, two spike solutions were prepared to obtain MPAG spiked analyte-free human serum samples for an extended calibration range by ±20 %, with final concentrations of 0.600 and 720 μg/mL. Residuals and coefficients of determination were determined. In addition, the linearity of the method was proven on the basis of the recovery of serially diluted samples. By using calibrator level 1 as sample 1 and calibrator level 8 as sample 11 nine samples were diluted as following: 9+1 (v+v), 8+2 (v+v), 7+3 (v+v), 6+4 (v+v), 5+5 (v+v), 4+6 (v+v), 3+7 (v+v), 2+8 (v+v) and 1+9 (v+v). Measurement results must show a linear relationship with a coefficient of determination ≥0.999. Furthermore, recovery is reported as the percentage of the measured concentration relative to the nominal concentration of the sample pools.
Lower limit of measuring interval
Precision and accuracy at the LLMI were determined by measuring spiked analyte-free human serum matrix samples in the expected concentration range of the limit of quantitation. The LLMI matches with the lowest calibrator level (0.750 μg/mL). Samples were prepared in five replicates and recovery, bias, and precision were determined.
Precision and accuracy
A five-day validation experiment was performed to evaluate precision and accuracy of the developed method. Total method variability was estimated performing an ANOVA based variance component analysis including variability components such as between-injection variability, between-preparation variability, between-calibration variability and between-day variability.
On each of the five days four spiked analyte-free human serum and Li-heparin plasma samples covering the measuring range (2.00, 40.0, 200 and 400 μg/mL) as well as two native patient serum samples were prepared in triplicate and injected twice. This scheme was performed by two individuals in parallel, here defined as validation part A and part B (n=12 measurements per day and n=60 measurements per 5 days). An individual calibration curve was generated for each part and used for quantitative analysis. The data evaluation was carried out with an internal statistic program Biowarp, which is based on the VCA Roche Open Source software package in R [26].
Trueness and accuracy were evaluated using four spiked analyte-free human serum and Li-heparin plasma samples (2.00, 40.0, 200 and 400 μg/mL). Dilution integrity was performed using two spiked analyte-free human serum samples at concentration levels of 640 and 800 μg/mL (dilution 1 and 2). Three sample preparations were prepared on one day for each part A and part B (n=6 measurements). Accuracy was determined as the percentage recovery of the measured concentration relative to the spiked concentration, while trueness was reported as the percentage recovery of the mean measured concentration relative to the spiked concentration.
Sample stability
The stability of processed spiked analyte-free human serum samples was investigated at 7 °C. Therefore, samples were measured again after seven days of storage and were compared to freshly prepared samples. In addition, the stability of spiked analyte-free human serum samples was tested at −20 °C over a period of 28 days. Recoveries were calculated by comparing the measured value with freshly prepared spiked analyte-free human serum samples.
Equivalence of results between independent laboratories
To assess the agreement of the RMP between two independent laboratories (site 1 Dr. Risch, Buchs SG and site 2 Roche Diagnostic GmbH, Penzberg), a method comparison study was performed including overall 101 anonymized native serum samples provided by Site 2. In addition, a three-day precision experiment was carried out in laboratory 2 using the same spiked analyte-free human serum and native serum patient samples as in laboratory 1. The sample preparation was performed with a modified final sample dilution factor. Following protein precipitation, 20 µL of the supernatant was first mixed with 990 µL 45 % acetonitrile in mobile phase A (v+v) followed by another 1+9 (v+v) dilution directly in an HPLC vial with 45 % acetonitrile in mobile phase A (v+v). The LC-MS system and laboratory equipment were similar in both locations, with the following modifications at Site 2: an ultra-microbalance XP6U/M (Mettler Toledo) was used for preparing stock solutions. Calibrators were independently prepared at each site, as described in Supplementary Material 1.
Uncertainty of measurements
Measurement uncertainty was determined according to the GUM [23] and Taibon et al. [27], where the following parameters were considered: purity of the reference material based on the certificate, weighing of the analyte, preparation of stock, working, spike and calibrator solutions, preparation of the ISTD solution, sample preparation of the calibrators, measurement of the calibrators and generation of the calibration curve, preparation and measurement of the unknown samples as well as evaluation of the sample results. To assess the uncertainty in the preparation of the calibrators, a type B evaluation was performed, while all other aspects were evaluated as type A. The total measurement uncertainty was then estimated by combining the type A and type B uncertainties. Further information on type B uncertainty estimation is provided in Supplementary Material 3.
Results
Traceability to SI units
Traceability to the SI unit of mass (kilogram) and the SI unit of amount of substance, has been established by the utilization of methyl-3,5-dinitrobenzoate as the qNMR ISTD which is directly traceable to NIST PS1 (primary qNMR standard). Since Planck’s constant is now the main parameter for defining kilogram and Avogadro’s constant for mole, qNMR methodology is best suited to fulfill both the traceability chains. Utilizing the afore mentioned parameters, six individual experiments (Supplementary Material 2 Figure 1 and 2; Table 1) involving six individual weighings, yield a final absolute content value of 93.7±0.4 % (k=1).
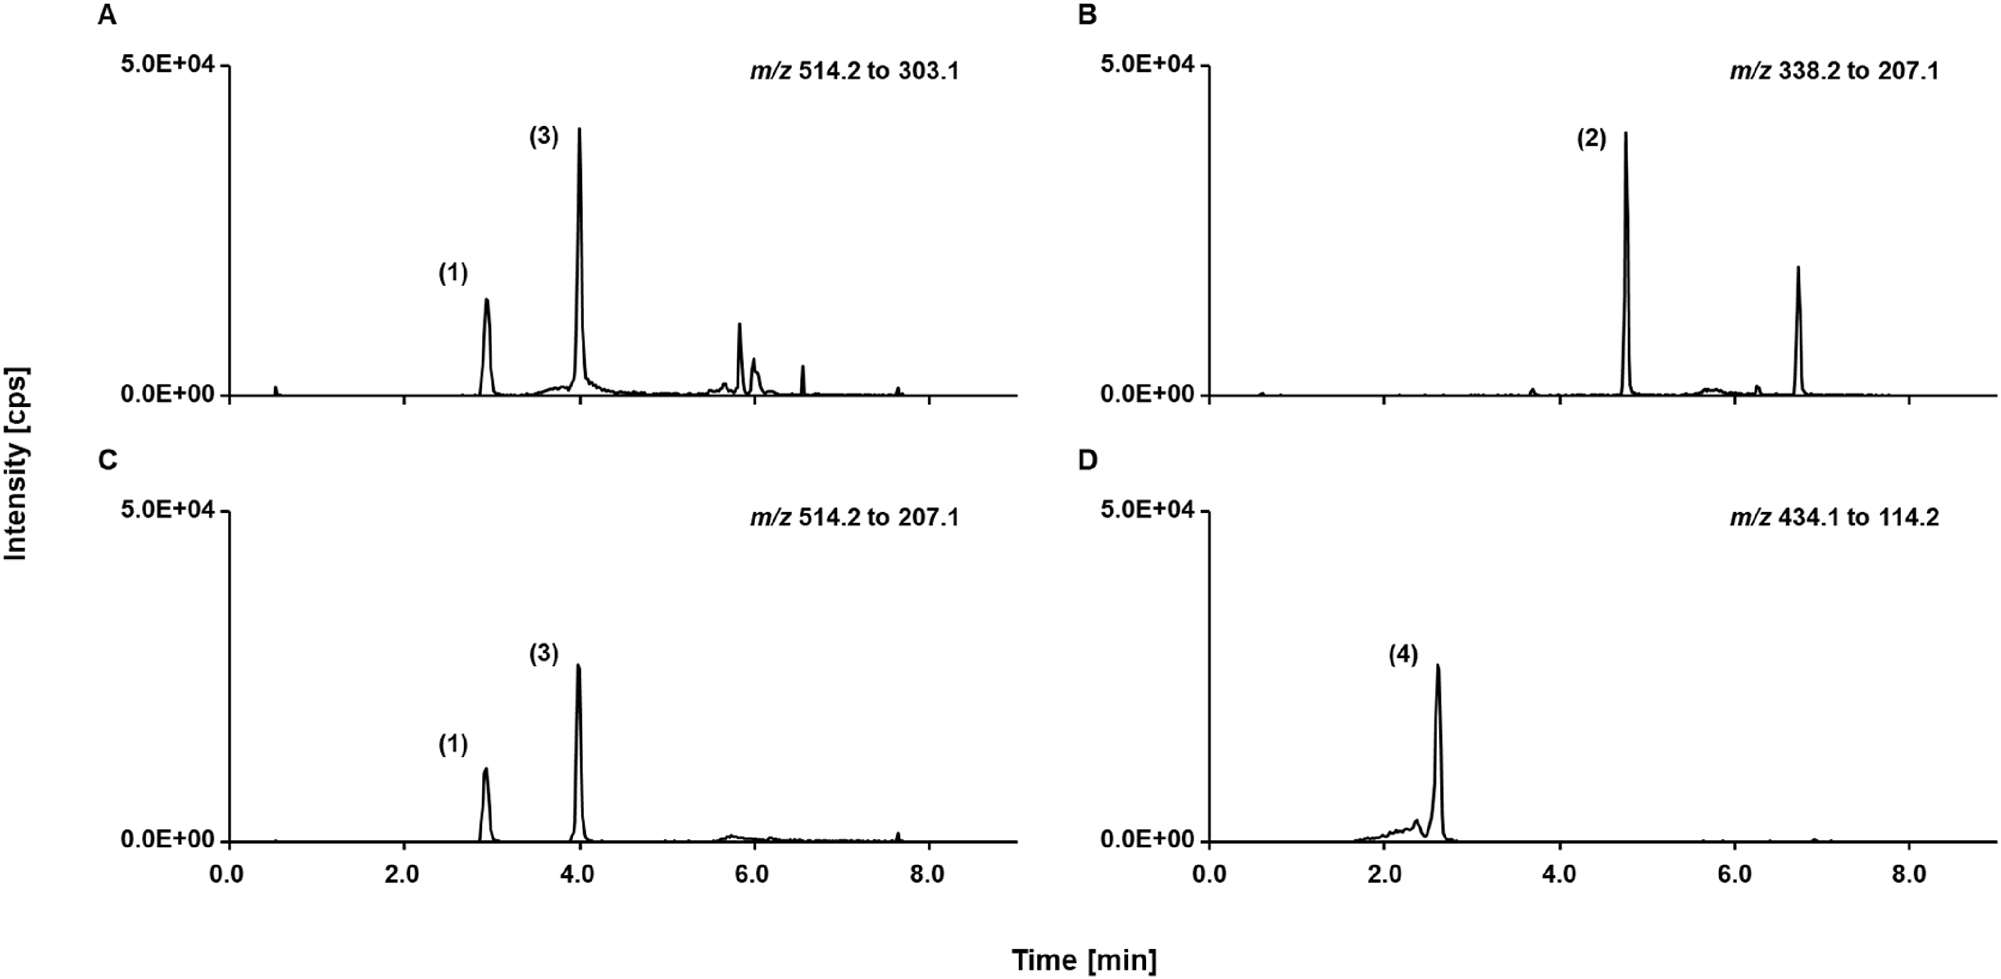
LC-MS/MS read outs of spiked analyte-free human serum sample containing 15.0 μg/mL of each mycophenolic acid glucuronide (peak 1), mycophenolic acid (peak 2), mycophenolic acid acyl glucuronide (peak 3), and mycophenolate mofetil (peak 4), SRM ion traces of (A) mycophenolic acid glucuronide, (B) mycophenolic acid, (C) mycophenolic acid acyl glucuronide, (D) mycophenolate mofetil.
Selectivity
Baseline separation of MPAG and MPA, acyl-MPAG, and MMF was achieved using a Phenomenex Luna C18(2) column resulting in a chromatographic resolution ≥2.7 for all tested interferences (Figure 1). Moreover, no signals were detected at the expected retention time of MPAG (3.0±0.5 min) when sample pools of analyte-free human serum, TDM-free serum, and Li-heparin plasma were measured (Figure 2). Furthermore, the ISTD showed no residue of the unlabeled analyte and no interferences were observed within the retention time window of MPAG, making it suitable for use in this RMP.
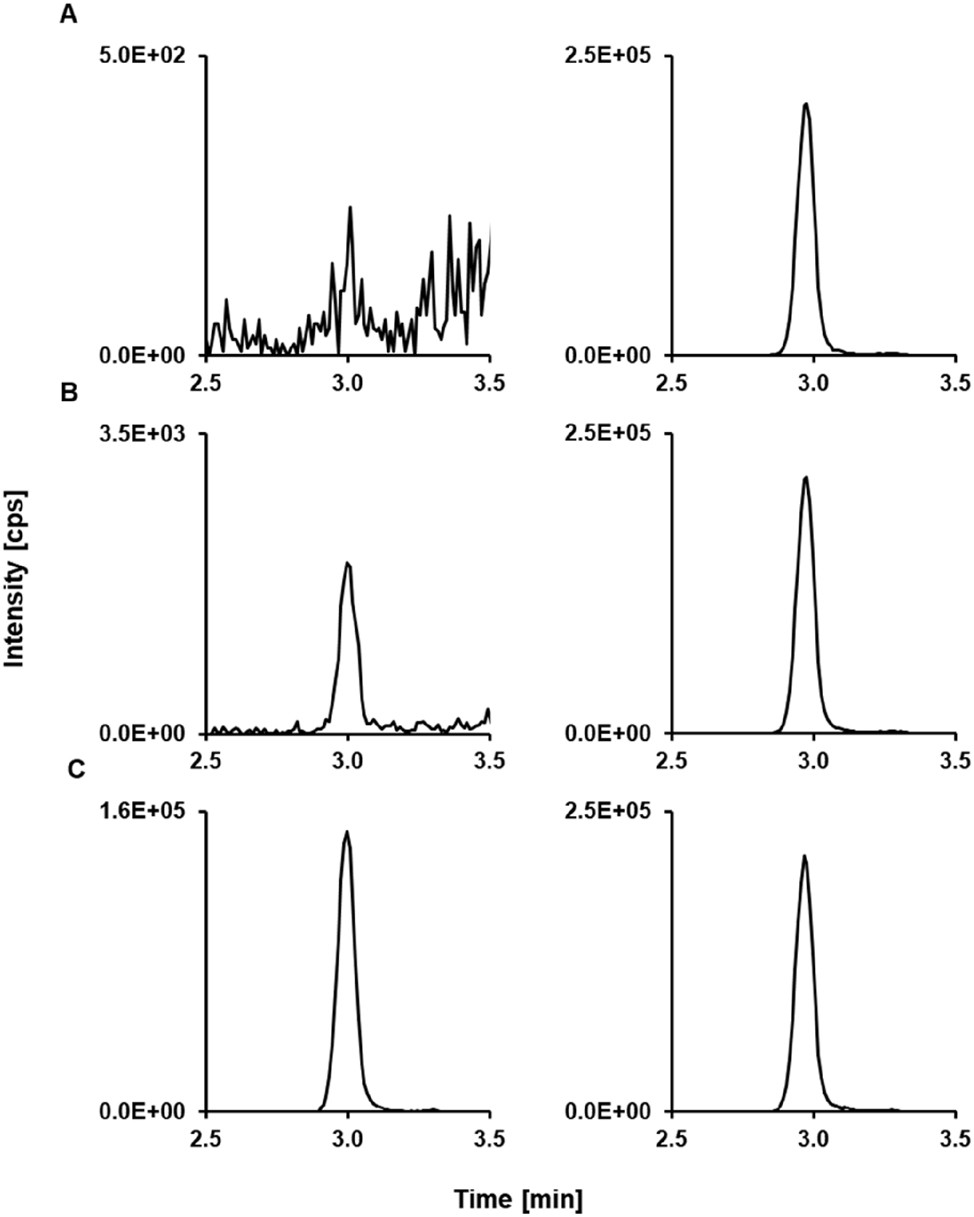
Mycophenolic acid glucuronide LC-MS/MS derived analytical readouts. (A) Chromatogram of a matrix blank showing the analyte SRM ion trace (left) and the ISTD SRM ion trace (right). (B) Chromatogram of the lowest calibrator level with a concentration of 0.750 μg/mL mycophenolic acid glucuronide spiked in analyte-free human serum; analyte (left) and ISTD (right). (C) Patient sample pool (n≥5) with a concentration of 58.3 μg/mL; analyte (left) and ISTD (right). ISTD, internal standard; LC-MS/MS, liquid chromatography-tandem mass spectrometry.
Matrix effect
A post-column infusion experiment revealed no significant shift in the ionization field at the expected retention time in analyte-free human serum, TDM-free serum, and plasma matrices (K2-EDTA, K3-EDTA, and Li-heparin). Additionally, MEs were investigated by comparing mean slopes and coefficients of determination of calibrations in different matrices (analyte-free human serum, TDM-free serum, Li-heparin plasma) and calibration in neat solution (45 % acetonitrile in mobile phase A (v+v)). Mean slopes were found to be 0.0121 (95 % CI 0.0117 to 0.0124) for the analyte-free human serum, 0.0122 (95 % CI 0.0118 to 0.0125) for the neat solution, 0.0121 (95 % CI 0.0116 to 0.0126) for the TDM-free serum and 0.0123 (95 % CI 0.0116 to 0.0129) for the Li-heparin plasma. 95 % CIs are overlapping and therefore they are not significantly different from each other, and no ME is present. In addition, the coefficients of determination were ≥0.999. Matrix samples (n=6, sample preparations), when calibrated against calibrators in neat, showed a relative bias for all matrices and levels ranging from −1.8 to 4.0 %.
Furthermore, relative MEs were evaluated based on absolute peak areas. Analyte and ISTD peak areas, as well as area ratios from spiked matrix samples, were compared to those from spiked neat samples. In all tested matrices, the MEs for the analyte ranged from 98 to 106 %, while ISTD values ranged from 100 to 103 %. At the lowest concentration level, the MEs for the analyte ranged from 103 to 111 %, while the ISTD values ranged from 100 to 102 % (Table 1), indicating the possibility of MEs. This variability results from two out of five preparations showing increased analyte peak areas while ISTD peak areas remained constant. However, since all concentration levels were prepared from the same matrix pool, the presence of significant MEs can be excluded. Furthermore, all other measurements were unaffected, and the ISTD effectively corrected for any potential variations in the mass spectrometry signals in the remaining preparations.
Matrix effect data of three different matrices compared to neat analyte solutions. Analyte peak areas, ISTD peak areas, and analyte/ISDT area ratios as used in analyte quantification were investigated. Means from five-fold analysis were used as data input. The relative matrix effect (ME) was calculated as ME (%)=set 2/set 1 × 100, where set 2 corresponds to the respective matrix samples and set 1 to the neat samples. No matrix effect is present if ME=100 %.
| MPAG level, concentration | Analyte | ISTD | Area ratio | ||||
|---|---|---|---|---|---|---|---|
| Mean, % | 95 % CI, % | Mean, % | 95 % CI, % | Mean, % | 95 % CI, % | ||
| Level 1, 2.00 µg/mL | Analyte-free human serum | 111 | 102 to 120 | 100 | 99 to 101 | 111 | 101 to 121 |
| TDM-free serum | 111 | 104 to 119 | 103 | 102 to 103 | 109 | 101 to 116 | |
| Li-heparin plasma | 103 | 100 to 106 | 102 | 101 to 102 | 101 | 98 to 104 | |
| Level 2, 40.0 µg/mL | Analyte-free human serum | 104 | 102 to 105 | 100 | 100 to 100 | 103 | 102 to 105 |
| TDM-free serum | 104 | 101 to 106 | 100 | 100 to 101 | 103 | 101 to 105 | |
| Li-heparin plasma | 106 | 104 to 108 | 101 | 100 to 101 | 105 | 103 to 108 | |
| Level 3, 400 µg/mL | Analyte-free human serum | 98 | 92 to 104 | 100 | 99 to 101 | 98 | 92 to 104 |
| TDM-free serum | 99 | 89 to 109 | 101 | 100 to 102 | 99 | 89 to 108 | |
| Li-heparin plasma | 103 | 87 to 118 | 100 | 99 to 100 | 103 | 89 to 118 | |
-
MPAG, mycophenolic acid glucuronide; CI, confidence interval; ISTD, internal standard; ME, matrix effect; TDM, therapeutic drug monitoring.
Linearity
The linearity of the method was proven by analyzing calibration curves extended by ±20 % at the lower and higher end (0.600 and 720 μg/mL). Residuals were randomly distributed in a quadratic model. The mean coefficient of determination was 0.999 (95 % CI from 0.998 to 1.000). The samples 1 to 11 were evaluated, demonstrating a linear dependence with a coefficient of determination of 1.000. The relative deviation ranged from −3.8 to 2.7 % and the CV was found to be ≤3.8 %.
Lower limit of measuring interval
The LLMI was determined by using spiked samples at the lowest calibrator level (0.750 μg/mL). Relative bias showed a deviation of −3.3 % and the CV was 3.2 % (n=4, preparations).
Precision and accuracy
Precision was evaluated through a five-day validation experiment. The repeatability CV for both serum and plasma samples ranged from 0.8 to 1.0 %, except at the lowest concentration level where it was ≤4.0 % (Table 2). The intermediate precision CV for all concentrations and matrices remained consistently below 1.5 %, except for the lowest concentration, which showed CVs of 3.7 and 4.6 %, respectively.
Precision performance parameters for mycophenolic acid glucuronide quantification using the candidate RMP (n=60 measurements).
| Variance source | Serum samples CV, % | |||||
|---|---|---|---|---|---|---|
| Level 12.00 μg/mL | Level 240.0 μg/mL | Level 3200 μg/mL | Level 4400 μg/mL | Patient sample 1 58.3 μg/mL | Patient sample 2 166 μg/mL | |
| Intermediate precision | 3.7 | 1.2 | 0.9 | 1.1 | 1.3 | 1.1 |
| Between-day | 1.1 | 0.7 | 0.5 | 0.7 | 0.7 | 0.6 |
| Between-calibration | 0.6 | 0.4 | 0.1 | 0.3 | 0.5 | 0.5 |
| Repeatability | 3.5 | 0.9 | 0.7 | 0.8 | 1.0 | 0.8 |
| Between-preparation | 0.0 | 0.0 | 0.0 | 0.2 | 0.2 | 0.5 |
| Between-injection | 3.5 | 0.9 | 0.7 | 0.8 | 0.9 | 0.6 |
| Variance source | Plasma samples CV, % | |||
|---|---|---|---|---|
| Level 1 2.00 μg/mL | Level 2 40.0 μg/mL | Level 3 200 μg/mL | Level 4 400 μg/mL | |
| Intermediate precision | 4.6 | 1.5 | 1.2 | 1.2 |
| Between-day | 1.7 | 0.0 | 0.9 | 0.7 |
| Between-calibration | 1.4 | 1.3 | 0.0 | 0.5 |
| Repeatability | 4.0 | 0.8 | 0.8 | 0.8 |
| Between-preparation | 0.0 | 0.1 | 0.0 | 0.4 |
| Between-injection | 4.0 | 0.8 | 0.8 | 0.7 |
-
CV, coefficient of variation; RMP, reference measurement procedure; conversion factor µg/mL to µmol/L: 2.0. The coefficients of variation for repeatability and intermediate precision, which were determined from the individual variances, are printed in bold.
The mean bias was evaluated using three preparations of each operator (n=6). The relative mean bias ranged from −0.9 to 3.2 % for spiked analyte-free human serum samples and from −0.3 to 2.6 % for Li-heparin plasma samples. Dilution integrity was proven for high concentrated samples above the measuring range with a bias ranging from 2.6 to 3.2 % (Table 3). The corresponding CIs showed that the results were distributed around the nominal concentration.
Bias and 95 % CI of spiked analyte-free human serum and Li-heparin plasma samples (n=6). The mean bias and corresponding confidence intervals were calculated using the individual sample biases of n=6 preparations.
| MPAG level, concentration | Serum | Plasma | ||
|---|---|---|---|---|
| Mean bias, % | 95 % CI, % | Mean bias, % | 95 % CI, % | |
| Level 1, 2.00 μg/mL | −0.9 | −3.3 to 1.4 | −0.3 | −2.7 to 2.2 |
| Level 2, 40.0 μg/mL | 3.2 | 2.6 to 3.7 | 0.9 | 0.3 to 1.5 |
| Level 3, 200 μg/mL | 2.8 | 2.4 to 3.3 | 2.6 | 1.8 to 3.4 |
| Level 4, 400 μg/mL | 1.4 | 0.7 to 2.0 | 1.1 | 0.5 to 1.7 |
| Dilution 1, 640 μg/mL | 2.6 | 2.1 to 3.1 | / | / |
| Dilution 2, 800 μg/mL | 3.2 | 2.7 to 3.8 | / | / |
-
MPAG, mycophenolic acid glucuronide; CI, confidence interval. Conversion factor µg/mL to µmol/L: 2.0.
Stability
Samples spiked in analyte-free human serum were stable at 7 °C over a period of 6 days with a mean recovery of 99 %. MPAG spiked in analyte-free human serum stored at −20 °C were found to be stable over a period of 27 days with a mean recovery of 101 %.
Equivalence of results between independent laboratories
A method comparison study containing 101 native anonymized patient samples was performed between two independent laboratories. From these samples one sample was highlighted as an outlier using the LORELIA (local reliability) outlier test [28] and therefore excluded from the evaluation.
Passing-Bablok regression analysis showed a good agreement between the two laboratories and resulted in a regression equation with a slope of 1.02 (95 % CI 1.01 to 1.03) and an intercept of 0.03 (95 % CI –0.24 to 0.25). Moreover, the Pearson correlation coefficient was 0.999. The Bland-Altman analysis showed a mean bias of 1.8 % with a (95 % CI 1.4 to 2.2) (Figure 3B). The data scatter was independent of the analyte concentration, ranging from −1.9 to 5.6 % (lower limit CI interval from −2.6 to −1.3 %, upper limit CI interval 4.9–6.2 %).
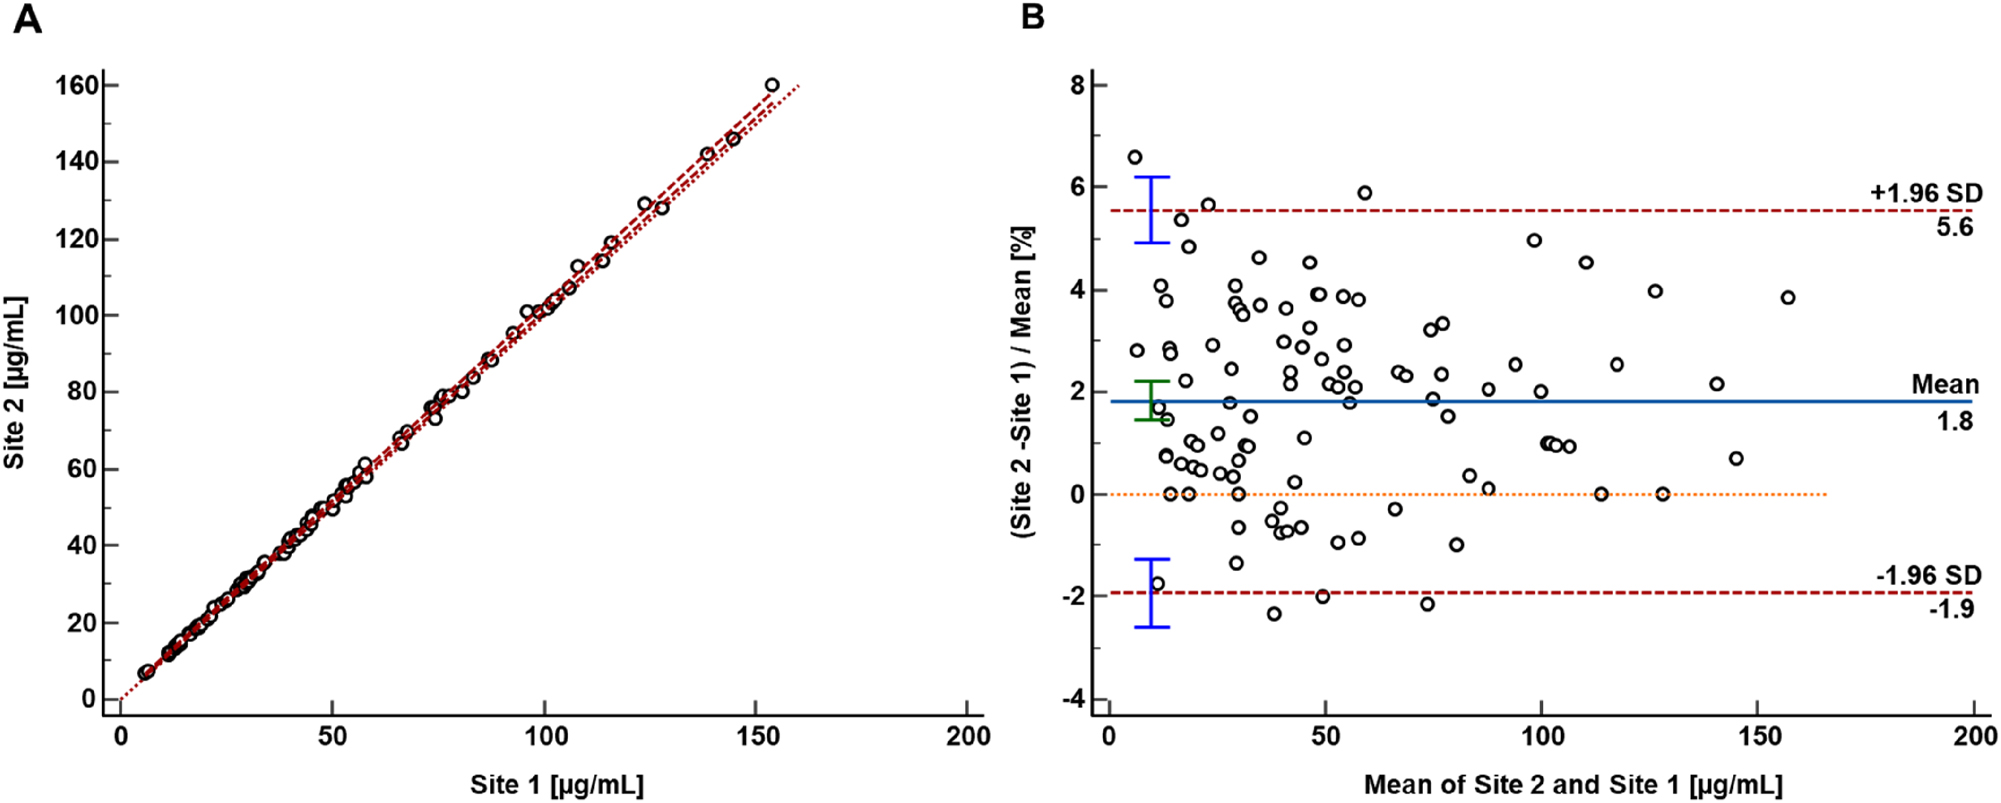
Results from the patient sample-based mycophenolic acid glucuronide comparison study performed between two independent laboratories. (A) Passing-Bablok regression plot including the Pearson regression analysis for the method comparison study of the RMP (n=100 patients) between the independent laboratories (site 1 Dr. Risch Ostschweiz AG and site 2 Roche Diagnostics GmbH). Passing-Bablok regression analysis resulted in a regression equation with a slope of 1.02 (95 % CI 1.01 to 1.03) and an intercept of 0.03 (95 % CI –0.24 to 0.25). The Pearson correlation value was ≥0.999. (B) Bland-Altman plot resulted in an inter-laboratory measurement bias of 1.8 % (95 % CI interval from 1.4 to 2.2 %) and a 2S interval of the relative difference of 3.7 % (lower limit CI interval from −2.6 to −1.3 %, upper limit CI interval from 4.9 to 6.2 %).
Precision performance evaluation within the second laboratory showed CVs for repeatability and intermediate precision of ≤2.7 % and ≤4.4 %, respectively. These data indicate that the proposed RMP for MPAG is transferable between laboratories, emphasizing the robustness of the protocol design.
Uncertainty of results
The estimation of uncertainty of the calibrators was done as a type B evaluation. In the precision experiment all other aspects, e.g., calibration, sample preparation, measurement and evaluation of the sample result, were evaluated as type A uncertainty. Measurement uncertainties (k=1) for single measurements of spiked analyte-free human serum samples ranged from 1.2 to 3.8 % and was reduced to 0.9–1.6 % for target value assignment (n=6, three measurements on two days) (Tables 4 and 5). Consequently, the expanded measurement uncertainties (k=2) ranged from 2.4 to 7.7 % for single measurements and from 1.8 to 3.3 % for target value assignment.
Overview of measurement uncertainty for mycophenolic acid glucuronide quantification with the candidate RMP in spiked analyte-free human serum samples for single measurements.
| Level | ||||||
|---|---|---|---|---|---|---|
| Level 1 2.00 μg/mL | Level 2 40.0 μg/mL | Level 3 200 μg/mL | Level 4 400 μg/mL | Patient sample 1 58.3 μg/mL | Patient sample 2 166 μg/mL | |
| Type B uncertainty: calibrator preparation, CV, % | 1.1 | 0.9 | 0.9 | 0.9 | 0.9 | 0.9 |
|
|
||||||
| Characterization of reference material | ||||||
| Preparation of | ||||||
| Stock solution | 0.49 | 0.49 | 0.49 | 0.49 | 0.49 | 0.49 |
| Working solution | 0.67 | |||||
| Spike solution | 0.87 | 0.72 | 0.62 | 0.62 | 0.62 | 0.62 |
| Matrix-based calibrator | 1.06 | 0.95 | 0.87 | 0.87 | 0.87 | 0.87 |
| Type A uncertainty: intermediate precision, CV, % | 3.7 | 1.2 | 0.9 | 1.1 | 1.3 | 1.1 |
| Measurement uncertainty (k=1), % | 3.8 | 1.5 | 1.2 | 1.4 | 1.6 | 1.4 |
| Expanded measurement uncertainty (k=2), % | 7.7 | 3.1 | 2.4 | 2.8 | 3.2 | 2.7 |
-
CV, coefficient of variation; RMP, reference measurement procedure. Conversion factor µg/mL to µmol/L: 2.0. The measurement uncertainty of the whole approach for a single measurement estimated as a combination of the uncertainty of calibrator preparation (type B uncertainty) and uncertainty of the precision experiment (type A uncertainty) are given in bold.
Overview of measurement uncertainty for mycophenolic acid glucuronide quantification with the candidate RMP in spiked analyte-free human serum samples for multiple measurements (n=6).
| Level | ||||||
|---|---|---|---|---|---|---|
| Level 1 2.00 μg/mL | Level 2 40.0 μg/mL | Level 3 200 μg/mL | Level 4 400 μg/mL | Patient sample 1 58.3 μg/mL | Patient sample 2 166 μg/mL | |
| Type B uncertainty: calibrator preparation, CV, % | 1.1 | 0.9 | 0.9 | 0.9 | 0.9 | 0.9 |
|
|
||||||
| Characterization of reference material | ||||||
| Preparation of | ||||||
| Stock solution | 0.49 | 0.49 | 0.49 | 0.49 | 0.49 | 0.49 |
| Working solution | 0.67 | |||||
| Spike solution | 0.87 | 0.72 | 0.62 | 0.62 | 0.62 | 0.62 |
| Matrix-based calibrator | 1.06 | 0.95 | 0.87 | 0.87 | 0.87 | 0.87 |
| Type A uncertainty: intermediate precision, CV, % | 1.5 | 0.1 | 0.3 | 0.3 | 0.3 | 0.3 |
| Measurement uncertainty (k=1), % | 1.6 | 1.0 | 0.9 | 0.9 | 0.9 | 0.9 |
| Expanded measurement uncertainty (k=2), % | 3.3 | 1.9 | 1.8 | 1.9 | 1.9 | 1.9 |
-
CV, coefficient of variation; RMP, reference measurement procedure. Conversion factor µg/mL to µmol/L: 2.0. The measurement uncertainty of the whole approach for a single measurement estimated as a combination of the uncertainty of calibrator preparation (type B uncertainty) and uncertainty of the precision experiment (type A uncertainty) are given in bold.
Discussion
The presented candidate RMP based on ID-LC-MS/MS allows the measurement of MPAG concentration in human serum and plasma. Material characterization was performed using qNMR which allowed the establishment of an unbroken traceability chain from the candidate RMP to SI Units (kg and mole). Calibration and control concentrations were carefully optimized to adequately cover the measurement range. The pipetting scheme, encompassing the selection of pipette volumes and the number of steps, was refined to minimize uncertainty contributions. Uncertainty contributions were further reduced by designing a single analyte candidate RMP. Hence, it was ensured that LC-MS/MS instrument settings depending on physiochemical target analyte properties as the MS source parameters and the LC mobile phase compositions were tailored to the specific needs of MPAG.
Optimization of the sample preparation involved fluid handling, selecting optimal pipettes, adjusting protein precipitation with equilibration times, and diluting samples to fall within the linear range of the MS detector. In this case, it was not feasible to combine the sample preparation and LC-MS/MS method with MPA. The goal of developing a highly selective and stable method was only achieved for MPAG by creating two separate methods.
The validation study showed that the method is highly selective and allows the determination of MPAG to low concentrations without interference of MPA, MMF, and acyl-MPAG, or the matrix. Moreover, the absence of MEs was confirmed by a calibration slope comparison in addition to an ion yield attenuation experiment.
The target measurement uncertainty, based on a pharmacokinetic approach, suggests that an RMP for MPAG should be ≤2.1 % (k=1) and ≤4.2 % (k=2). For target value assignments we therefore use multiple sample preparation to meet this goal. Complaint samples can be measured using a single sample preparation.
The method comparison study between two independent laboratories yielded equivalent results with no significant increase in bias. Hence, the robustness of the preparation of calibration solutions and samples has been shown.
Conclusions
The analytical protocol reported herein presents the use of qNMR-characterized reference standards to ensure traceability to SI units along with the determination of the absolute content (mass fraction), and to allow direct calibration of the RMP. When used alongside the highly selective ID-LC-MS/MS method for MPAG quantification in human blood samples, this protocol allows for both the standardization of routine tests and the reliable evaluation of clinical samples.
Acknowledgments
We would like to thank Aline Hoffmeister, Monika Kriner, and Michael Dedio for their support in selecting and providing samples.
-
Research ethics: All procedures were in accordance with the Helsinki Declaration. All samples used were exclusively anonymized leftover samples.
-
Informed consent: Not applicable.
-
Author contributions: All authors confirmed they have contributed to the intellectual content of this paper and have met the following 4 requirements: (a) significant contributions to the conception and design, acquisition of data, or analysis and interpretation of data; (b) drafting or revising the article for intellectual content; (c) final approval of the published article; and (d) agreement to be accountable for all aspects of the article thus ensuring that questions related to the accuracy or integrity of any part of the article are appropriately investigated and resolved.
-
Use of Large Language Models, AI and Machine Learning Tools: Roche Chat, Roche’s artificial intelligence (AI) Technology, was used to improve the language of the manuscript.
-
Conflict of interest: Lorenz Risch is an employee of Dr. Risch Ostschweiz AG. Tobias Schierscher, Janik Wild, Julia Hoop, Christoph Seger were all employees of Dr. Risch Ostschweiz AG at the time the study was conducted. Judith Taibon, Neeraj Singh, Martina Bachmann, and Andrea Geistanger, are all employees of Roche Diagnostics GmbH. Friederike Bauland is an employee of Chrestos Concept GmbH & Co. KG, (Girardetstraße 1–5, 45131 Essen, Germany) and did the work on behalf of Roche Diagnostics GmbH. Roche employees holding Roche non-voting equity securities (Genussscheine): Judith Taibon, Andrea Geistanger.
-
Research funding: This research was funded by Roche Diagnostics GmbH. Lorenz Risch with team is a funded cooperation partner of Roche Diagnostics GmbH. Christoph Seger receives a consultant honorarium from Roche Diagnostics GmbH.
-
Data availability: The raw data can be obtained on request from the corresponding author.
References
1. Bergan, S, Brunet, M, Hesselink, DA, Johnson-Davis, KL, Kunicki, PK, Lemaitre, F, et al.. Personalized therapy for mycophenolate: consensus report by the International Association of Therapeutic Drug Monitoring and Clinical Toxicology. Ther Drug Monit 2021;43:150–200. https://doi.org/10.1097/FTD.0000000000000871.Search in Google Scholar PubMed
2. Merrigan, SD, Kish-Trier, E, Seegmiller, JC, Johnson-Davis, KL. LC–MS/MS method for quantitation of mycophenolic acid, mycophenolic acid acyl-glucuronide, and 7-O-mycophenolic acid glucuronide in serum. Clin Mass Spectrom 2017;3:41–8. https://doi.org/10.1016/j.clinms.2017.07.001.Search in Google Scholar PubMed PubMed Central
3. Pawinski, T, Durlik, M, Szlaska, I, Urbanowicz, A, Majchrnak, J, Gralak, B. Comparison of mycophenolic acid pharmacokinetic parameters in kidney transplant patients within the first 3 months post-transplant. J Clin Pharm Therapeut 2006;31:27–34. https://doi.org/10.1111/j.1365-2710.2006.00713.x.Search in Google Scholar PubMed
4. Merkel, U, Lindner, S, Vollandt, R, Sperschneider, H, Balogh, A. Trough levels of mycophenolic acid and its glucuronidated metabolite in renal transplant recipients. Int J Clin Pharmacol Therapeut 2005;43:379–88. https://doi.org/10.5414/cpp43379.Search in Google Scholar PubMed
5. Colom, H, Lloberas, N, Andreu, F, Caldés, A, Torras, J, Oppenheimer, F, et al.. Pharmacokinetic modeling of enterohepatic circulation of mycophenolic acid in renal transplant recipients. Kidney Int 2014;85:1434–43. https://doi.org/10.1038/ki.2013.517.Search in Google Scholar PubMed
6. Drevland, OM, de Muinck, EJ, Trosvik, P, Hammerstad, M, Kvitne, KE, Midtvedt, K, et al.. Microbiome-derived reactivation of mycophenolate explains variations in enterohepatic recirculation in kidney transplant recipients. Microbiome 2025;13:169. https://doi.org/10.1186/s40168-025-02142-6.Search in Google Scholar PubMed PubMed Central
7. Saqr, A, Carlson, B, Staley, C, Rashidi, A, Al-Kofahi, M, Kaiser, T, et al.. Reduced enterohepatic recirculation of mycophenolate and lower blood concentrations are associated with the stool bacterial microbiome after hematopoietic cell transplantation. Transplant Cell Ther 2022;28:372.e1–372.e9. https://doi.org/10.1016/j.jtct.2022.04.018. Epub 2022 Apr 27. PMID: 35489611.Search in Google Scholar PubMed
8. Huang, YF, Huang, YC, Ning, HC, Lin, CN. Quantitation of mycophenolic acid and metabolites by UPLC-MS/MS in renal transplant patients. J Food Drug Anal 2022;30:283–92. https://doi.org/10.38212/2224-6614.3404. PMID: 39666298; PMCID: PMC9635907.Search in Google Scholar PubMed PubMed Central
9. Bureau International des Poids et Mesures. JCTLM database: laboratory medicine and in vitro diagnostics [Online]. https://www.jctlmdb.org/#/app/home [Accessed 14 June 2024].Search in Google Scholar
10. Seger, C, Kessler, A, Taibon, J. Establishing metrological traceability for small molecule measurands in laboratory medicine. Clin Chem Lab Med 2023;61:1890–901. https://doi.org/10.1515/cclm-2022-0995.Search in Google Scholar PubMed
11. International Organization for Standardization. In vitro diagnostic medical devices‐requirements for establishing metrological traceability of values assigned to calibrators, trueness control materials and human samples. Geneva, Switzerland: ISO; 2020. ISO 17511:2020.Search in Google Scholar
12. MPA manuscript submitted to CCLM, accepted for publication at CCLM.Search in Google Scholar
13. International Organization for Standardization. In vitro diagnostic medical devices – measurement of quantities in samples of biological origin – requirements for content and presentation of reference measurement procedures. Geneva, Switzerland: ISO; 2009. ISO 15193:2009.Search in Google Scholar
14. Braga, F, Panteghini, M. The utility of measurement uncertainty in medical laboratories. Clin Chem Lab Med 2020;58:1407–13. https://doi.org/10.1515/cclm-2019-1336.Search in Google Scholar PubMed
15. Steele, BW, Wang, E, Palomaki, GE, Klee, GG, Elin, RJ, Soldin, SJ, et al.. An evaluation of analytic goals for assays of drugs: a College of American Pathologists Therapeutic Drug Monitoring Survey Study. Arch Pathol Lab Med 2001;125:729–35. https://doi.org/10.5858/2001-125-0729-AEOAGF.Search in Google Scholar PubMed
16. Glick, JHJ. Expression of random analytical error as a precentage of the range of clinical interest. Clin Chem 1976;22:475–83. https://doi.org/10.1093/clinchem/22.4.475.Search in Google Scholar
17. Ayers, G, Burnett, D, Griffiths, A, Richens, A. Quality control of drug assays. Clin Pharmacokinet 1981;6:106–17. https://doi.org/10.2165/00003088-198106020-00002.Search in Google Scholar PubMed
18. Uchiyama, N, Hosoe, J, Miura, T, Sugimoto, N, Ishizuki, K, Yamada, Y, et al.. Determination of absolute purities of hygroscopic substances by quantitative NMR analysis for the standardization of quantitative reagents in the Japanese pharmacopoeia (Part 2). Chem Pharm Bull (Tokyo) 2021;69:26–31. https://doi.org/10.1248/cpb.c20-00296.Search in Google Scholar PubMed
19. Uchiyama, N, Hosoe, J, Sugimoto, N, Ishizuki, K, Koide, T, Murabayashi, M, et al.. Absolute purity determination of a hygroscopic substance, indocyanine green, using quantitative NMR (qNMR). Chem Pharm Bull (Tokyo) 2021;69:118–23. https://doi.org/10.1248/cpb.c20-00728.Search in Google Scholar PubMed
20. Suiter, CL, Widegren, JA. Hygroscopic tendencies of substances used as calibrants for quantitative nuclear magnetic resonance spectroscopy. Anal Chem 2021;93:16977–80. https://doi.org/10.1021/acs.analchem.1c04268.Search in Google Scholar PubMed PubMed Central
21. Clinical and Laboratory Standards Institute (CLSI). C62-A. Liquid chromatography-mass spectrometry methods; approved guideline. Wayne, Pennsylvania: CLSI; 2014.Search in Google Scholar
22. European Medicines Agency (EMA). ICH harmonised tripartite guideline. In: Validation of analytical procedures: text and methodology q2(r1). Amsterdam, Netherlands: EMA; 1995.Search in Google Scholar
23. Working Group 1 of the Joint Committee for Guides in Metrology (JCGM/WG1). Evaluation of measurement data – guide to the expression of uncertainty in measurement (GUM), (2008; GUM 1995 with minor corrections). https://www.bipm.org/documents/20126/2071204/JCGM_100_2008_E.pdf/cb0ef43f-baa5-11cf-3f85-4dcd86f77bd6 [Accessed 08 July 2024].Search in Google Scholar
24. Matuszewski, BK. Standard line slopes as a measure of a relative matrix effect in quantitative HPLC-MS bioanalysis. J Chromatogr, B: Anal Technol Biomed Life Sci 2006;830:293–300. https://doi.org/10.1016/j.jchromb.2005.11.009.Search in Google Scholar PubMed
25. Matuszewski, BK, Constanzer, ML, Chavez-Eng, CM. Strategies for the assessment of matrix effect in quantitative bioanalytical methods based on HPLC-MS/MS. Anal Chem 2003;75:3019–30. https://doi.org/10.1021/ac020361s.Search in Google Scholar PubMed
26. Schuetzenmeister, A, Dufey, F. VCA: variance component analysis. https://cran.r-project.org/web/packages/VCA/index.html [Accessed 14 Jun 2023].Search in Google Scholar
27. Taibon, J, Santner, T, Singh, N, Ibrahim, SC, Babitzki, G, Köppl, D, et al.. An isotope dilution-liquid chromatography-tandem mass spectrometry (ID-LC-MS/MS)-based candidate reference measurement procedure (RMP) for the quantification of aldosterone in human serum and plasma. Clin Chem Lab Med 2023;61:1902–16. https://doi.org/10.1515/cclm-2022-0996.Search in Google Scholar PubMed
28. Rauch, G, Geistanger, A, Timm, J. A new outlier identification test for method comparison studies based on robust regression. J Biopharm Stat 2011;21:151–69. https://doi.org/10.1080/10543401003650275.Search in Google Scholar PubMed
Supplementary Material
This article contains supplementary material (https://doi.org/10.1515/cclm-2025-1052).
© 2025 the author(s), published by De Gruyter, Berlin/Boston
This work is licensed under the Creative Commons Attribution 4.0 International License.