Assessing the clinical applicability of dimensionality reduction algorithms in flow cytometry for hematologic malignancies
-
Min-Seung Park
 ,
Jong Kwon Lee
,
Boram Kim
,
Hee Young Ju
,
Keon Hee Yoo
,
Chul Won Jung
,
Hee-Jin Kim
and
Hyun-Young Kim
,
Jong Kwon Lee
,
Boram Kim
,
Hee Young Ju
,
Keon Hee Yoo
,
Chul Won Jung
,
Hee-Jin Kim
and
Hyun-Young Kim


Abstract
Objectives
Despite its utility, interpreting multiparameter flow cytometry (MFC) data for hematologic malignancy remains time-intensive and complex. This study evaluated the applicability of two dimensionality reduction (DR) algorithms, t-distributed stochastic neighbor embedding (t-SNE) and uniform manifold approximation and projection (UMAP), to MFC data of hematologic malignancy.
Methods
A total of 237 samples were re-analyzed by t-SNE- and UMAP-based gating: 80 with acute leukemia orientation tube panel, 42 with B-cell lymphoma (BCL) panel, 45 with multiple myeloma (MM) panel, 40 and 30 with measurable residual disease (MRD) panels for B-cell acute lymphoblastic leukemia (B-MRD) and MM (MM-MRD), respectively. Each result was compared to the manual gating, and sensitivity and precision were assessed using BCL and B-MRD panels.
Results
Compared to manual gating, DR-based gating demonstrated agreements over 95.0 % for all MFC panels, and quantitative correlations (ρ) exceeded 0.94. Both t-SNE- and UMAP-based gating showed a sensitivity and negative predictive value of 100 %. Also, in one sample each from the BCL and MM-MRD panels, DR-based gating identified populations that were missed by manual gating. Sensitivity evaluation showed that both t-SNE- and UMAP-based gating successfully identified MRD populations down to the lowest MRD level of 10−5.30 when applying primary-gating strategy for CD19-positive population. Precision evaluation showed coefficient of variation below 10 % across all levels.
Conclusions
This study shows that DR-based gating streamlines data interpretation and minimizes overlooked populations, demonstrating significant potential as a valuable tool in MFC analysis for hematologic malignancies.
Introduction
Flow cytometry is an essential tool in the diagnosis and monitoring of hematologic malignancies, allowing for rapid evaluation of the immunophenotype of target cells [1], 2]. Multiparameter flow cytometry (MFC) utilizes multiple light sources to simultaneously analyze several fluorochrome-conjugated antigens on a single cell, providing a significant advantage over immunohistochemistry [3]. In clinical laboratories, MFC panels are organized based on the immunophenotype of the target cell. Depending on various combinations of antigens and fluorochromes, MFC typically analyzes more than 8 to 12 markers, along with physical parameters, for hematologic malignancies such as acute leukemia, lymphoma, and multiple myeloma (MM) [4], 5]. In addition, measurable residual disease (MRD) analysis often requires the use of more than 10 markers to ensure accurate identification and quantification of residual abnormal cell population [6], 7].
The primary challenge in MFC analysis is the complexity of data interpretation [8]. While the increased number of simultaneously detectable fluorochromes allows for more detailed information to be obtained from each cell, the resulting data must still be visualized in two-dimensional plots. As the number of markers increases, so does the number of possible plot combinations, leading to a more complex analysis process that requires significant time and effort for accurate interpretation. Recently, Chen et al. reported a study in which they utilized a 24-color panel for the analysis of MRD in AML [9]. This highlights the usefulness of MFC as a highly informative test, but also one that requires a high level of expertise.
Dimensionality reduction (DR) algorithms are processes used to reduce data complexity by reorganizing high-dimensional data into lower-dimensional (typically two-dimensional) representations where similar data points are positioned closer together [10], 11], and these algorithms are increasingly being applied in MFC for analyzing immune cell subsets and diagnosing hematologic malignancies [12], [13], [14]. Although several studies have applied DR to MFC [12], 15], there remains a lack of systematic approaches for applying DR algorithms to MFC data for the analysis of hematologic malignancies.
t-Distributed stochastic neighbor embedding (t-SNE) and uniform manifold approximation and projection (UMAP) are widely used DR algorithms for visualizing high-dimensional data. t-SNE reduces dimensionality by converting pairwise similarities into conditional probabilities and mapping them onto a lower-dimensional space using Student’s t-distribution, effectively preserving local structures while potentially distorting global relationships [16]. In contrast, UMAP constructs a k-nearest neighbors (k-NN) graph to capture the data’s topology and optimizes the cross-entropy between high- and low-dimensional representations [17]. Compared to t-SNE, UMAP offers better global structure preservation and faster computation, making it advantageous for large-scale data visualization [18], and these algorithms have been integrated into MFC analysis software tools, such as FlowJo (Becton Dickinson, CA, USA) and Cytobank (Beckman Coulter, CA, USA) [19], 20]. This study evaluated the diagnostic applicability of t-SNE and UMAP for MFC in various hematologic malignancies by comparing their ability to qualitatively identify abnormal cell populations and quantitatively determine their proportions with traditional manual gating analysis.
Materials and methods
Study samples
This study included 237 samples from 225 patients who underwent bone marrow (BM) examination and flow cytometry for a diagnosis of hematologic malignancies between January 2020 and April 2024 (Figure 1). Flow cytometry standard (FCS) data files were collected from 167 samples which underwent the diagnostic MFC panels (80 samples with acute leukemia orientation tube (ALOT) panel for hematopoietic precursor cells, 42 samples which underwent the B-cell lymphoma (BCL) panel, and 45 samples which underwent the MM panel), and 70 samples which underwent the MRD panels (40 samples with MRD of B-ALL (B-MRD), and 30 samples with MM-MRD). The study was performed in accordance with the Declaration of Helsinki. The study was approved by the Institutional Review Board of Samsung Medical Center, Seoul, Korea (Approval No. 2024-05-003). Due to the retrospective nature of the study, the Institutional Review Board waived the requirement for informed consent.
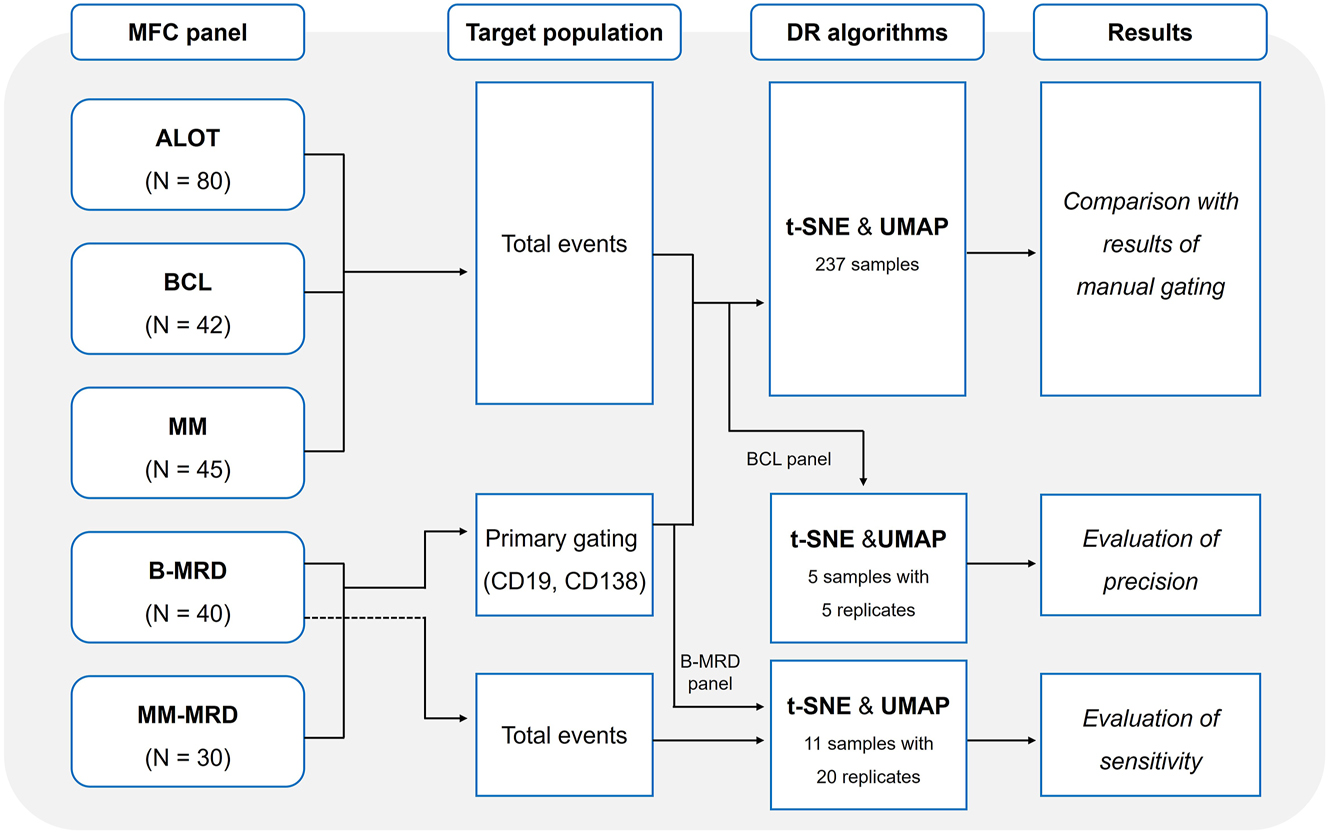
Study scheme of dimensionality reduction-based gating analysis for hematologic malignancies. The study included five MFC panels: acute leukemia orientation tube (ALOT, n=80), B-cell lymphoma (BCL, n=42), multiple myeloma (MM, n=45), B-cell acute lymphoblastic leukemia measurable residual disease (B-MRD, n=40), and MM measurable residual disease (MM-MRD, n=30).
MFC analysis
Daily instrument calibration and internal quality control were performed using BD CS&T Beads with BD FACSuite™ software on the BD FACSLyric™ flow cytometer (Becton Dickinson), following the manufacturer’s instructions. The CS&T module automatically adjusted photomultiplier tube (PMT) voltages, checked laser performance, and tracked instrument stability through Levey-Jennings charts of key metrics including median fluorescence intensity (MFI) values, relative fluorescence detection efficiency (Qr), relative optical background signal (Br), and robust coefficient of variation percentage (%rCV). When significant deviations from expected performance occurred, recalibration or maintenance was performed to ensure consistent data quality and reliability. Additionally, internal quality control using BD Multi-Check Control (Becton Dickinson) was performed monthly to verify the overall immunophenotyping process, including instrument performance and data analysis, by comparing results with the expected values provided by the manufacturer.
Diagnostic panels
For MFC analysis, fresh BM aspirate samples collected in K2 EDTA were used within 24 h. After incubating the cell suspensions with surface markers, red blood cells (RBCs) were lysed using FACS™ Lysing Solution (Becton Dickinson). For intracellular staining, cells with fixed surface markers were permeabilized (FIX & PERM™ Cell Permeabilization Kit, Nordic MUbio, Susteren, Netherlands) followed by staining with intracellular antibodies. Markers for each MFC panel consisted of seven or eight monoclonal antibodies (Becton Dickinson) (Supplementary Table 1). The ALOT panel was performed using lyophilized BD OneFlow™ ALOT (Becton Dickinson), while BCL and MM panels were conducted using monoclonal antibodies in liquid form, which were mixed at the time of testing. Flow cytometry was performed using a FACSLyric™ flow cytometer, with a total of 200,000 events (nucleated cells) acquired per sample, including debris and doublets. In manual gating, data analysis was conducted using Kaluza software (Beckman Coulter) as follows: 1) debris and RBCs were excluded using a Forward Scatter Area (FSC-A)/Side Scatter Area (SSC-A) plot; 2) singlets were gated using an FSC-A/Forward Scatter Height (FSC-H) dot plot; 3) additional nonspecific events, including dead or apoptotic cells, were removed, and target nucleated cell clusters were gated using a CD45/SSC-A plot; 4) the immunophenotype of the remaining events was analyzed based on the markers included in each panel; and 5) the proportion (%) of abnormal events relative to the total number of events was calculated. In the BCL panel, populations which were positive for fixable viability dye (FVD) marker were excluded.
MRD panels
For MRD analysis, EuroFlow standard protocol was adapted, which includes bulk RBC lysis prior to staining, allowing for high-sensitivity detection through the analysis of large cell numbers and the detailed characterization of rare cell populations [21], 22]. This standardized approach ensures high reproducibility and comparability across laboratories, facilitating consistent MRD assessment in ALL and MM. RBC lysis was performed using EasySep™ RBC Lysis Buffer (STEMCELL Technologies, Vancouver, Canada). Antibody staining was conducted using BD lyophilized multicolor antibody cocktails (Becton Dickinson), each containing 10 monoclonal antibodies for ALL and MM panels, respectively (Supplementary Table 1). Data acquisition was performed using a FACSLyric™ flow cytometer, acquiring a total of six million events for the B-MRD panel and 10 million events for the MM-MRD panel, including debris and doublets. Data analysis was conducted through Infinicyt software (Cytognos, Salamanca, Spain) based on the EuroFlow guidelines and previously reported leukemia-associated immunophenotype criteria [21], [22], [23], [24]. MRD positivity was determined based on a lower limit of detection (LOD) of 20 MRD events. The MRD percentage was calculated by dividing the number of MRD events by the total number of acquired events after excluding debris and doublets.
DR using t-SNE and UMAP algorithms
For the analysis using DR algorithms, the FCS data files previously used in manual analysis were reanalyzed using FlowJo software v.10.10.0 (Becton Dickinson). The same steps were followed for the removal of nonspecific events as in the manual gating process (1–3 in Multiparameter flow cytometry section above). Subsequently, the total events for all markers were processed through the t-SNE and UMAP plugins within the FlowJo software. Meanwhile, for the B-MRD and MM-MRD panels, a primary-gating strategy was employed. Specifically, CD19 (a pan-B-cell marker) and CD138 (a plasma cell marker) were gated prior to applying the DR algorithms. The DR algorithms were then applied to the CD19-positive population in the B-MRD panel and the CD138-positive population in the MM-MRD panel, respectively. The parameters for DR algorithms were set to the default settings provided by the FlowJo software: t-SNE was executed with 1,000 iterations, a perplexity of 30, a learning rate approximately set to [total events/14.29], a vantage point tree k-nearest neighbors (KNN) algorithm, and the Barnes-Hut gradient algorithm, while UMAP was configured with a Euclidean distance metric, 15 neighbors, a minimum distance of 0.5, and 2 components.
DR-based data analysis strategies
After DR processing, the total events (ALOT, BCL, and MM panels, Figure 2A) or primary-gated events (MRD panels, Figure 2B) were visualized in a two-dimensional dot plot with the X-axis and Y-axis representing the DR coordinates. A heatmap in color axis mode was used to visualize the signal intensity for each marker, with stronger signals represented from blue to red. Target clusters were initially gated based on this heatmap according to the each MFC panel. Subsequently, the association of these clusters with specific diseases was interpreted by reviewing the heatmaps of other markers in the panel. All target clusters were cross-checked against the CD45/SSC-A plot to confirm their position and exclude nonspecific signals, such as debris. A detailed description of DR-based gating for each panel is available in the Supplementary Material (Supplementary Methods and Supplementary Figures 1–5).

Common gating strategy for DR-based gating against (A) total events for the ALOT, BCL, and MM panels, and (B) applying primary-gating strategy for MRD panels.
Sensitivity and precision of DR-based gating
To assess the sensitivity of DR-based gating compared to manual gating, 11 samples with less than 1 % MRD in B-MRD panel were selected. In this evaluation, t-SNE and UMAP algorithms were each applied 20 times after applying a primary-gating strategy to CD19-positive populations. Subsequently, t-SNE and UMAP were applied 20 times to the total events without applying a primary-gating strategy.
To evaluate the precision of DR-based gating, this study utilized the BCL panel. Five samples including highest and lowest level by manual gating were selected, and both the t-SNE and UMAP algorithms were replicated five times for analysis. During each repetition, the process of gating singlets and excluding debris was repeated from the beginning to intentionally introduce slight differences in the total event count, and the DR algorithms were then applied.
Statistical analysis
For each panel, the agreement between manual gating and DR-based gating was evaluated using Cohen’s kappa coefficient (κ) with 95 % confidence interval (CI). Sensitivity, specificity, positive predictive value (PPV), and negative predictive value (NPV) were calculated in comparison with manual gating, with these metrics specifically calculated based on positive and negative results for the BCL, MM, B-MRD, and MM-MRD panels. The correlation between the quantitative values of manual gating and DR-based gating was assessed using Passing-Bablok regression and Spearman correlation coefficients (ρ).
For the BCL panel, each algorithm was repeated five times to evaluate the precision, and the coefficient of variation (%CV) was calculated. For the B-MRD panel, each DR-based gating was repeated 20 times, presenting standard deviation (SD) and a hit rate (%) for each MRD level. All statistical analyses were performed using R software (v.4.4.1).
Results
Comparison of manual and DR-based gating
Diagnostic panels: ALOT, BCL, and MM
Among the 80 samples in the ALOT panel, t-SNE-based gating showed no discrepancies in lineage classification compared to the manual gating (Supplementary Table 2). UMAP-based gating showed one discrepant case where the difference in lineage interpretation (myeloblast vs. unknown lineage) stemmed from the interpretation of weak MPO positivity. Total agreement between manual gating and DR-based gating results was 100 % (kappa=1.000 [95 % CI, 1.000–1.000]) and 98.8 % (kappa=0.980 [95 % CI, 0.941–1.000]) for t-SNE- and UMAP-based gating, respectively (Table 1).
Total agreement, sensitivity, and specificity, PPV, and NPV of DR-based gating compared with manual gating.
| t-SNE-based gating | UMAP-based gating | |||||
|---|---|---|---|---|---|---|
| ALOT | BCL | MM | ALOT | BCL | MM | |
| Agreement, % Kappa value (95 % CI) | 100 1.000 (1.000–1.000) |
95.2 0.927 (0.830–1.000) |
100 1.000 (1.000–1.000) |
98.8 0.980 (0.941–1.000) |
95.2 0.927 (0.830–1.000) |
100 1.000 (1.000–1.000) |
| Sensitivity, % (95 % CI)a | NA | 100 (83.9–100 %) | 100 (90.0–100 %) | NA | 100 (83.9–100 %) | 100 (90.0–100 %) |
| Specificity, % (95 % CI)a | NA | 95.5 (77.2–99.3 %) | 100 (69.2–100 %) | NA | 95.5 (77.2–99.3 %) | 100 (69.2–100 %) |
| PPV, % (95 % CI)a | NA | 95.2 (77.8–99.1 %) | 100 (90.0–100 %) | NA | 95.2 (77.8–99.1 %) | 100 (90.0–100 %) |
| NPV, % (95 % CI)a | NA | 100 (83.9–100 %) | 100 (69.2–100 %) | NA | 100 (83.9–100 %) | 100 (69.2–100 %) |
-
aBased on positive and negative results. DR, dimensionality reduction; t-SNE, t-distributed stochastic neighbor embedding; UMAP, uniform manifold approximation and projection; ALOT, acute leukemia orientation tube; BCL, B-cell lymphoma; MM, multiple myeloma; PPV, positive predictive value; NPV, negative predictive value; CI, confidential interval; NA, not available.
Among the 42 samples in the BCL panel, both t-SNE- and UMAP-based gating showed concordant results with manual gating for all but two cases (Supplementary Table 3). Notably, both DR-based gating identified a CD5ᅳ/CD10ᅳ clonal B-cell population in one case that was not detected by manual gating (0.59 % in t-SNE-based gating and 0.43 % in UMAP-based gating) (Supplementary Figure 6). In the other discrepant case, a difference in immunophenotype interpretation arose due to the interpretations of CD5 positivity. In qualitative analysis, the total agreement between manual gating and DR-based gating results was 95.2 % (kappa=0.927 [95 % CI, 0.830–1.000]) for both t-SNE and UMAP, with sensitivity of 100 % (95 % CI, 83.9–100 %), specificity of 95.5 % (95 % CI, 77.2–99.3 %), PPV of 95.2 % (95 % CI, 77.8–99.1 %), and NPV of 100 % (95 % CI, 83.9–100 %).
For the 45 samples in the MM panel, both t-SNE- and UMAP-based gating results showed complete agreement with manual gating (Supplementary Table 4), with no discrepant cases observed. Across all diagnostic panels, the clusters identified by DR-based gating were spatially consistent with those defined by manual gating in the CD45/SSC-A plot.
MRD panels: B-MRD and MM-MRD
For the 40 samples in the B-MRD panel, both t-SNE- and UMAP-based gating results fully agreed with manual gating in identifying 18 samples with MRD-positive and 22 samples with MRD-negative (Table 2 and Supplementary Table 5).
Total agreement, sensitivity, specificity, PPV, and NPV of DR-based gating compared with manual gating in MRD panels.
| t-SNE-based gating | UMAP-based gating | |||
|---|---|---|---|---|
| B-MRD | MM-MRD | B-MRD | MM-MRD | |
| Agreement, % Kappa value (95 % CI) | 100 1.000 (0.950–1.000) |
96.7 0.934 (0.835–0.982) |
100 1.000 (0.950–1.000) |
96.7 0.934 (0.835–0.982) |
| Sensitivity, % (95 % CI) | 100 (82.4–100 %) | 100 (80.0–100 %) | 100 (82.4–100 %) | 100 (80.0–100 %) |
| Specificity, % (95 % CI) | 100 (85.1–100 %) | 93.8 (69.7–99.0 %) | 100 (85.1–100 %) | 93.8 (69.7–99.0 %) |
| PPV, % (95 % CI) | 100 (82.4–100 %) | 93.3 (81.8–98.9 %) | 100 (82.4–100 %) | 93.3 (81.8–98.9 %) |
| NPV, % (95 % CI) | 100 (85.1–100 %) | 100 (80.0–100 %) | 100 (85.1–100 %) | 100 (80.0–100 %) |
-
DR, dimensionality reduction; t-SNE, t-distributed stochastic neighbor embedding; UMAP, uniform manifold approximation and projection; MRD, measurable residuals disease; MM, multiple myeloma; PPV, positive predictive value; NPV, negative predictive value; CI, confidential interval.
Among the 30 samples in the MM-MRD panel, 14 were identified as MRD-positive and 16 as MRD-negative through manual gating. Significantly, in one sample where manual gating failed to detect MRD, both t-SNE- and UMAP-based gating successfully identified an MRD population at a level of 0.009 % (Supplementary Figure 7). Total agreement between manual gating and DR-based gating results was 96.7 % (kappa=0.934 [95 % CI, 0.835–0.982]) for both t-SNE and UMAP. Compared with manual gating, both t-SNE- and UMAP-based gating showed sensitivity of 100 % (95 % CI, 80.0–100 %), specificity of 93.8 % (95 % CI, 69.7–99.0 %), PPV of 93.3 % (95 % CI, 81.8–98.9 %), and NPV of 100 % (95 % CI, 80.0–100 %).
Quantitative correlation
Compared with the results of manual gating, t-SNE-based gating demonstrated correlation coefficients of 0.990, 0.979, and 0.944 for the ALOT, BCL, and MM panels, respectively (all p<0.001) (Figure 3). UMAP-based gating showed correlation coefficients of 0.988, 0.970, and 0.947 for the ALOT, BCL, and MM panels, respectively (all p<0.001).
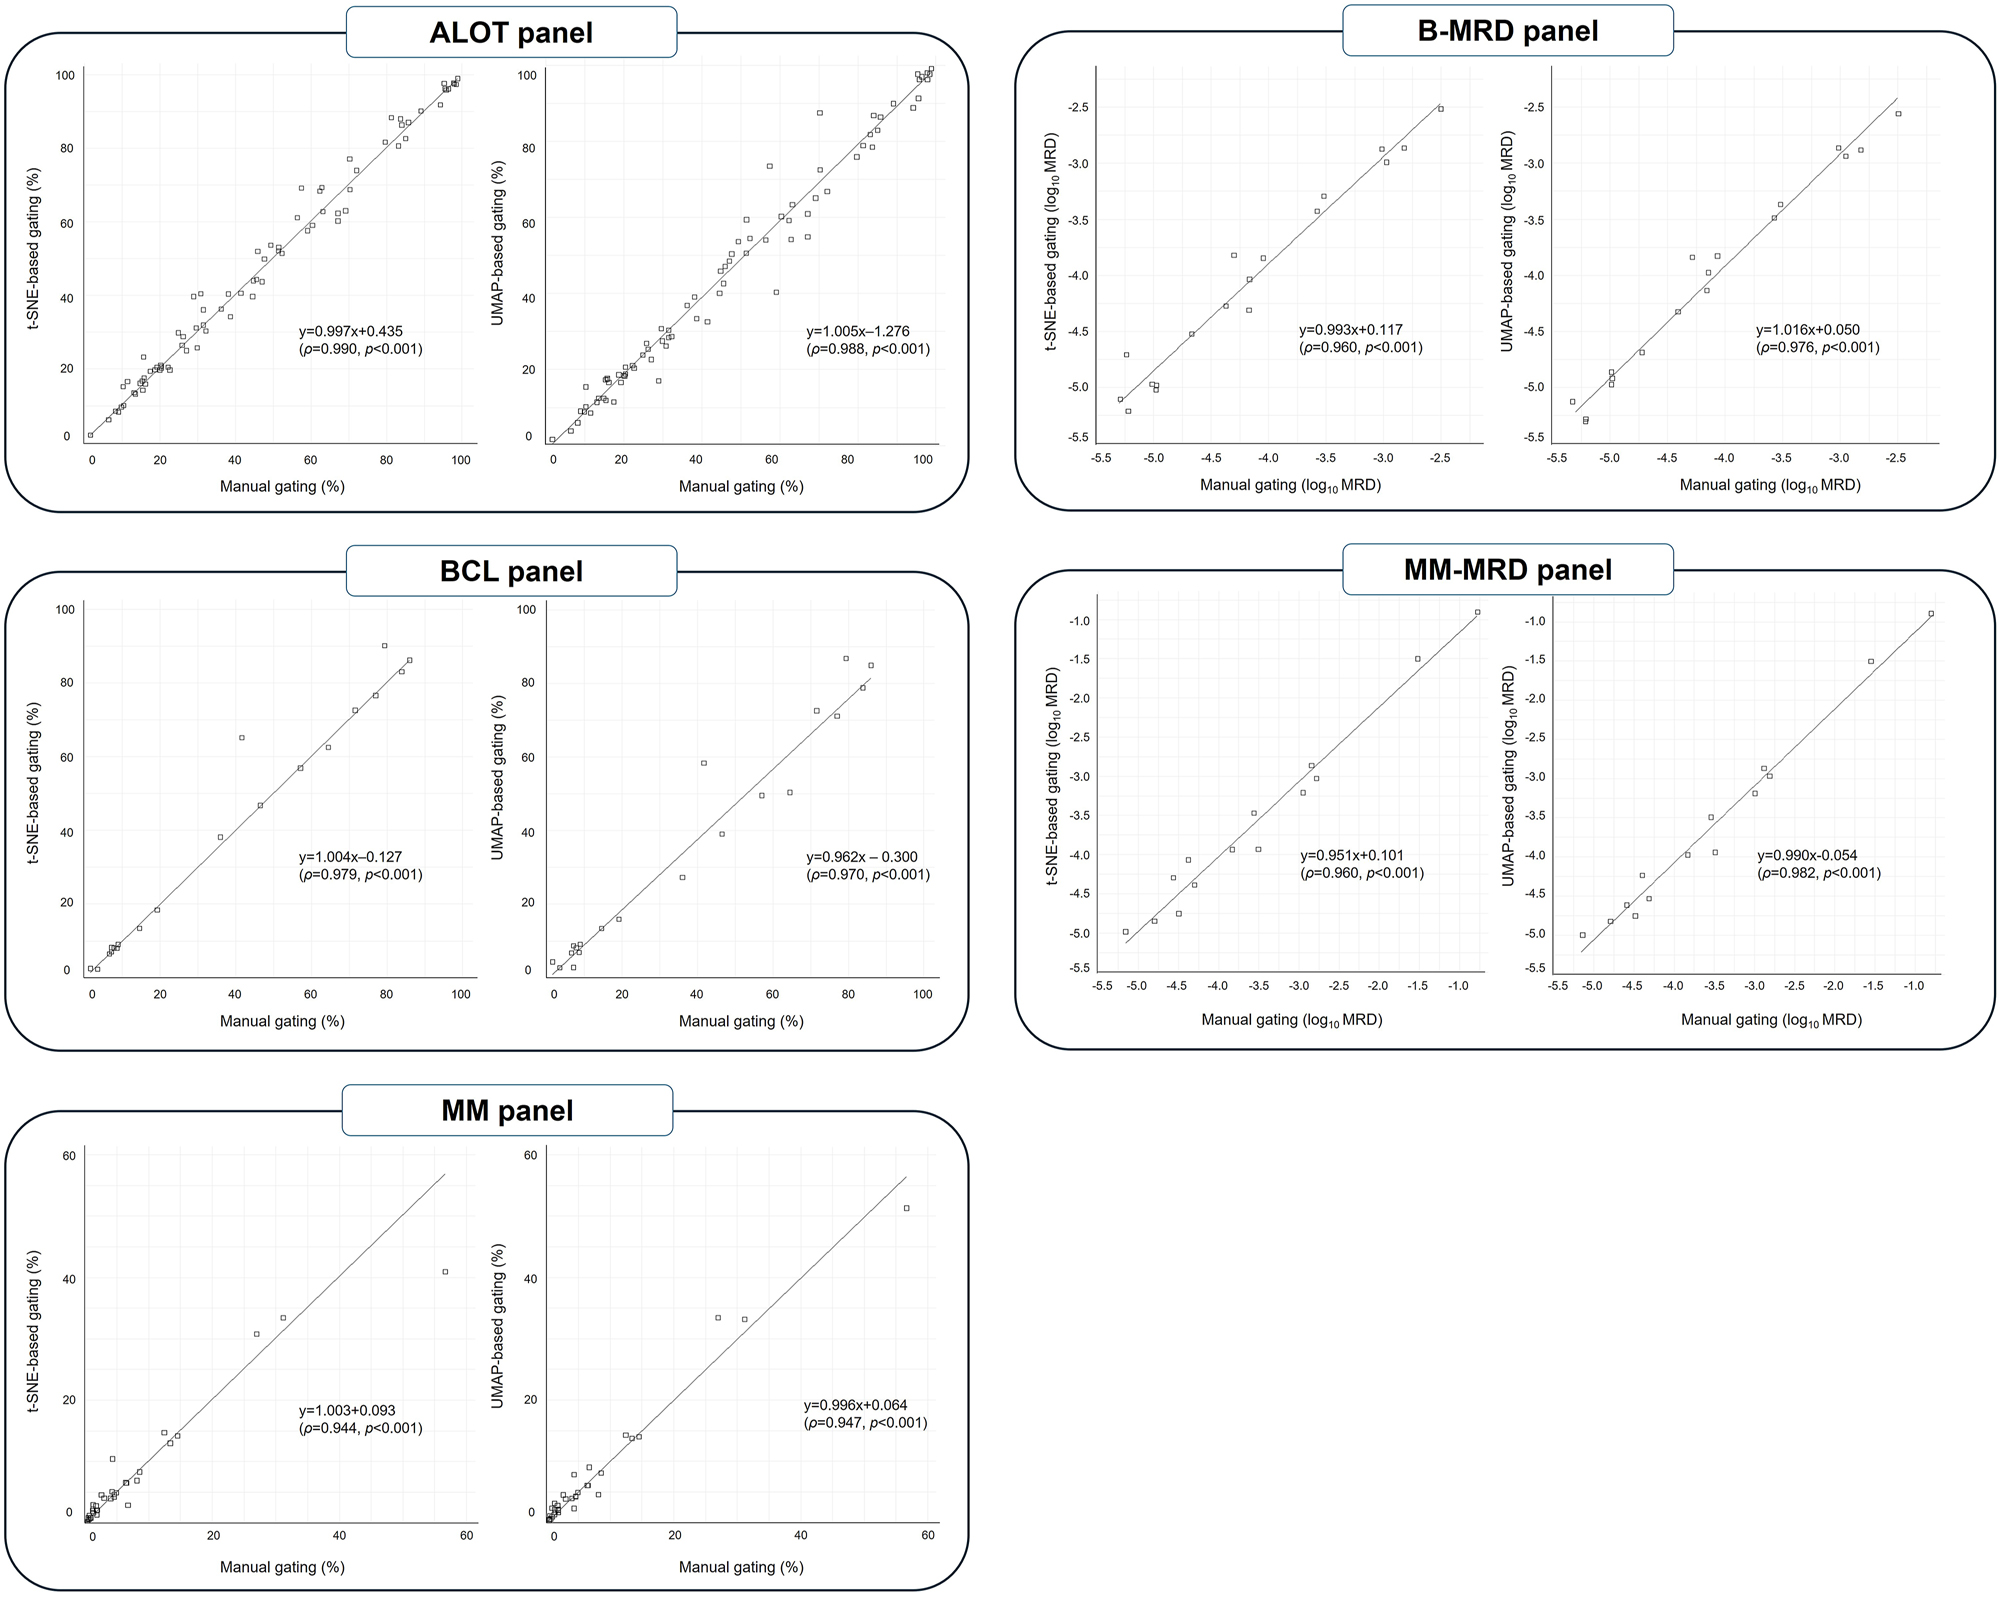
Quantitative correlation of target populations measured by manual gating and DR-based gating.
For the B-MRD and MM-MRD panels, after conversion to a logarithmic scale, t-SNE-based gating achieved a correlation coefficients of 0.960 for both panels (all p<0.001), while UMAP-based gating achieved correlation coefficients of 0.976 and 0.982 for the B-MRD (range, 10−5.30–10−2.50) and MM-MRD (range, 10−5.15–10−0.78) panels, respectively (all p<0.001).
Sensitivity and precision of DR-based gating
In sensitivity evaluation using B-MRD panel, when the primary-gating strategy was applied, both t-SNE- and UMAP-based gating successfully identified MRD populations down to the lowest MRD level of 10−5.30 (Table 3). Using total events without primary-gating strategy, both t-SNE- and UMAP-based gating identified MRD of 10−2.50, 10−2.84, and 10−2.98 MRD levels. At lower MRD levels, t-SNE-based gating successfully identified MRD in all samples with MRD levels ranging from 10−4.05 to 10−5.00, while UMAP-based gating identified MRD only in a single sample with an MRD level of 10−4.70. In the three samples with MRD levels below 10−5.00, neither t-SNE nor UMAP identified MRD. An example of the t-SNE and UMAP plot for total events is shown in Supplementary Figure 8.
Sensitivity of the DR-based gating for B-MRD panel, applying primary-gating strategy and using total events.
| Sample no. | MRD level of manual gating (log10 MRD) | DR-based gating applying primary-gating strategy | DR-based gating using total events | ||||
|---|---|---|---|---|---|---|---|
| Mean MRD level (log10 MRD) | SD | Hit rate, % (Positive N/Replicates N) | Mean MRD level (log10 MRD) | SD | Hit rate, % (Positive N/Replicates N) | ||
| t-SNE-based gating | |||||||
| 1 | −2.50 | −2.51 | 0.013 | 100 % (20/20) | −2.45 | 0.009 | 100 % (20/20) |
| 2 | −2.84 | −2.84 | 0.008 | 100 % (20/20) | −2.83 | 0.005 | 100 % (20/20) |
| 3 | −2.98 | −2.95 | 0.020 | 100 % (20/20) | −2.96 | 0.033 | 100 % (20/20) |
| 4 | −4.05 | −3.85 | 0.010 | 100 % (20/20) | −3.87 | 0.013 | 100 % (20/20) |
| 5 | −4.40 | −4.29 | 0.006 | 100 % (20/20) | −4.30 | 0.001 | 100 % (20/20) |
| 6 | −4.70 | −4.70 | 0.007 | 100 % (20/20) | −4.68 | 0.018 | 100 % (20/20) |
| 7 | −5.00 | −5.01 | 0.002 | 100 % (20/20) | −5.00 | 0.010 | 100 % (20/20) |
| 8 | −5.00 | −4.91 | 0.012 | 100 % (20/20) | −4.94 | 0.039 | 100 % (20/20) |
| 9 | −5.22 | −5.53 | 0.152 | 100 % (20/20) | NA | NA | 0 % (0/20) |
| 10 | −5.22 | −5.21 | 0.029 | 100 % (20/20) | NA | NA | 0 % (0/20) |
| 11 | −5.30 | −5.10 | 0.038 | 100 % (20/20) | NA | NA | 0 % (0/20) |
| UMAP-based gating | |||||||
| 1 | −2.50 | −2.51 | 0.014 | 100 % (20/20) | −2.45 | 0.013 | 100 % (20/20) |
| 2 | −2.84 | −2.84 | 0.006 | 100 % (20/20) | −2.84 | 0.010 | 100 % (20/20) |
| 3 | −2.98 | −2.94 | 0.022 | 100 % (20/20) | −2.96 | 0.052 | 100 % (20/20) |
| 4 | −4.05 | −3.85 | 0.010 | 100 % (20/20) | NA | NA | 0 % (0/20) |
| 5 | −4.40 | −4.30 | 0.010 | 100 % (20/20) | NA | NA | 0 % (0/20) |
| 6 | −4.70 | −4.71 | 0.022 | 100 % (20/20) | −4.68 | 0.009 | 100 % (20/20) |
| 7 | −5.00 | −5.00 | 0.022 | 100 % (20/20) | NA | NA | 0 % (0/20) |
| 8 | −5.00 | −4.91 | 0.013 | 100 % (20/20) | NA | NA | 0 % (0/20) |
| 9 | −5.22 | −5.58 | 0.106 | 100 % (20/20) | NA | NA | 0 % (0/20) |
| 10 | −5.22 | −5.32 | 0.085 | 100 % (20/20) | NA | NA | 0 % (0/20) |
| 11 | −5.30 | −5.11 | 0.040 | 100 % (20/20) | NA | NA | 0 % (0/20) |
-
DR, dimensionality reduction; MRD, measurable residual disease; t-SNE, t-distributed stochastic neighbor embedding; UMAP, uniform manifold approximation and projection; SD, standard deviation.
In the BCL panel, precision was evaluated by replicating the analysis five times for five levels, including the lowest (2.7 %) and highest (84.2 %) results obtained through manual gating. Across all levels, the coefficient of variation (CV) remained below 10 % (Table 4).
Precision of DR-based gating using BCL panel.
| Sample ID | Result of manual gating, % | t-SNE-based gating | UMAP-based gating | ||
|---|---|---|---|---|---|
| Mean, % | % CV | Mean, % | % CV | ||
| BCL-13 | 84.2 | 83.2 | 0.4 | 84.3 | 0.1 |
| BCL-06 | 41.7 | 55.4 | 3.0 | 57.5 | 1.8 |
| BCL-15 | 13.2 | 13.4 | 6.0 | 13.3 | 5.6 |
| BCL-37 | 8.0 | 8.5 | 4.9 | 8.2 | 4.7 |
| BCL-41 | 2.7 | 4.3 | 7.3 | 4.6 | 5.7 |
-
DR, dimensionality reduction; BCL, B-cell lymphoma; t-SNE, t-distributed stochastic neighbor embedding; UMAP, uniform manifold approximation and projection; CV, coefficient of variation.
Discussion
In this study, we investigated the diagnostic applicability of DR algorithms in the flow cytometry for patients with hematologic malignancies. Our findings demonstrate that both t-SNE and UMAP are highly effective in reproducing manual gating results across the ALOT, BCL, MM, B-MRD, and MM-MRD panels, with overall agreement consistently exceeding 95 % and sensitivity reaching 100 %. Furthermore, quantitative correlations were excellent across all panels (ρ>0.94).
For the ALOT panel, discrepant cases between DR-based gating and manual gating were attributed to the interpretation of weak MPO positivity led to a difference between UMAP-based gating and manual gating in lineage classification. Determining positivity in flow cytometry can be often challenging when signal intensity is weak [25]. In the case of MPO, positivity is frequently determined when as little as 10 % of the cells show positivity based on isotype or internal control cut-offs [26]. In this study, marker positivity was not rigorously quantified based on signal intensity but rather assessed using a heatmap-based approach, which may have contributed to discrepancies in the interpretation of weak signal intensity. One discrepant case in BCL panel also showed CD5 weak-positive in manual gating. Future studies should aim to establish more objective criteria for positivity by calculating the median fluorescence intensity ratio of the target cluster relative to the internal control cluster (e.g. lymphocytes) [27], allowing for a more standardized and quantitative assessment of positivity.
Importantly, in the analysis of BCL and MM-MRD panels, both t-SNE and UMAP-based gating successfully detected two critical cases that manual gating failed to identify, revealing a clonal B-cell population in one case from the BCL panel and a clonal plasma cell population in another case from MM-MRD panel. The former case was later confirmed to have morphological evidence of diffuse large BCL BM involvement, while the latter case showed an increased serum free kappa light chain level, approximately twice the upper limit of the reference interval, with lambda light chain levels remaining within the reference range and no monoclonality observed in serum or urine protein electrophoresis. Cheung et al. previously suggested the potential of diverse automated algorithms (e.g. t-SNE, SPADE1, and FlowSOM), to uncover cell populations that may be missed by conventional sequential manual gating strategies [28]. Our study provides supporting evidence for this possibility, demonstrating that DR algorithms can reveal diagnostically relevant populations that are undetected through conventional manual gating.
In the MRD panels, we applied a primary-gating strategy to reduce DR processing time. While the sensitivity evaluation using total events from the B-MRD panel, neither t-SNE nor UMAP could detect MRD levels below 10−5.00, the implementation of CD19-based primary gating strategy enabled successfully MRD detection at levels as low as 10−5.30.
Regarding DR processing time, t-SNE required 1ᅳ3 minutes per sample for ALOT, BCL, and MM panels, each containing approximately 200,000 total acquisition events. In contrast, for the B-MRD panel, which included up to six million total acquisition events, the processing time extended to 1ᅳ1.5 h per sample. While UMAP showed shorter processing time compared to the t-SNE, as previously reported [29], we did not thoroughly evaluate these differences in our study. Although processing times increase with the number of analyzed events for both algorithms [20], UMAP may be more suitable than t-SNE for MRD analysis from a computational time perspective, particularly for very large datasets containing millions of cell events. Processing time can also vary depending on the performance of the analysis computer, as well as algorithm parameters such as iteration time and perplexity. Utilizing primary-gating strategies significantly reduced the processing time and enhanced sensitivity, which was accomplished through both the reduction of events in primary-gated populations and more refined cluster discrimination.
The advantage of DR-based gating is its ability to streamline the data interpretation process by reducing the number of two-dimensional plots that need to be reviewed [28]. In DR-based gating, only single t-SNE or UMAP plot needed to be checked after primary gating on the CD19-positive population. Any nonspecific signals or non-MRD cells overlapping with the target population could be verified using the CD45/SSC-A and CD19/SSC-A plots. For other panels without primary gating, the target clusters could be identified in the DR plot after debris exclusion, followed by verification of their expected locations in the CD45/SSC-A plot.
DR-based gating can be applied in various ways. In this study, while the DR algorithm was applied exclusively to immunophenotypic markers, incorporating physical parameters like FSC and SSC could enhance cluster accuracy by improving cell classification [30]. Additionally, although we manually classified CD19-positive or CD138-positive populations during primary gating in MRD panels, this step could be further automated using algorithms in the future, implementing a multi-step automated gating strategy for increased efficiency and consistency. Furthermore, combining multiple clustering algorithms may be more effective for detecting very small MRD populations or unexpected cell clusters. For example, Botta et al. reported a FlowCT semi-automated workspace that integrates flowAI (for removing low-quality events), PARC and FlowSOM (for automated clustering), PCA, t-SNE, and UMAP (for DR), and other machine learning algorithms [29]. Importantly, a prerequisite for such automated gating is not solely dependent on DR algorithms but primarily on achieving high-quality data output and well-defined cell clustering with appropriate reagents [28].
Our study has a few limitations. First, we utilized the default settings provided by the FlowJo software for DR algorithms. The analytic performance of DR-based gating can vary significantly depending on the specific parameters used. Shadi et al. suggested that increasing parameters like iteration number and perplexity can lead to greater separation between distinct cellular lineages with discrete marker distribution [12]. However, excessive adjustment of these parameters may result in less distinct clustering, potentially obscuring the data interpretation. Ultimately, there is a need for efforts to customize the parameter settings to fit the specific panel and laboratory conditions. Second, the demarcation of clusters in DR plots is not always well-defined, leading to a certain degree of subjectivity in cluster identification, especially in myeloblasts. Due to the heterogeneous and complex nature of myeloblasts [31], clearly gating the target population was often challenging both in manual gating and DR-based gating. This issue was particularly evident with t-SNE, which effectively separates distinct clusters but has limitations in resolving populations with continuous marker expression, potentially leading to qualitative or quantitative differences in gating results [32]. When clusters did not show clear boundaries, we determined the division points where the clusters began to narrow. Lastly, sensitivity and precision were assessed for only a subset of panels (BCL, B-MRD). To ensure the reliability and applicability of these algorithms in routine diagnostic practice, it is essential to validate these parameters across all MFC panels used in clinical workflows.
In conclusion, DR-based gating demonstrates significant potential as a valuable tool in flow cytometric analysis of hematologic malignancies, showing high concordance with manual gating and applicability to MRD analysis. DR-based gating is expected to facilitate streamlined data interpretation by clustering events with similar immunophenotypic characteristics while reducing the complexity of traditional interpretations and minimizing overlooked populations. Furthermore, integration with other automated tools could further enhance these capabilities, improving both efficiency and rare event detection while expanding its utility in both research and clinical settings.
Funding source: National Research Foundation of Korea
Award Identifier / Grant number: 2022R1F1A1073963
-
Research ethics: The study was performed in accordance with the Declaration of Helsinki. The study was approved by the Institutional Review Board of Samsung Medical Center, Seoul, Korea (Approval No. 2024-05-003). Due to the retrospective nature of the study, the Institutional Review Board waived the requirement for informed consent.
-
Informed consent: Not applicable.
-
Author contributions: M-S.P. conceptualized the study and drafted the manuscript; JK.L. and B.K. provided expertise regarding the laboratory data; HY.J., KH.Y. SJ.K., K.K., and CW.J. provided clinical data; H-J.K. supervised the study; H-Y.K. responsible for the study project, analyzed the data, and edited the manuscript. All authors reviewed and approved the final manuscript.
-
Use of Large Language Models, AI and Machine Learning Tools: None declared.
-
Conflict of interest: The authors state no conflict of interest.
-
Research funding: This study was supported by the National Research Foundation of Korea (NRF) grant funded by the Korea government (MSIT) (2022R1F1A1073963).
-
Data availability: The data generated in the current study are available from the corresponding author upon reasonable request.
References
1. Wood, BL, Arroz, M, Barnett, D, DiGiuseppe, J, Greig, B, Kussick, SJ, et al.. 2006 Bethesda International Consensus recommendations on the immunophenotypic analysis of hematolymphoid neoplasia by flow cytometry: optimal reagents and reporting for the flow cytometric diagnosis of hematopoietic neoplasia. Cytometry B Clin Cytom 2007;72:S14–22.10.1002/cyto.b.20363Search in Google Scholar PubMed
2. Craig, FE, Foon, KA. Flow cytometric immunophenotyping for hematologic neoplasms. Blood 2008;111:3941–67. https://doi.org/10.1182/blood-2007-11-120535.Search in Google Scholar PubMed
3. Weeda, V, Mestrum, SGC, Leers, MPG. Flow cytometric identification of hematopoietic and leukemic blast cells for tailored clinical follow-up of acute myeloid leukemia. Int J Mol Sci 2022;23. https://doi.org/10.3390/ijms231810529.Search in Google Scholar PubMed PubMed Central
4. Döhner, H, Wei, AH, Appelbaum, FR, Craddock, C, DiNardo, CD, Dombret, H, et al.. Diagnosis and management of AML in adults: 2022 recommendations from an international expert panel on behalf of the ELN. Blood 2022;140:1345–77. https://doi.org/10.1182/blood.2022016867.Search in Google Scholar PubMed
5. Cordone, I, Amodeo, R, Bellesi, S, Bottan, F, Buccisano, F, De Propris, MS, et al.. Consensus for flow cytometry clinical report on multiple myeloma: a multicenter harmonization process merging laboratory experience and clinical needs. Cancers 2023;15:2060. https://doi.org/10.3390/cancers15072060.Search in Google Scholar PubMed PubMed Central
6. Tembhare, PR, Subramanian, PG, Ghogale, S, Chatterjee, G, Patkar, NV, Gupta, A, et al.. A high-sensitivity 10-color flow cytometric minimal residual disease assay in B-Lymphoblastic leukemia/lymphoma can easily achieve the sensitivity of 2-in-10(6) and is superior to standard minimal residual disease assay: a study of 622 patients. Cytometry B Clin Cytom 2020;98:57–67. https://doi.org/10.1002/cyto.b.21831.Search in Google Scholar PubMed
7. Wang, SA, Jorgensen, JL, Hu, S, Jia, F, Li, S, Loghavi, S, et al.. Validation of a 12-color flow cytometry assay for acute myeloid leukemia minimal/measurable residual disease detection. Cytometry B Clin Cytom 2023;104:356–66. https://doi.org/10.1002/cyto.b.22140.Search in Google Scholar PubMed
8. Greig, B, Oldaker, T, Warzynski, M, Wood, B. 2006 Bethesda International Consensus recommendations on the immunophenotypic analysis of hematolymphoid neoplasia by flow cytometry: recommendations for training and education to perform clinical flow cytometry. Cytometry B Clin Cytom 2007;72:S23–33.10.1002/cyto.b.20364Search in Google Scholar PubMed
9. Chen, M, Fu, M, Gong, M, Gao, Y, Wang, A, Zhao, W, et al.. Twenty-four-color full spectrum flow cytometry panel for minimal residual disease detection in acute myeloid leukemia. Open Med 2023;18:20230745. https://doi.org/10.1515/med-2023-0745.Search in Google Scholar PubMed PubMed Central
10. Malepathirana, T, Senanayake, D, Vidanaarachchi, R, Gautam, V, Halgamuge, S. Dimensionality reduction for visualizing high-dimensional biological data. Biosystems 2022;220:104749. https://doi.org/10.1016/j.biosystems.2022.104749.Search in Google Scholar PubMed
11. Thrun, MC, Ultsch, A. Uncovering high-dimensional structures of projections from dimensionality reduction methods. MethodsX 2020;7:101093. https://doi.org/10.1016/j.mex.2020.101093.Search in Google Scholar PubMed PubMed Central
12. Toghi Eshghi, S, Au-Yeung, A, Takahashi, C, Bolen, CR, Nyachienga, MN, Lear, SP, et al.. Quantitative comparison of conventional and t-SNE-guided gating analyses. Front Immunol 2019;10:1194. https://doi.org/10.3389/fimmu.2019.01194.Search in Google Scholar PubMed PubMed Central
13. Zhong, P, Hong, M, He, H, Zhang, J, Chen, Y, Wang, Z, et al.. Diagnosis of acute leukemia by multiparameter flow cytometry with the assistance of artificial intelligence. Diagnostics 2022;12:827. https://doi.org/10.3390/diagnostics12040827.Search in Google Scholar PubMed PubMed Central
14. Stolarek, I, Samelak-Czajka, A, Figlerowicz, M, Jackowiak, P. Dimensionality reduction by UMAP for visualizing and aiding in classification of imaging flow cytometry data. iScience 2022;25:105142. https://doi.org/10.1016/j.isci.2022.105142.Search in Google Scholar PubMed PubMed Central
15. Shopsowitz, KE, Liu, L, Setiadi, A, Al-Bakri, M, Vercauteren, S. Machine learning optimized multiparameter radar plots for B-cell acute lymphoblastic leukemia minimal residual disease analysis. Cytometry B Clin Cytom 2022;102:342–52. https://doi.org/10.1002/cyto.b.22084.Search in Google Scholar PubMed
16. Van der Maaten, L, Hinton, G. Visualizing data using t-SNE. J Mach Learn Res 2008;9:2579–605.Search in Google Scholar
17. McInnes, L, Healy, J, Melville, J. Umap: uniform manifold approximation and projection for dimension reduction. arXiv 2018:1802.03426.10.21105/joss.00861Search in Google Scholar
18. Hozumi, Y, Wei, GW. Analyzing scRNA-seq data by CCP-assisted UMAP and tSNE. PLoS One 2024;19:e0311791. https://doi.org/10.1371/journal.pone.0311791.Search in Google Scholar PubMed PubMed Central
19. Ujas, TA, Obregon-Perko, V, Stowe, AM. A guide on analyzing flow cytometry data using clustering methods and nonlinear dimensionality reduction (tSNE or UMAP). Methods Mol Biol 2023;2616:231–49. https://doi.org/10.1007/978-1-0716-2926-0_18.Search in Google Scholar PubMed
20. Ferrer-Font, L, Mayer, JU, Old, S, Hermans, IF, Irish, J, Price, KM. High-dimensional data analysis algorithms yield comparable results for mass cytometry and spectral flow cytometry data. Cytometry A 2020;97:824–31. https://doi.org/10.1002/cyto.a.24016.Search in Google Scholar PubMed PubMed Central
21. Theunissen, P, Mejstrikova, E, Sedek, L, van der Sluijs-Gelling, AJ, Gaipa, G, Bartels, M, et al.. Standardized flow cytometry for highly sensitive MRD measurements in B-cell acute lymphoblastic leukemia. Blood 2017;129:347–57. https://doi.org/10.1182/blood-2016-07-726307.Search in Google Scholar PubMed PubMed Central
22. Flores-Montero, J, Sanoja-Flores, L, Paiva, B, Puig, N, Garcia-Sanchez, O, Bottcher, S, et al.. Next generation flow for highly sensitive and standardized detection of minimal residual disease in multiple myeloma. Leukemia 2017;31:2094–103. https://doi.org/10.1038/leu.2017.29.Search in Google Scholar PubMed PubMed Central
23. Verbeek, MWC, van der Velden, VHJ. The evolving landscape of flowcytometric minimal residual disease monitoring in B-cell precursor acute lymphoblastic leukemia. Int J Mol Sci 2024;25:4881. https://doi.org/10.3390/ijms25094881.Search in Google Scholar PubMed PubMed Central
24. Tsitsikov, E, Harris, MH, Silverman, LB, Sallan, SE, Weinberg, OK. Role of CD81 and CD58 in minimal residual disease detection in pediatric B lymphoblastic leukemia. Int J Lab Hematol 2018;40:343–51. https://doi.org/10.1111/ijlh.12795.Search in Google Scholar PubMed
25. Adan, A, Alizada, G, Kiraz, Y, Baran, Y, Nalbant, A. Flow cytometry: basic principles and applications. Crit Rev Biotechnol 2017;37:163–76. https://doi.org/10.3109/07388551.2015.1128876.Search in Google Scholar PubMed
26. Park, M, Lim, J, Ahn, A, Oh, EJ, Song, J, Kim, KH, et al.. Current status of flow cytometric immunophenotyping of hematolymphoid neoplasms in Korea. Ann Lab Med 2024;44:222–34. https://doi.org/10.3343/alm.2023.0298.Search in Google Scholar PubMed PubMed Central
27. Ratei, R, Karawajew, L, Lacombe, F, Jagoda, K, Del Poeta, G, Kraan, J, et al.. Normal lymphocytes from leukemic samples as an internal quality control for fluorescence intensity in immunophenotyping of acute leukemias. Cytometry B Clin Cytom 2006;70:1–9. https://doi.org/10.1002/cyto.b.20075.Search in Google Scholar PubMed
28. Cheung, M, Campbell, JJ, Whitby, L, Thomas, RJ, Braybrook, J, Petzing, J. Current trends in flow cytometry automated data analysis software. Cytometry A 2021;99:1007–21. https://doi.org/10.1002/cyto.a.24320.Search in Google Scholar PubMed
29. Botta, C, Maia, C, Garces, JJ, Termini, R, Perez, C, Manrique, I, et al.. FlowCT for the analysis of large immunophenotypic data sets and biomarker discovery in cancer immunology. Blood Adv 2022;6:690–703. https://doi.org/10.1182/bloodadvances.2021005198.Search in Google Scholar PubMed PubMed Central
30. Lacombe, F, Durrieu, F, Briais, A, Dumain, P, Belloc, F, Bascans, E, et al.. Flow cytometry CD45 gating for immunophenotyping of acute myeloid leukemia. Leukemia 1997;11:1878–86. https://doi.org/10.1038/sj.leu.2400847.Search in Google Scholar PubMed
31. Bras, AE, Matarraz, S, Nierkens, S, Fernandez, P, Philippe, J, Aanei, CM, et al.. Quality assessment of a large multi-center flow cytometric dataset of acute myeloid leukemia patients-A EuroFlow study. Cancers 2022;14:2011. https://doi.org/10.3390/cancers14082011.Search in Google Scholar PubMed PubMed Central
32. Kobak, D, Berens, P. The art of using t-SNE for single-cell transcriptomics. Nat Commun 2019;10:5416. https://doi.org/10.1038/s41467-019-13056-x.Search in Google Scholar PubMed PubMed Central
Supplementary Material
This article contains supplementary material (https://doi.org/10.1515/cclm-2025-0017).
© 2025 the author(s), published by De Gruyter, Berlin/Boston
This work is licensed under the Creative Commons Attribution 4.0 International License.
Articles in the same Issue
- Frontmatter
- Editorials
- The journey to pre-analytical quality
- Manual tilt tube method for prothrombin time: a commentary on contemporary relevance
- Reviews
- From errors to excellence: the pre-analytical journey to improved quality in diagnostics. A scoping review
- Advancements and challenges in high-sensitivity cardiac troponin assays: diagnostic, pathophysiological, and clinical perspectives
- Opinion Paper
- Is it feasible for European laboratories to use SI units in reporting results?
- Perspectives
- What does cancer screening have to do with tomato growing?
- Computer simulation approaches to evaluate the interaction between analytical performance characteristics and clinical (mis)classification: a complementary tool for setting indirect outcome-based analytical performance specifications
- Genetics and Molecular Diagnostics
- Artificial base mismatches-mediated PCR (ABM-PCR) for detecting clinically relevant single-base mutations
- Candidate Reference Measurement Procedures and Materials
- Antiphospholipid IgG Certified Reference Material ERM®-DA477/IFCC: a tool for aPL harmonization?
- General Clinical Chemistry and Laboratory Medicine
- External quality assessment of the manual tilt tube technique for prothrombin time testing: a report from the IFCC-SSC/ISTH Working Group on the Standardization of PT/INR
- Simple steps to achieve harmonisation and standardisation of dried blood spot phenylalanine measurements and facilitate consistent management of patients with phenylketonuria
- Inclusion of pyridoxine dependent epilepsy in expanded newborn screening programs by tandem mass spectrometry: set up of first and second tier tests
- Analytical performance evaluation and optimization of serum 25(OH)D LC-MS/MS measurement
- Towards routine high-throughput analysis of fecal bile acids: validation of an enzymatic cycling method for the quantification of total bile acids in human stool samples on fully automated clinical chemistry analyzers
- Analytical and clinical evaluations of Snibe Maglumi® S100B assay
- Prevalence and detection of citrate contamination in clinical laboratory
- Reference Values and Biological Variations
- Temporal dynamics in laboratory medicine: cosinor analysis and real-world data (RWD) approaches to population chronobiology
- Establishing sex- and age-related reference intervals of serum glial fibrillary acid protein measured by the fully automated lumipulse system
- Hematology and Coagulation
- Performance of the automated digital cell image analyzer UIMD PBIA in white blood cell classification: a comparative study with sysmex DI-60
- Cancer Diagnostics
- Flow-cytometric MRD detection in pediatric T-ALL: a multicenter AIEOP-BFM consensus-based guided standardized approach
- Impact of biological and genetic features of leukemic cells on the occurrence of “shark fins” in the WPC channel scattergrams of the Sysmex XN hematology analyzers in patients with chronic lymphocytic leukemia
- Assessing the clinical applicability of dimensionality reduction algorithms in flow cytometry for hematologic malignancies
- Cardiovascular Diseases
- Evaluation of sex-specific 0-h high-sensitivity cardiac troponin T thresholds for the risk stratification of non-ST-segment elevation myocardial infarction
- Retraction
- The first case of Teclistamab interference with serum electrophoresis and immunofixation
- Letters to the Editor
- Is this quantitative test fit-for-purpose?
- Reply to “Is this quantitative test fit-for-purpose?”
- Short-term biological variation of coagulation and fibrinolytic measurands
- The first case of Teclistamab interference with serum electrophoresis and immunofixation
- Imlifidase: a new interferent on serum protein electrophoresis looking as a rare plasma cell dyscrasia
- Research on the development of image-based Deep Learning (DL) model for serum quality recognition
- Interference of hypertriglyceridemia on total cholesterol assay with the new CHOL2 Abbott method on Architect analyser
- Congress Abstracts
- 10th Annual Meeting of the Austrian Society for Laboratory Medicine and Clinical Chemistry (ÖGLMKC)