Novel protocol for metabolomics data normalization and biomarker discovery in human tears
-
Joan Serrano-Marín
 ,
Silvia Marin
,
Silvia Marin
 ,
Claudia Garrigós
,
Claudia Garrigós

Abstract
Objectives
Human tear analysis holds promise for biomarker discovery, but its clinical utility is hindered by the lack of standardized reference values, limiting interindividual comparisons. This study aimed at developing a protocol for normalizing metabolomic data from human tears, enhancing its potential for biomarker identification.
Methods
Tear metabolomic profiling was conducted on 103 donors (64 females, 39 males, aged 18–82 years) without ocular pathology, using the AbsoluteIDQ™ p180 Kit for targeted metabolomics. A predictive normalization model incorporating age, sex, and fasting time was developed to correct for interindividual variability. Key metabolites from six compound families (amino acids, biogenic amines, acylcarnitines, lysophosphatidylcholines, phosphatidylcholines, and sphingomyelins) were identified as normalization references. The approach was validated using Linear Discriminant Analysis (LDA) to test its ability to classify donor sex based on metabolite concentrations.
Results
Metabolite concentrations exhibited significant interindividual variability. The normalization model, which predicted metabolite concentrations based on a reference “concomitant” metabolite from each compound family, successfully reduced this variability. Using the ratio of observed-to-predicted concentrations, the model enabled robust comparisons across individuals. LDA classification of donor sex using acylcarnitine C4 achieved 78 % accuracy, correctly identifying 92 % of female donors. This approach outperformed traditional statistical and machine learning methods (Lasso logistic regression and Random Forest classification) in sex discrimination based on tear metabolomics.
Conclusions
This novel normalization protocol significantly improves the reliability of tear metabolomics by enabling standardized interindividual comparisons. The approach facilitates biomarker discovery by mitigating variability in metabolite concentrations and may be extended to other biological fluids, enhancing its applicability in precision medicine.
Introduction
Tears are a promising source of biomarkers, offering a non-invasive window into both ocular and systemic health [1]. Despite significant advancements in this field, the translation of tear-based molecular biomarkers into clinical practice remains elusive, underscoring the challenges in bridging research discoveries to actionable healthcare solutions [2].
Metabolomics, a rapidly evolving field, has revolutionized our ability to understand physiological and pathological processes by comprehensively characterizing the molecular composition of biological samples under diverse conditions [3]. Recent developments in metabolomic technologies hold great promise for identifying multi-molecular biomarker panels with superior discriminative power compared to traditional single-molecule approaches, potentially transforming disease diagnosis and prognosis [4], 5].
Ocular fluids, including tears, aqueous humor, and vitreous humor, are particularly valuable for studying eye-related diseases such as glaucoma and retinitis. Due to the anatomical and functional proximity of the retina to the central nervous system (CNS), these fluids also provide critical insights into CNS-related cellular and molecular mechanisms. Moreover, they have demonstrated utility in elucidating the biological alterations associated with systemic conditions, including diabetes [6] and metabolic disorders [7]. Despite this potential, further research is needed to fully unlock their diagnostic and prognostic capabilities in clinical settings.
Among ocular fluids, tears stand out as a uniquely accessible and non-invasive sample source. In contrast to aqueous and vitreous humor, which require invasive surgical procedures for collection [8], tears can be obtained easily, making them a practical option for routine clinical use. Produced by the lacrimal gland in the lacrimal fossa of the frontal bone, tears play essential roles in ocular surface lubrication, cleansing, and protection against pathogens [9], Their complex composition, which includes lipids, biogenic amines, amino acids, and other low-molecular-weight molecules [10], reflects both local and systemic physiological states, positioning tears as a rich source of metabolomic information.
The aim of this study was to characterize the human tear metabolome using a targeted approach, addressing the challenges posed by the inherent variability of this biofluid, which has historically hindered its utility in biomarker discovery and disease diagnosis. We employed a comprehensive range of data analysis methods to develop a novel normalization model based on the concentrations of five key metabolites. This model enables the establishment of reference values for clinical chemistry parameters, facilitating robust inter-individual comparisons and sample categorization. Notably, our approach demonstrated the ability to predict the sex of tear donors, highlighting its potential to enhance diagnostic precision and improve prognostic predictions. Furthermore, the versatility of this protocol allows for its adaptation to other biological samples, such as plasma or cerebrospinal fluid, expanding its applicability in the broader context of precision medicine.
Materials and methods
Participants
Participants were informed and signed consent was obtained. In terms of ethical standards, this study adhered to the tenets of the declaration of Helsinki and the national and international regulations. The study has been evaluated and approved by the Comitè d’Ètica de la Investigació de les Illes Balears; protocol: CEI: IB 5332/23 PI.
A total of 103 tear samples were collected from donors who met the inclusion criteria and had none of the exclusion criteria outlined in the study protocol approved by the Ethical Committee. All donors were free from diagnosed ocular diseases. Among the participants, six individuals had hypertension, three had hypothyroidism, one had asthma, one had diabetes, one had neurofibromatosis, and one had epilepsy accompanied by headaches. None of the samples exhibited atypical metabolomic patterns that warranted exclusion from the dataset.
The cohort comprised 64 females and 39 males, with ages ranging from 18 to 81.7 years (mean age: 33 years). The time elapsed since the last meal was also recorded, with fasting times ranging from 5 min to 8 h (mean fasting time: 2 h and 34 min; see Table 1). Additional cohort details, including sex, age, and other relevant information, can be found in Supplementary Excel File S1.
Demographic characteristics of donors. Mean and standard deviation values are shown.
| Males (n=39) | Females (n=64) | |
|---|---|---|
| Age, years ± SD | 35 ± 20 | 31 ± 20 |
| n<40 years (%) | 31 (79) | 43 (67) |
| n≥40 years (%) | 8 (21) | 21 (33) |
| Fasting, min ± SD | 139 ± 88 | 179 ± 145 |
Tear obtention
Tear collection was performed using two methods: self-induced tearing by the donor or induction using a commercially available “tear stick” (Kryolan, Germany, Tear Stick, Ref: 03005/00). The product is described as “wax stick in a lipstick mechanism, with an effective content of menthol and camphor extracts so as to generate natural tears”; https://global.kryolan.com/product/tear-stick accessed on Feb 12, 2025) thus making it more suitable than other more drastic methods for tear induction. Tears were collected with a 100 µL micropipette using sterilized tips. Each sample was subsequently transferred to a 0.5 mL Eppendorf tube and stored at −80 °C until metabolomic analysis.
Only five samples were collected without chemical induction. Given the absence of significant compositional differences, data from all samples – regardless of tear type – were included in the statistical analysis.
Tears were collected from donors at various institutions in Barcelona between 16:00 and 18:00 h. A strict time limit was imposed for the tear collection process: a maximum of 2 min for induction and an additional 2 min for collection. Only tears with an approximate volume exceeding 10 µL were retained for storage. Subsequent analysis was performed using tears with a minimum volume of 40 µL, as this was the volume required for plating in each well of the Biocrates kit (details provided below); the remaining samples were discarded.
Mass spectrometry
The AbsoluteIDQ™ p180 Kit (Biocrates Life Sciences, Innsbruck, Austria) was used. 188 metabolites, from biogenic amines, amino acids, hexoses, phospho- and sphingolipids and acyl-carnitines can be determined using this specific kit. Individual metabolites may be found in www.biocrates.com/products/research-products/absoluteidq-p180-kit. The inter-laboratory reproducibility of the platform using human plasma/serum and details of the associated methodology have been reported elsewhere; using standard reference (human) plasma the reported median inter-laboratory precision and accuracy of the assay are, respectively, 6.7 and 107 % [11].
Sample processing was performed as indicated by the manufacturer. Briefly, 10 µL of internal standard (provided by the kit) as well as 10 µL of phosphate buffered saline (PBS) (used as blank), 10 µL of calibrators, 10 µL of quality controls (provided by the kit), or 40 µL of tear samples were plated in each well. Samples were dried down at room temperature under nitrogen gas flow. Next, phenylisothiocyanate (PITC) solution (PITC 5 % V/V in ethanol:water:pyridine 1:1:1 solvent) was added to each well. After 25 min incubation at room temperature, all the wells were dried down under nitrogen gas flow. Metabolites were then resuspended in 300 µL of solvent (5 mM ammonium acetate in methanol). For the analysis, samples were diluted 1:1 with milliQ water (for tandem mass spectrometry coupled to high pressure liquid chromatography (HPLC/MS/MS)) or diluted 1:10 with FIA mobile phase (flow injection analysis (FIA) coupled to MS/MS). The analyses were performed in the AB Sciex 6500 QTRAP MS/MS mass spectrometer (AB Sciex LLC, Framinghan, MA, USA) coupled to an Agilent 1,290 Infinity ultra-high pressure liquid chromatography (UHPLC) system (Agilent, Santa Clara, CA, USA).
HPLC/MS/MS settings
HPLC column was Agilent ZORBAX Eclipse XDB C18, 3.0 × 100 mm, 3.5 μm (Agilent, Santa Clara, CA, USA). Column oven was set up at 50 °C. HPLC mobile phases were water + 0.2 % formic acid (solvent A) and acetonitrile + 0.2 % formic acid (solvent B). Flow rate was maintained at 0.5 mL/min for all the analysis. HPLC gradient started with 0.5 min at 100 % of solvent A, then a gradient for 5 min up to 95 % of solvent B, then 1 min at 95 % of solvent B, and then a gradient for 0.5 min up to 100 % of solvent A. These final conditions were maintained for 2.5 min. Ionization source of MS/MS was electrospray ionization (ESI) in positive mode. ESI probe position was x-axis = 8 and y-axis = 0. The injection volume was set at 5 μL, with the autosampler maintained at 10 °C, and the total LC-MS/MS analysis time per injection was about 9.5 min. Data was recorded using multiple reaction monitoring (MRM) scan type, using the methods provided by the kit.
FIA/MS/MS settings
FIA mobile phase was methanol + FIA Mobile phase Additive provided by the kit. FIA gradient started at a flow rate of 0.03 mL/min for 1.6 min, then flow increased linearly until reaching 0.20 mL/min after 0.8 min. This flow was maintained for 0.4 min. Finally, flow decreased up to 0.03 mL/min in 0.2 min. Ionization source of MS/MS was ESI in positive mode. ESI probe position was x-axis = 5 and y-axis = 5. FIA-MS/MS analysis was carried out with an injection volume of 20 μL. Data was recorded using MRM scan type, using the methods provided by the kit.
Data processing
The initial data files were uploaded into the kit software (Version “Oxygen-DB110-3,023”) and processed using Analyst (AB Sciex LLC, Framinghan, MA, USA) and the MetIDQ™ (Biocrates, Life Sciences, Innsbruck, Austria) software.
Initially, the integration of each LC-peak in every sample was manually reviewed and corrected as needed. Calibration curves for metabolites, based on a 11-point calibration, were then examined. Quadratic regression with 1/x weighting was applied to calculate the calibration curves, as recommended in the manufacturer’s technical guide. Calibration points that fell significantly out of range were excluded. Curve fits were validated to ensure a regression coefficient (R2) of ≥ 0.98. Once plate validation and approval were completed, the LC-MS/MS data were prepared for export in txt format.
FIA data were automatically processed, quantified, and validated within the kit software
Results were reported in μmol/L, with quantification performed at different quality levels (11-point calibration using calibrators or 1-point calibration using internal standard concentrations). To estimate background noise, the median value of zero samples (PBS in three plate wells) was calculated for each metabolite. The limit of detection was set at three times this median value. If no signal was detected in zero samples, the software automatically applied limit-of-detection values established during method validation.
For tear samples, the obtained concentration was then corrected considering the real volume plated in each well. All values used in the statistical analysis are provided in Supplementary Excel File S1. Empty cells in the file indicate values excluded from the analysis, either because they fell below the limit of detection or exceeded the upper concentration range of the standard curves.
Results
Interindividual variance of metabolite concentrations
For several of the samples analyzed, it was possible to reliably determine the concentration of 74 out of 188 metabolites, including 21 amino acids, 6 biogenic amines, 11 acylcarnitines, 8 lysophosphatidylcholines, 15 phosphatidylcholines, and 12 sphingomyelins (see data on metabolite concentrations per sample in Supplementary Excel file S1). For nearly all metabolites, concentrations exhibited substantial inter-individual variability across samples, with some differing by one or even two orders of magnitude. For example, the biogenic amine putrescine measured 0.0048 µM in one sample but reached 1.2675 µM in another. Likewise, the amino acid citrulline ranged from 0.1460 µM in one sample to 69.0 µM in another. These examples are not exceptions, rather it was a common trend observed in all the group of metabolites. On average, the amino acid group is the one displaying a greater variability, followed by that of the biogenic amines. Acylcarnitines and sphingomyelins are the compounds displaying a less pronounced variability, being the average difference of less than one order of magnitude. As mentioned earlier, no significant differences were observed using samples from emotionally induced or chemically induced tears; therefore, data from all samples, regardless of tear type, were included in the statistical analysis.
The variability is so notable that even two samples from individuals of the same sex and age (18 years) exhibit significantly different metabolite concentrations. For alanine, one sample showed a concentration of 71.7 µM, while the other sample had a concentration of 29.0 µM. In the case of serine, one sample had a concentration of 153.7 µM, whereas the other sample had 58.25 µM. In two samples from individuals of the opposite sex, aged 66 and 67 years, glycine concentrations were 40 and 23.2 µM, respectively. For serine, one sample exhibited a concentration of 134.9 µM, while the other displayed a concentration of 44.0 µM. These examples underscore the significant variability in metabolite concentrations across individuals, even when comparing those of the same sex and age group.
Normalization step 1: Model for predicting metabolite concentrations
For normalization, we first attempted to divide each metabolite concentration by the total sum of all metabolites in the sample; however, this approach yielded unsatisfactory results. We then applied probabilistic quotient normalization, which is specifically designed to correct for systematic variability in metabolomics data, particularly when, as in the case of tear samples, there are differences in sample volume or concentration. In this method, we computed the median concentration of each metabolite across all samples, using this as a reference to adjust for variations in sample volume and handling. Finally, we tried median and mean normalization, where metabolite concentrations were divided by either the median or mean concentration of all metabolites in the sample. However, none of these methods provided satisfactory results, as inter-individual variability remained high or even increased further.
Normalization step 2: Searching for a reference metabolite concentration for predicting metabolite concentrations
Our next approach was to develop a linear model using a reference metabolite that could normalize all the data for each sample. Preliminary assays using square roots, logarithms, and combinations of both led to hypothesize that a logarithmic transformation would be the most suitable. Based on optimal performance, one model was selected. The model can be described by a linear equation, that for a given i-th metabolite takes the form:
Being “reference” a metabolite of reference. For operational purposes we passed log[reference] to the right side of the equation and used the equivalent expression:
The next step was to identify the reference metabolite, which will be referred to as the “concomitant” metabolite. In statistics, a “concomitant” parameter refers to a variable that is included in a model to account for or adjust the relationship between other variables, often serving as a covariate. It is not the primary variable of interest but is considered important for explaining or modifying the observed outcome. In our context, the concomitant parameter refers to the actual concentration of a specific metabolite that is used to adjust or account for the variation in other metabolite concentrations within the same sample. Then Eq. (1a) can be rewritten as:
The equation predicts the concentration of a given metabolite by considering age (in years), sex (0 for males and 1 for females), fasting time (in minutes) and the concentration (in the sample) of a reference metabolite. Concentrations were in international units, i.e. in Molar. β0i, β1i, β2i, β3i, β4i and β5i are the regression coefficients that must be calculated by every metabolite (i-th) in the tear sample, “Age” is computed in years, “Sex” is 0 for males and 1 for females, and “Fasting” is computed in minutes. Notice that for Sex=0, males, Eq. (1) reduces to
All metabolites were systematically tested as potential concomitant candidates. A key finding was that no single metabolite was useful to predict the concentration of all other metabolites in the sample. Therefore, we explored groups of metabolites categorized as follows: (i) amino acids, (ii) biogenic amines, (iii) acylcarnitines, (iv) lysophosphatidylcholines, (v) phosphatidylcholines, and (vi) sphingomyelins. For each metabolite within every family, we evaluated each metabolite individually as a potential concomitant and computed the distances between the predicted and actual concentrations (of the other metabolites) based on Eq. (1). Importantly, there were no prior restrictions on selection based on molecular structure or shared metabolic pathways. Instead, selection was guided by residual minimization using least-squares optimization. Final model selection was based on adjusted R2 values, with statistical analysis performed using R software.
The overall process involved two key steps: (i) determining the β parameter in Eq. (1) and (ii) selecting the optimal concomitant metabolite – requiring the evaluation of over 700,000 models. The results identified the following optimal concomitant metabolites: proline (amino acids), taurine (biogenic amines), C0 (acylcarnitines), lysoPC a C14:0 (lysophosphatidylcholines), PC aa C32:1 (phosphatidylcholines), and SM C16:0 (sphingomyelins).
For a given metabolite, for instance, an amino acid, arginine (Arg), the predictive equation for a female donor becomes:
For amino acids the concomitant metabolite is proline (see below)
For a given sample of a female
The donor in this case (female) is 18.9 years old and tear was given 240 min after a meal:
Hence,
Considering that [Arg]actual=3.55E−05M, the difference between [Arg] actual and [Arg]predicted is, in absolute value, 1.07E−05 M, and the quotient [Arg]actual/[Arg]predicted=1.43.
A second example considering a 48-years-old female with 60 min of fasting, the [Arginine]actual in her sample was 4.675E−05 and [Arginine]predicted was 4.67E−05; therefore, the [Arg] actual/[Arg]predicted=1.0003.
The concomitant variable, i.e., proline concentration, is positively associated with the arginine concentration, the higher the concentration of proline, the higher the concentration of arginine. This positive association is indexed by the coefficient β1 in Eq. (1b) (β1=1.04109). For comparison the equivalent regressor for alanine is 1.2613. In addition, for an older the individual, the lower the concentration, and the longer the fasting, the higher the concentration. These associations are captured by the coefficients −0.00063977 and 0.0002797. Finally, regarding sex, females had a lower concentration of arginine, and older females had an even lower concentration, which are indexed by the coefficients 0.0493999 and 0.00244175, respectively. Regarding other metabolites, the tendencies of these variables: age, fasting and sex on the concentration of the metabolites of interest were similar with some exceptions.
Using this normalization approach, we examined potential differences in the composition of emotional-induced and chemical-induced tears, but no significant differences were observed. The data presented in the paper were obtained by considering the values from all samples.
Normalization step 3: Gaussian distribution of residuals
Data for a given metabolite were not following a Gaussian distribution. For practical purposes values consisting of log[metabolitei]predicted/[reference]) cannot be used for making a proper distribution of the data. Normal distribution was achieved by the residuals obtained by considering predicted and actual values of metabolite concentrations, in fact, the differences between actual log[metabolitei]predicted and log[metabolitei]actual were normal, with few exceptions. Specifically, the Shapiro-Wilk normality test indicates lack of Gaussian distribution (p<0.05) for all metabolites reliably quantified in tears (Figure 1A). In contrast, Figure 1B indicates normal distribution (p>0.05) of log[metabolitei]predicted-log[metabolitei]actual residuals for all metabolites except for three phosphatidylcholines, PC.aa.C38.6, PC.ae.C34.1 and PC.ae.C34.2. The code was developed in RStudio, as it provides tools to facilitate the coding process.
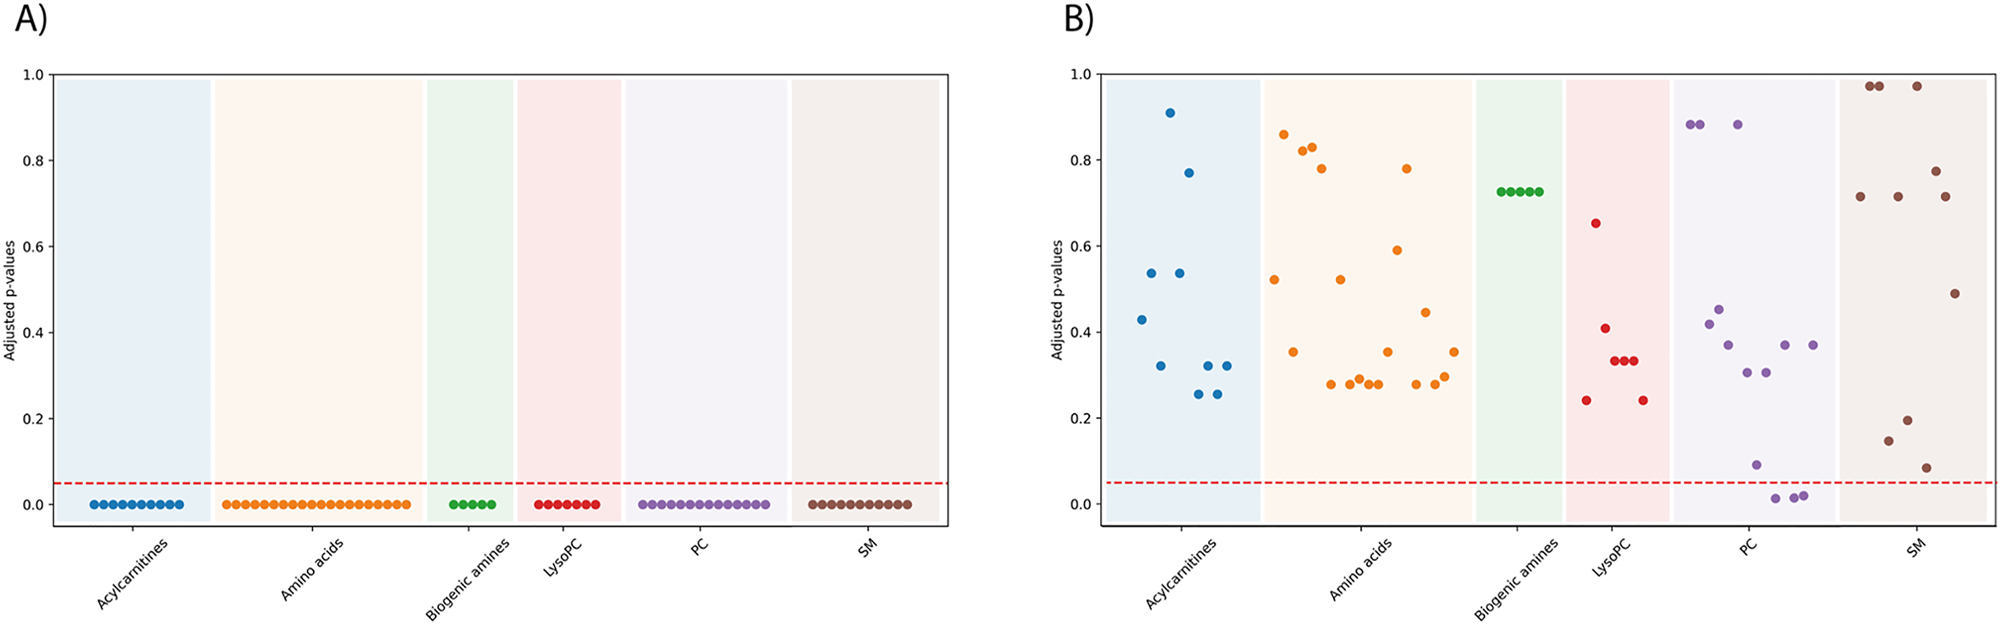
Adjusted p-values from the Shapiro-Wilk normality test for each metabolite. Each dot represents the value of a metabolite; each color represent a metabolic group as indicated in the label in the X axis, (A) before standardizing and (B) after standardizing/normalization using Eq. (1b). The dotted horizontal line is the threhold for Gaussian distribution (p<0.05 indicates lack of normal distribution).
Approach for categorical discrimination
The ultimate goal of this study on tear composition was to leverage the normality of residuals to establish categories that, in a clinical setting, would help differentiate healthy individuals from patients. In this case, sex was used as the categorical parameter. The behavior of the residuals, defined as log[metabolite]predicted – log[metabolite]actual, varied depending on the metabolite. For each predicted metabolite concentration Figure 2, illustrates the unadjusted (Figure 2A) and adjusted (Figure 2B) explained variability (R2). The values fluctuate, indicating that the degree of success – defined as the closeness between predicted and actual concentrations – differs by metabolite. For acylcarnitines, the success rate is relatively low (<0.4, or 40 %), while for amino acids, it is comparatively higher.

Dotplot indicating multiple (A) and adjusted (B) R-squared coefficient. Each color represents a different metabolic group.
Can the residuals for certain metabolites in tears derived from the use of Eq. (1b) be used to make categorizations? Overall, the closeness between log[metabolite]predicted and log[metabolite]actual, is quite remarkable although individual differences are observed. Figure 3 provides two examples. In the case of arginine (left bar) the adjusted R2 value, i.e., the explained variability is notable, 0.59. In other words, the linear model depicted in Eq. (1b) explains 59 % of the concentration variation of the samples. Strikingly, adjusted R2 is excellent for glutamine (right bar), 0.90, meaning that Eq. (1b) explains 90 % of the concentration variation of the samples. The model is constructed in such a way that, for a given metabolite, the mean of predicted concentrations of all samples is very close to the mean of actual concentrations; red dots in Figure 3 show that the mean of the actual-predicted differences is near zero for arginine and for glutamine (and for the other amino acids, not shown). Gaussian distribution of these differences is centered in such a way that the mean of [glutamine]actual/[glutamine]predicted=1 (log 1=0) This is a remarkable achievement that sustains the potential of the method for interindividual data comparisons.

Data from all donor’s tear samples are considered. The Y axis shows the differences in M between actual and predicted concentrations. The red dot indicates the mean of the differences considering all samples.
Approach to detect sex differences
Questioning the model to check for its usefulness for reliable categorization was the most important aim of this study. First, many of the metabolites determined may not be useful at all. However, the advantage of metabolomics is the simultaneous detection of dozens of metabolites in a biological fluid, for later, in routine tests use only a few metabolites. Those metabolites would then be real biomarkers for categorization.
Could be our model useful to know the sex of the donor based only in the concentration of a metabolite and a concomitant metabolite in tear?
A first analysis showed that the differences in acylcarnitine concentrations could provide the desired outcome (Table 2). The grand mean of acylcarnitine concentration is significantly different in males vs. females (p<0.05). However, it would be a matter of chance to guess the donor’s sex when a new sample is incorporated into the analysis in a blind manner. This problem derives from to the high variability observed in the samples, which is one of the stumbling blocks to overcome in human clinical chemistry. In fact, taking C4 acylcarnitine as example and using the Student’s t test comparison one could misclassify a female with [C4 acylcarnitine] closer to the mean of males (6.92E-08 M) than to the mean of females (4.11E-08 M). To circumvent this issue, we have developed an approach using linear discriminant analysis (LDA) and validation using the leave-one-out procedure.
Sex-based differences in acylcarnitine concentration. Mean values of Predicted and actual concentrations segregated by sex. The predicted values were obtained using Eq. (1b).
| Aylcarnitine | Mean males [concentration]predicted (M) | Mean females [concentration]predicted (M) | Mean males [concentration]real (M) | Mean females [concentration]real (M) |
|---|---|---|---|---|
| C0 (concomitant) | – | – | 1.29E-06 | 1.70E-06 |
| C3 | 1.49E-07 | 9.60E-08 | 1.65E-07 | 1.06E-07 |
| C4 | 6.06E-08 | 3.67E-08 | 6.92E-08 | 4.11E-08 |
| C5 | 4.38E-07 | 1.93E-07 | 5.78E-07 | 2.83E-07 |
| C5·OH.C3.DC.M. | 2.06E-08 | 1.61E-08 | 2.15E-08 | 1.67E-08 |
| C12.1 | 7.21E-08 | 7.25E-08 | 7.28E-08 | 7.47E-08 |
We then devised a linear discriminant analysis (LDA) approach based on eliminating the data from one sample and calculate the value of the β regression coefficients using data from all the other samples using Eq. (2), i.e. without considering the sex in the formula:
Then, we computed the differences log[metabolitei]predicted – log[metabolitei]real and used the label sex to segregate male and female populations by implementing an LDA classifier. After doing so, we calculated log[metabolitei]predicted of the excluded sample using the log[concomitant] of the excluded sample. Then, the residuals (log[metabolitei]predicted minus the log[metabolitei]real) of the excluded sample served to classify the excluded sample as coming from a male or from a female. In other words, if the difference log[metabolitei]predicted – log[metabolitei]real was closer to the centroid of the distribution values for the male population, the sample was classified as male. Otherwise, it was classified as female. This process was repeated for all samples using the leave-one-out method which consists of repeating the same procedure but taking one sample out and using the remaining samples to calculate the regressors of the model. The leave-one-out data analysis indicated that the percentage of success in predicting the sex of the donor using acylcarnitine C4 was 78 %. Remarkably, the use of acylcarnitine C4 led to correctly predict the sex of 92 % of females. These data mean that by only considering C4, a concomitant metabolite and knowing the age and fasting time of the donor, our development allows categorical classifications to be made.
We conducted Lasso logistic regression using the actual values of C0, C4 and C5. The accuracy, measured as quotient of correct predictions vs. total, was 65, 71 and 71 % when using, respectively C0, C4 or C5. C0 was the weakest discriminator because it failed to classify males; C4 and C5 show similar results, with better discrimination but still scoring low in male classification. In terms of sensibility and specificity for detecting females the values were 100 % for sensitivity but very low for specificity (0 % when using C0 and 16.7 % when using C4 or C5). Taking logarithms slightly improved performance in the case of C0, did no modify the performance in the case of C5 and decreased the performance in the case of C5. The non-linear Random Forest classifier led to the following values for sensitivity and specificity, respectively, 54 and 33 % using C0, 54 and 50 % using C4 and 82 and 33 % using C5. Overall, in comparison, our model was significantly better at predicting sex.
Discussion
The need for advanced diagnostic tools to detect neurodegenerative diseases such as Alzheimer’s and Parkinson’s is well-documented, with early diagnosis being crucial for improving patient outcomes and reducing healthcare costs [12]. Additionally, precision medicine requires innovative methodologies to stratify patients and monitor disease progression effectively. Based on advancements in metabolomics and previous work with aqueous humor [13], [14], [15], we hypothesized that human tears could serve as a valuable biofluid for clinical chemistry applications. Unlike aqueous humor, which requires invasive collection methods, tears offer a non-invasive and accessible alternative, making them highly suitable for routine diagnostics [16].
A major challenge in tear-based biomarker research is the high interindividual variability in metabolite concentrations, which complicates the establishment of reference values using conventional methods. Prior studies have documented these inconsistencies [17], 18] highlighting the limitations of traditional Gaussian-distributed reference models commonly used in clinical chemistry [19]. To address this, we developed a novel methodological framework that normalizes data using the concentration of a concomitant metabolite within each chemical family. The goal is to enhance the prediction of other metabolites by including this variable, reducing the impact of potential confounding factors. In essence, the concomitant parameter serves as a supplementary variable that influences or supports the analysis of the primary metabolites of interest, helping to correct for variability or establish clearer patterns. This approach significantly minimizes variability, allowing reliable interindividual comparisons.
To evaluate the robustness of our approach, we compared our classification results with alternative statistical methods, including Lasso logistic regression and a Random Forest-based approach. While these conventional machine learning models showed moderate success in classifying sex based on metabolite concentrations, our method outperformed them in accuracy, achieving a 92 % success rate in predicting female donors based on the concentrations of two metabolites: C4 acylcarnitine and the concomitant of the family, C0 acylcarnitine. These findings highlight the advantages of our normalization strategy in reducing variability and enhancing the discriminatory power of metabolomic biomarkers.
While sex classification has successfully illustrated the potential of our methodology, our primary goal is to apply this framework to crucial disease-related classifications. We aim to clearly differentiate between individuals who are healthy and those who are affected by neurodegenerative or systemic diseases. By establishing a strong baseline for interindividual metabolomic comparisons, our approach not only lays the groundwork for these significant applications but will also deepen our understanding of the underlying mechanisms of disease, paving the way for enhanced diagnostic and therapeutic strategies.
Recognizing the pivotal role of reproducibility in clinical metabolomics, we undertook an extensive evaluation of various tear collection methods. Emotional self-induced tears present a compelling advantage, as they are inherently free from the influences of external triggers or environmental factors. However, the variability of emotional responses introduces significant challenges to the standardization process. In our study, we gathered only a modest number of emotional tear samples (n=5), which notably constrained their broader applicability and the insights that could be derived from them.
To effectively address this challenge, we opted for chemical-induction of tears – using a technique widely used by actors to evoke tears. This method ensures that all participants generate a minimum of 40 µL of tears within a carefully controlled timeframe, thereby enhancing the reliability and validity of our results. The significance of such standardization is especially critical in large-scale studies and potential clinical applications, where consistency in sample collection is essential. By adopting this approach, we strengthen the relevance of our findings, making them not only robust but also applicable in real-world settings.
One potential limitation of chemical induction is the possibility of interference with mass spectrometry measurements, particularly due to ionic suppression effects. However, our metabolomic analysis confirmed that the presence of menthol in the collected samples was negligible, and we observed no significant interference in metabolite detection. Additionally, a comparative analysis of the two tear collection methods revealed no significant differences in metabolite concentrations, further supporting the robustness of our findings. These results suggest that menthol induction could serve as a reliable and standardized method for tear collection in metabolomic studies, particularly when standardization is a priority.
We purposefully selected a cohort of individuals without any ocular conditions to establish a reliable baseline for metabolite concentrations in tears. This careful approach ensures that future comparisons with disease-affected populations are based on a well-defined reference dataset. Additionally, our commitment to methodological rigor was essential in securing ethical approval for the study, as detailed in the carefully crafted protocol approved by the bioethical committee. This foundational work not only enhances the credibility of our research but also amplifies the potential impact of our findings in the field.
Future research should extend this methodology to patient cohorts to determine its diagnostic utility for neurodegenerative and ocular diseases. External validation in independent cohorts will be crucial for confirming the reproducibility and broader applicability of our findings. Although the current study was limited by sample availability, we recognize the necessity of validating our approach with larger and more diverse populations. By providing a standardized methodology and demonstrating the feasibility of tear metabolomics, our work lays the groundwork for future studies aimed at integrating tear-based diagnostics into clinical practice.
Furthermore, expanding the range of metabolites utilized in the classification process offers significant potential for enhancing diagnostic accuracy. Previous research has compellingly demonstrated that specific metabolites in aqueous humor can serve as effective biomarkers for differentiating between various conditions [13], 14]. By applying a similar methodology to tear analysis, we could uncover valuable insights, leading to the creation of highly refined disease classification models. Such advancements have the potential to transform diagnostic practices, ultimately enabling more precise and targeted approaches to patient care.
Conclusions
This study advances the field of tear metabolomics by introducing a robust normalization framework that significantly reduces interindividual variability. Our findings demonstrate that menthol-induced tears can be effectively used for biomarker discovery without introducing significant methodological bias, making this method a practical choice for standardized tear collection.
By implementing a normalization protocol that accounts for interindividual variability, we demonstrated that biomarker identification can be optimized through the relationship between a preselected concomitant metabolite and the biomarker of interest. Using this novel methodology, we achieved a 92 % accuracy in classifying female donors based on just two clinical chemistry parameters. This demonstrates the potential of our approach for categorical discrimination, even in the presence of substantial biological variability.
The proposed approach has broad implications for precision medicine, providing a reliable and scalable tool for identifying metabolic biomarkers in tears and potentially other biofluids. Further validation in external cohorts will be essential for translating these findings into clinical practice, but our work provides a solid foundation for future metabolomics-based diagnostic strategies.
Acknowledgments
Special thanks to all the donors, in particular to both professors and students at the University of Barcelona and of the EÒLIA Centre Superior d’Art Dramàtic. We would like to thank the CCiTUB (Scientific and Technological Centers of the UB) of the Universitat de Barcelona (Barcelona, Spain), for the expert and technical help using the LC-MS/MS equipment.
-
Research ethics: Participants were informed and signed consent was obtained. In terms of ethical standards, this study adhered to the tenets of the declaration of Helsinki and the national and international regulations. The study has been evaluated and approved by the Comitè d’Ètica de la Investigació de les Illes Balears; Spain. Protocol: CEI: IB 5332/23 PI.
-
Informed consent: Approved by ad hoc Ethical Committee and signed by all donors.
-
Author contributions: RF, MC and SM designed the experiments and DBC the data analysis approach. RF, DBC and JSM wrote the main manuscript. JSM and SM did the experimental work. JSN, HAA, JL, CG, TC, IRR collected samples, stored information of donors and prepared data sets. Data analysis was performed by SM and JSM. Experimental supervision was done by JSN, HAA, MC and RF. Data analysis supervision was done by DBC and RF. Data analysis supervision was done by DBC and RF. JSM and AI prepared figures (including supplementary). All authors edited the manuscript and agreed to the submitted version.
-
Use of Large Language Models, AI and Machine Learning Tools: None declared.
-
Conflict of interest: The authors state no conflict of interest.
-
Research funding: None declared.
-
Data availability: Data are provided as supplementary material. Details on the methodology to select concomitant metabolites and biomarkers can be provided upon reasonable request to the corresponding authors and only after proper protection of intellectual property.
References
1. Król-Grzymała, A, Sienkiewicz-Szłapka, E, Fiedorowicz, E, Rozmus, D, Cieślińska, A, Grzybowski, A. Tear biomarkers in alzheimer’s and Parkinson’s diseases, and multiple sclerosis: implications for diagnosis (systematic review). Int J Mol Sci 2022;23:10123. https://doi.org/10.3390/ijms231710123. Available from: https://www.mdpi.com/1422-0067/23/17/10123/htmSearch in Google Scholar PubMed PubMed Central
2. Suárez-Cortés, T, Merino-Inda, N, Benitez-del-Castillo, JM. Tear and ocular surface disease biomarkers: a diagnostic and clinical perspective for ocular allergies and dry eye disease. Exp Eye Res 2022;221:109121. https://doi.org/10.1016/j.exer.2022.109121.Search in Google Scholar PubMed
3. Wittenbecher, C, Guasch-Ferré, M, Haslam, DE, Dennis, C, Li, J, Bhupathiraju, SN, et al.. Changes in metabolomics profiles over ten years and subsequent risk of developing type 2 diabetes: results from the Nurses’ Health Study. EBioMedicine 2022;75:103799. https://doi.org/10.1016/j.ebiom.2021.103799.Search in Google Scholar PubMed PubMed Central
4. Bernal-Casas, D, Serrano-Marín, J, Sánchez-Navés, J, Oller, JM, Franco, R. Advancing personalized medicine by analytical means: selection of three metabolites that allows discrimination between glaucoma, diabetes, and controls. Metabolites 2024;14:149. https://doi.org/10.3390/metabo14030149. Available from: https://www.mdpi.com/2218-1989/14/3/149/htm.Search in Google Scholar PubMed PubMed Central
5. Zhang, JD, Xue, C, Kolachalama, VB, Donald, WA. Interpretable machine learning on metabolomics data reveals biomarkers for Parkinson’s disease. ACS Cent Sci 2023;9:1035–45. https://doi.org/10.1021/acscentsci.2c01468. Available from: https://pubs.acs.org/doi/full/10.1021/acscentsci.2c01468.Search in Google Scholar PubMed PubMed Central
6. Brunmair, J, Bileck, A, Schmidl, D, Hagn, G, Meier-Menches, SM, Hommer, N, et al.. Metabolic phenotyping of tear fluid as a prognostic tool for personalised medicine exemplified by T2DM patients. EPMA J 2022;13:107–23. https://doi.org/10.1007/s13167-022-00272-7.Search in Google Scholar PubMed PubMed Central
7. Nokhoijav, E, Guba, A, Kumar, A, Kunkli, B, Kalló, G, Káplár, M, et al.. Metabolomic analysis of serum and tear samples from patients with obesity and type 2 diabetes mellitus. Int J Mol Sci 2022;23:4534. https://doi.org/10.3390/ijms23094534.Search in Google Scholar PubMed PubMed Central
8. Beykin, G, Norcia, AM, Srinivasan, VJ, Dubra, A, Goldberg, JL. Discovery and clinical translation of novel glaucoma biomarkers. Prog Retin Eye Res 2021;80:100875. https://doi.org/10.1016/j.preteyeres.2020.100875.Search in Google Scholar PubMed PubMed Central
9. Pflugfelder, SC, Stern, ME. Biological functions of tear film. Exp Eye Res. 2020 https://doi.org/10.1016/j.exer.2020.108115, Available from: https://pubmed.ncbi.nlm.nih.gov/32561483/Search in Google Scholar PubMed PubMed Central
10. Chen, L, Zhou, L, Chan, ECY, Neo, J, Beuerman, RW. Characterization of the human tear metabolome by LC-MS/MS. J Proteome Res 2011;10:4876–82. https://doi.org/10.1021/pr2004874. Available from: https://pubs.acs.org/doi/abs/10.1021/pr2004874.Search in Google Scholar PubMed
11. Siskos, AP, Jain, P, Römisch-Margl, W, Bennett, M, Achaintre, D, Asad, Y, et al.. Interlaboratory reproducibility of a targeted metabolomics platform for analysis of human serum and plasma. Anal Chem 2017;89:656–65. https://doi.org/10.1021/acs.analchem.6b02930. Available from: https://pubmed.ncbi.nlm.nih.gov/27959516/.Search in Google Scholar PubMed PubMed Central
12. Rani, S, Dhar, SB, Khajuria, A, Gupta, D, Jaiswal, PK, Singla, N, et al.. Advanced overview of biomarkers and techniques for early diagnosis of alzheimer’s disease. Cell Mol Neurobiol 2023;43:2491–523. https://doi.org/10.1007/s10571-023-01330-y, Available from: https://link.springer.com/article/10.1007/s10571-023-01330-ySearch in Google Scholar PubMed PubMed Central
13. Serrano-Marín, J, Marin, S, Bernal-Casas, D, Lillo, A, González-Subías, M, Navarro, G, et al.. A metabolomics study in aqueous humor discloses altered arginine metabolism in Parkinson’s disease. Fluids Barriers CNS 2023;20:1–13. https://doi.org/10.1186/s12987-023-00494-5, Available from: https://fluidsbarrierscns.biomedcentral.com/articles/10.1186/s12987-023-00494-5Search in Google Scholar PubMed PubMed Central
14. Lillo, A, Marin, S, Serrano-Marín, J, Bernal-Casas, D, Binetti, N, Navarro, G, et al.. Biogenic amine levels markedly increase in the aqueous humor of individuals with controlled type 2 diabetes. Int J Mol Sci 2022;23:12752. https://doi.org/10.3390/ijms232112752. Available from: https://www.mdpi.com/1422-0067/23/21/12752/htm.Search in Google Scholar PubMed PubMed Central
15. Lillo, A, Marin, S, Serrano-Marín, J, Binetti, N, Navarro, G, Cascante, M, et al.. Targeted metabolomics shows that the level of glutamine, kynurenine, acyl-carnitines and lysophosphatidylcholines is significantly increased in the aqueous humor of glaucoma patients. Front Med 2022;9:2082. https://doi.org/10.3389/fmed.2022.935084.Search in Google Scholar PubMed PubMed Central
16. Zhou, L, Beuerman, RW. The power of tears: how tear proteomics research could revolutionize the clinic. Expert Rev Proteomics 2017;14:189–91. https://doi.org/10.1080/14789450.2017.1285703. Available from: https://pubmed.ncbi.nlm.nih.gov/28117610/.Search in Google Scholar PubMed
17. Brunmair, J, Bileck, A, Schmidl, D, Hagn, G, Meier-Menches, SM, Hommer, N, et al.. Metabolic phenotyping of tear fluid as a prognostic tool for personalised medicine exemplified by T2DM patients. EPMA J 2022;13:107–23. https://doi.org/10.1007/s13167-022-00272-7. Available from: https://link.springer.com/article/10.1007/s13167-022-00272-7.Search in Google Scholar PubMed PubMed Central
18. Khanna, RK, Catanese, S, Emond, P, Corcia, P, Blasco, H, Pisella, PJ. Metabolomics and lipidomics approaches in human tears: a systematic review. Surv Ophthalmol 2022;67:1229–43. https://doi.org/10.1016/j.survophthal.2022.01.010. Available from: http://www.surveyophthalmol.com/article/S003962572200008X/fulltext.Search in Google Scholar PubMed
19. McPherson, RA, Pincus, MR. Henry’s clinical diagnosis and management by laboratory methods. Philadelphia: Saunders; 2011.Search in Google Scholar
Supplementary Material
This article contains supplementary material (https://doi.org/10.1515/cclm-2024-1360).
© 2025 the author(s), published by De Gruyter, Berlin/Boston
This work is licensed under the Creative Commons Attribution 4.0 International License.
Articles in the same Issue
- Frontmatter
- Editorial
- Setting analytical performance specification by simulation (Milan model 1b)
- Reviews
- Unveiling the power of R: a comprehensive perspective for laboratory medicine data analysis
- Clostebol detection after transdermal and transmucosal contact. A systematic review
- Opinion Papers
- A value-based score for clinical laboratories: promoting the work of the new EFLM committee
- Digital metrology in laboratory medicine: a call for bringing order to chaos to facilitate precision diagnostics
- Perspectives
- Supporting prioritization efforts of higher-order reference providers using evidence from the Joint Committee for Traceability in Laboratory Medicine database
- Clinical vs. statistical significance: considerations for clinical laboratories
- Genetics and Molecular Diagnostics
- Reliable detection of sex chromosome abnormalities by quantitative fluorescence polymerase chain reaction
- Targeted proteomics of serum IGF-I, -II, IGFBP-2, -3, -4, -5, -6 and ALS
- Candidate Reference Measurement Procedures and Materials
- Liquid chromatography tandem mass spectrometry (LC-MS/MS) candidate reference measurement procedure for urine albumin
- General Clinical Chemistry and Laboratory Medicine
- Patient risk management in laboratory medicine: an international survey to assess the severity of harm associated with erroneous reported results
- Exploring the extent of post-analytical errors, with a focus on transcription errors – an intervention within the VIPVIZA study
- A survey on measurement and reporting of total testosterone, sex hormone-binding globulin and free testosterone in clinical laboratories in Europe
- Quality indicators in laboratory medicine: a 2020–2023 experience in a Chinese province
- Impact of delayed centrifugation on the stability of 32 biochemical analytes in blood samples collected in serum gel tubes and stored at room temperature
- Concordance between the updated Elecsys cerebrospinal fluid immunoassays and amyloid positron emission tomography for Alzheimer’s disease assessment: findings from the Apollo study
- Novel protocol for metabolomics data normalization and biomarker discovery in human tears
- Use of the BIOGROUP® French laboratories database to conduct CKD observational studies: a pilot EPI-CKD1 study
- Reference Values and Biological Variations
- Consensus instability equations for routine coagulation tests
- Hematology and Coagulation
- Flow-cytometric lymphocyte subsets enumeration: comparison of single/dual-platform method in clinical laboratory with dual-platform extended PanLeucogating method in reference laboratory
- Cardiovascular Diseases
- Novel Mindray high sensitivity cardiac troponin I assay for single sample and 0/2-hour rule out of myocardial infarction: MERITnI study
- Infectious Diseases
- Cell population data for early detection of sepsis in patients with suspected infection in the emergency department
- Letters to the Editor
- Lab Error Finder: A call for collaboration
- Cascading referencing of terms and definitions
- Strengthening international cooperation and confidence in the field of laboratory medicine by ISO standardization
- Determining the minimum blood volume required for laboratory testing in newborns
- Performance evaluation of large language models with chain-of-thought reasoning ability in clinical laboratory case interpretation
- Vancomycin assay interference: low-level IgM paraprotein disrupts Siemens Atellica® CH VANC assay
- Dr. Morley Donald Hollenberg. An extraordinary scientist, teacher and mentor