
Remarkable pseudoleucocytosis induced by mild cryoglobulinemia
-
Xiang Qian


To the Editor,
We recently met a special case during routine blood examination. A 56-year-old man was diagnosed with B-cell lymphoproliferative disorder (Waldenström’s macroglobulinemia, WM) and admitted to hospital for treatment. Here are his laboratory examination results on admission. Complete blood cell count (CBC) results measured using the Coulter DxH800 automatic hematology analyzer (“Coulter” in short, Beckman Coulter, Brea, CA, USA) were: WBC 122.83×10⁹/L (ref. 3.50–9.50×10⁹/L), RBC 3.25×10¹²/L (ref. 3.80–5.10×10¹²/L), Hb 94 g/L (ref. 130–175 g/L), and PLT 191×109/L (ref. 125–350×109/L). The patient was with normocytic normochromic anemia, which was the manifestation of WM. The WBC histogram showed a decreasing trend (Figure 1A) and the analyzer alarm indicated the presence of nucleated red blood cells (NRBCs). Peripheral smear prepared by the Coulter DxH Slidemaker Stainer (Beckman Coulter, Brea, CA, USA) indicated normal WBC count and none of NRBCs (Figure 1D). However, a large amount of irregular blue-gray lump-like deposits were observed on the smear prepared manually (Figure 1E). The specimen was immediately assayed by Coulter after the blood was heated to 37°C for 30 min. The results were as follows: WBC 6.80×10⁹/L, RBC 3.20×10¹²/L, Hb 99 g/L, and PLT 166×109/L. The WBC histogram of Coulter showed a normal distribution without any alarms (Figure 1B). Microscopic examination showed that these blue-gray deposits disappeared (Figure 1F). Other laboratory tests included: (1) Serum protein concentration: total protein 44.6 g/L (ref. 65.0–85.0 g/L), albumin 28.6 g/L (ref. 40.0–55.0 g/L), and globulin 16.0 g/L (ref. 20.0–40.0 g/L). (2) Immunoglobulin assay: IgG 6.21 g/L (ref. 7.00–16.00 g/L), IgA 0.41 g/L (ref. 0.70–4.00 g/L), and IgM 2.86 g/L (ref. 0.40–2.30 g/L). (3) Identification of cryoglobulin: cryocrit was 0.6% (ref. <0.4%), and serum immunofixation electrophoresis showed light IgM-kappa bands. (4) Renal function tests and renal biopsy: urea nitrogen was 15.04 mmol/L (ref. 2.1–7.2 mmol/L) and creatinine was 748.4 μmol/L (ref. 44–132 μmol/L). Because of the worse renal function, a renal biopsy was performed. The pathology results and immunofluorescence findings confirmed type I cryoglobulinemia.
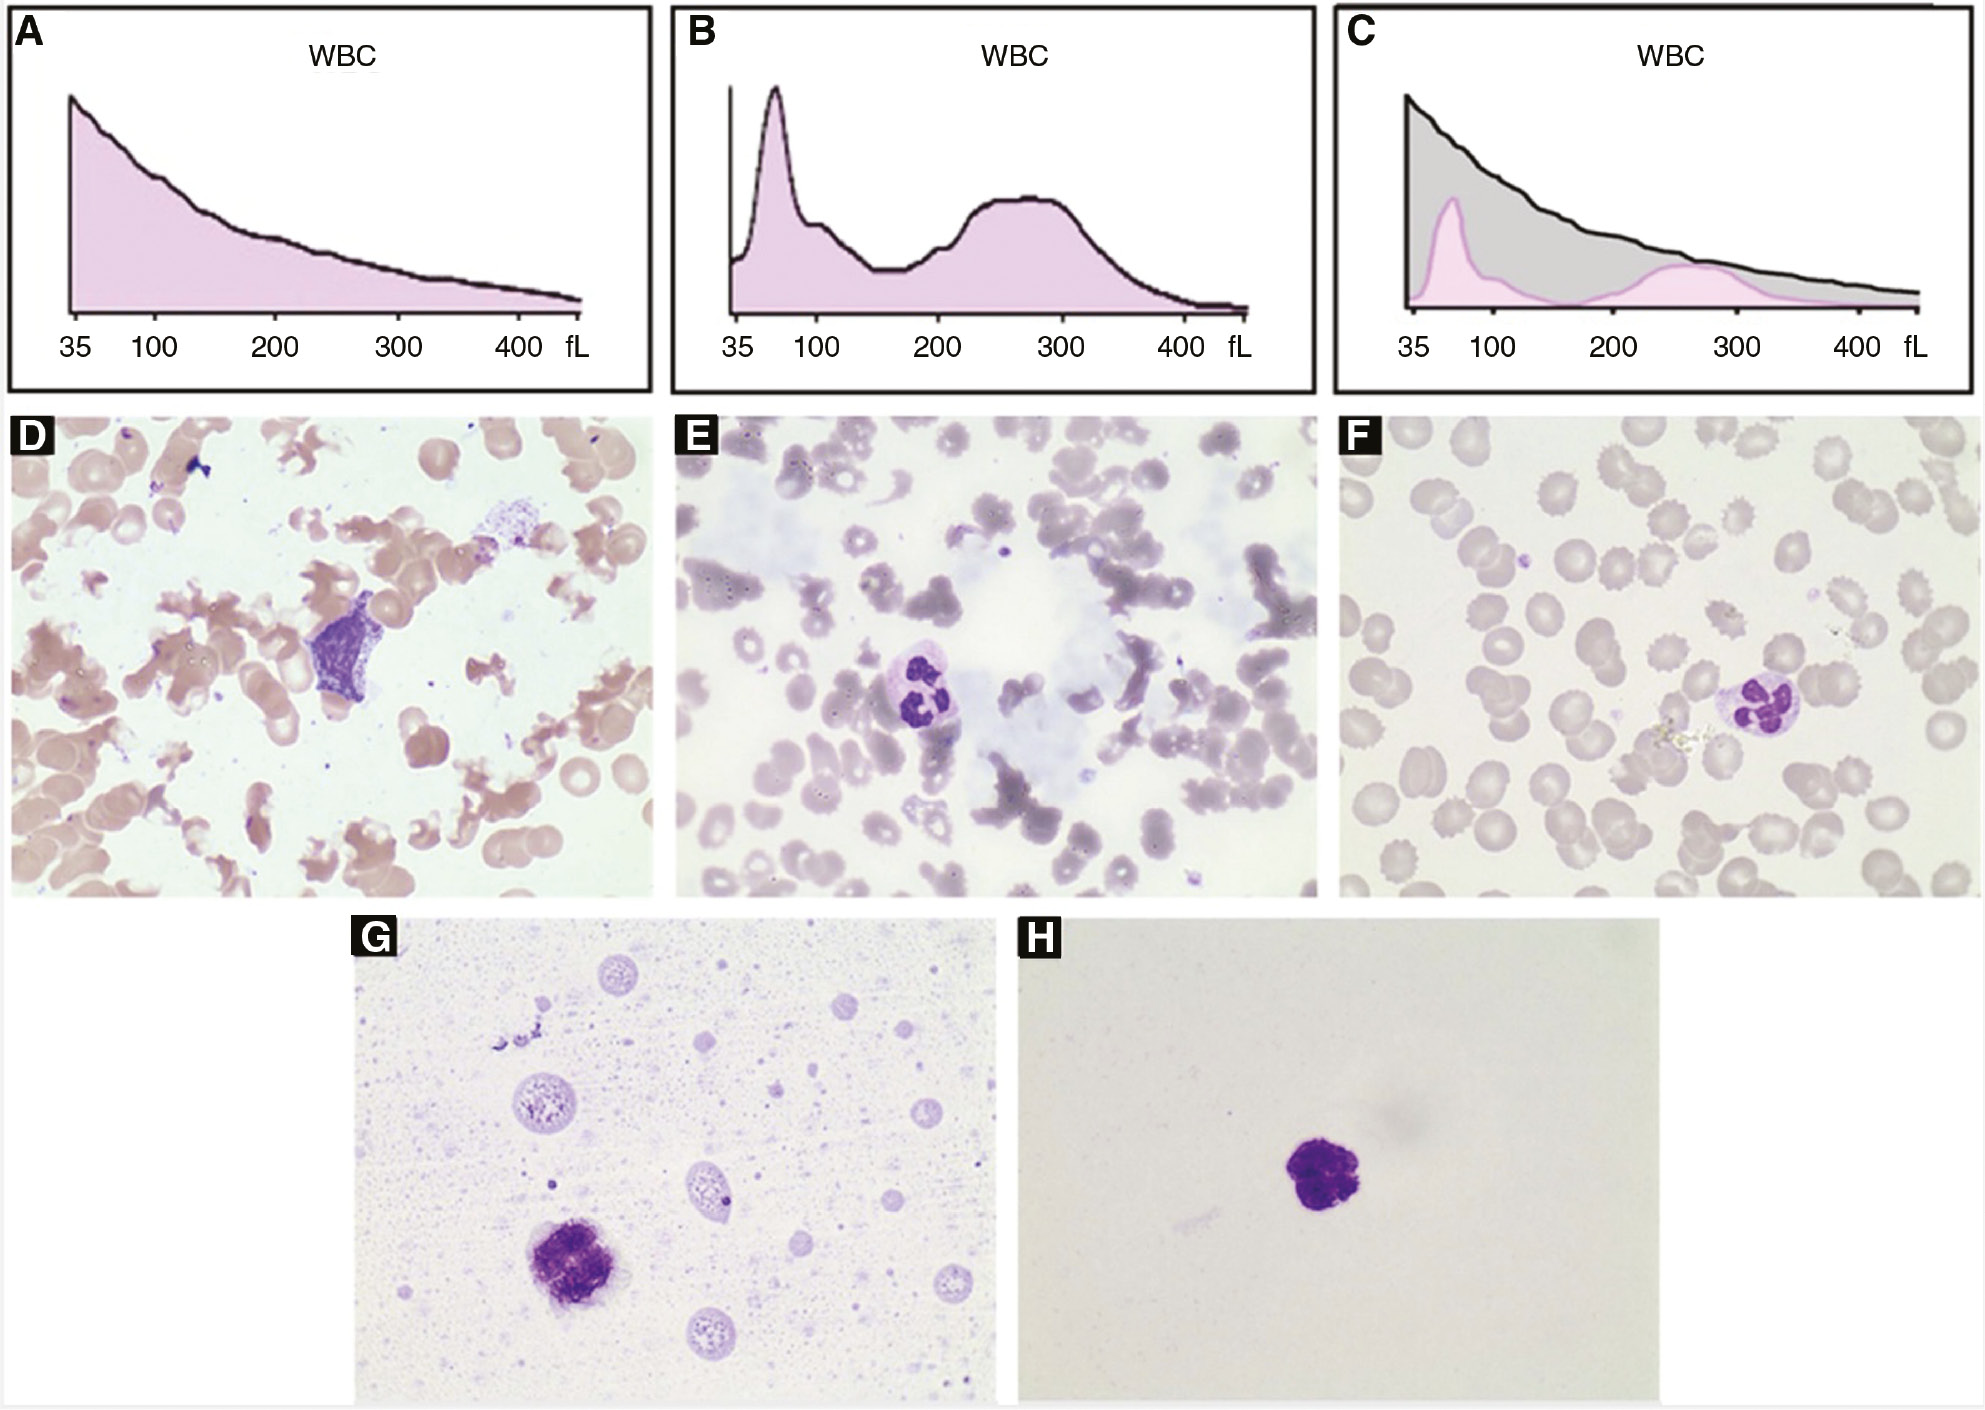
WBC histograms and peripheral blood smears of the patient’s sample.
(A–C) WBC histograms. (A) At room temperature. (B) 37°C for 30 min. (C) The merged image. (D–H) Blood smear (Wright-Giemsa stain; ×1000). (D) Prepared by the Coulter DxH Slidemaker Stainer at room temperature. (E) Prepared manually at room temperature. (F) Prepared manually after the blood was heated to 37°C for 30 min. (G) and (H) The additional experiment. (G) This case. (H) Normal control.
Cryoglobulinemia is defined as the persistent presence of cryoglobulins in serum. The presence of cryoglobulin can lead to erroneous WBC counts and PLT counts in many instances [1], [2], [3], [4], [5]. As listed in Table 1, the influence of cryoglobulin on CBC is pseudoleucocytosis and pseudothrombocytosis. Only a few cases were pseudothrombocytosis, while most cases were pseudoleucocytosis. The highest fold recorded for pseudoleucocytosis was reported by Geara et al. [2], which was 8.0. Therefore, to the best of our knowledge, the pseudoleucocytosis of this case is the most prominent with an 18-fold difference. CBC detection mechanism of Coulter series counters is the electrical impedance method. The increased resistances are sensed by the instrument when cells of various sizes flow through an aperture where there is an electrical current. We analyzed the possible reasons for the 18-fold increase in WBC count. Firstly, IgM was 2.86 g/L, just slightly higher than 2.30 g/L. In the WBC channel of Coulter, the whole blood is 1:251 diluted, which means the cryoglobulin concentration will become much lower. Therefore, cryoglobulin itself unlikely causes such a remarkable pseudoleucocytosis. Secondly, the Coulter alarm indicated the presence of NRBCs (not “RBC fragments”). Under microscope, however, no NRBC was observed and the RBCs were surrounded by cryoglobulin. Therefore, the speculation of pseudoleucocytosis is as follows: RBCs and IgM-kappa cryoglobulin form lump-like RBC/cryoglobulin complexes. When the blood goes through the WBC channel, lump-like RBC/cryoglobulin complexes are degraded by lysis solution into fragmented RBC/cryoglobulin complexes of different sizes. As a consequence, these fragmented complexes derived from 1012-magnitude RBCs produce such a remarkable spurious increase in the WBC count. These fragmented complexes also lead to the specific histogram in Figure 1A, which overlaps the normal histogram of WBCs (Figure 1C is the merged image). And those fragmented complexes with size near to NRBC are recognized as NRBCs. This speculation later is confirmed by an additional experiment. We mimicked the mixture in the WBC channel according to the manufacturer’s instruction (6 mL dilution solution, 28 μL whole blood, and 1.08 mL lysis solution), centrifuged the mixture at 500 g for 5 min, and prepared a smear using the cellular layer. A lot of fragmented RBC/cryoglobulin complexes can be found (Figure 1G).
Influence of cryoglobulin on the CBC test by different hematology analyzers.
| Publications | Analyzer | WBC count, ×109/L |
PLT count, ×109/L |
||||
|---|---|---|---|---|---|---|---|
| RT | 37°C | Folds (=RT/37°C) | RT | 37°C | Folds (=RT/37°C) | ||
| Fohlen-Walter et al. [1] | Bayer Technicon H*2 | 14.94 | 4.30 | 3.5 | 213 | 234 | 0.9 |
| Bayer Technicon H*2 | 12.61 | 11.51 | 1.1 | 906 | 112 | 8.1 | |
| Bayer Technicon H*2 | 3.08 | 3.02 | 1.0 | 173 | 112 | 1.5 | |
| Bayer Technicon H*2 | 7.77 | 6.23 | 1.2 | 272 | 269 | 1.0 | |
| Coulter STKS | 9.3 | 4.4 | 2.1 | 213 | 204 | 1.0 | |
| Coulter STKS | 15.3 | 10.9 | 1.4 | 128 | 85 | 1.5 | |
| Coulter STKS | 5.4 | 2.8 | 1.9 | 106 | 99 | 1.1 | |
| Geara et al. [2] | Coulter GenS | 96 | 12 | 8.0 | No | No | |
| Abela et al. [3] | No | 54.0 | 8.4 | 6.4 | No | No | |
| Haeney et al. [4] | Model S Coulter Counter | 11.5 | 6.3 | 1.8 | No | No | |
| Model S Coulter Counter | 14.9 | 9.5 | 1.6 | No | No | ||
| Taft et al. [5] | Model S Coulter Counter | 7.6 | 5.0 | 1.5 | No | No | |
| This case | Coulter DxH800 | 122.83 | 6.80 | 18.1 | 191 | 166 | 1.2 |
No, not done or not mentioned; RT, room temperature; 37°C, after 30 min at 37°C.
Moreover, no cryoglobulin can be seen on the slide prepared by the Coulter DxH Slidemaker Stainer, which is due to a two-step heating process of the instrument settings. Therefore, we recommend manual preparation or automatic slide maker without the heating step to find clues of cryoglobulin on peripheral smears.
All the experiments were conducted after the protocol was approved by the Ethics Committee of the First Affiliated Hospital of Nanjing Medical University. Written informed consent for the use of the clinical samples was obtained from the patient.
Author contributions: All the authors have accepted responsibility for the entire content of this submitted manuscript and approved submission.
Research funding: None declared.
Employment or leadership: None declared.
Honorarium: None declared.
Competing interests: The funding organization(s) played no role in the study design; in the collection, analysis, and interpretation of data; in the writing of the report; or in the decision to submit the report for publication.
References
1. Fohlen-Walter A, Jacob C, Lecompte T, Lesesve JF. Laboratory identification of cryoglobulinemia from automated blood cell counts, fresh blood samples, and blood films. Am J Clin Pathol 2002;117:606–14.10.1309/QXPP-DC4X-N3Q8-KW62Search in Google Scholar PubMed
2. Geara A, El-Imad B, Baz W, Odaimi M, El-Sayegh S. Pseudoleukocytosis secondary to hepatitis c-associated cryoglobulinemia: a case report. J Med Case Rep 2009;3:91.10.1186/1752-1947-3-91Search in Google Scholar PubMed PubMed Central
3. Abela M, McArdle B, Qureshi M. Pseudoleucocytosis due to cryoglobulinaemia. J Clin Pathol 1980;33:796.10.1136/jcp.33.8.796Search in Google Scholar PubMed PubMed Central
4. Haeney MR. Erroneous values for the total white cell count and ESR in patients with cryoglobulinaemia. J Clin Pathol 1976;29:894–7.10.1136/jcp.29.10.894Search in Google Scholar PubMed PubMed Central
5. Taft EG, Grossman J, Abraham GN, Leddy JP, Lichtman MA. Pseudoleukocytosis due to cryoprotein crystals. Am J Clin Pathol 1973;60:669–71.10.1093/ajcp/60.5.669Search in Google Scholar PubMed
©2020 Hong Wang et al., published by De Gruyter, Berlin/Boston
This work is licensed under the Creative Commons Attribution 4.0 International License.
Articles in the same Issue
- Frontmatter
- Editorial
- Biotin interference in cardiac troponin immunoassay – where the wild things are?
- Review
- Laboratory-related issues in the measurement of cardiac troponins with highly sensitive assays
- Mini Review
- Chromatographic methods development for clinical practice: requirements and limitations
- Opinion Paper
- Harmonising EQA schemes the next frontier: challenging the status quo
- Genetics and Molecular Diagnostics
- Direct comparison study between droplet digital PCR and a combination of allele-specific PCR, asymmetric rapid PCR and melting curve analysis for the detection of BRAF V600E mutation in plasma from melanoma patients
- A novel mitochondrial m.14430A>G (MT-ND6, p.W82R) variant causes complex I deficiency and mitochondrial Leigh syndrome
- Obesity status modifies the association between rs7556897T>C in the intergenic region SLC19A3-CCL20 and blood pressure in French children
- General Clinical Chemistry and Laboratory Medicine
- Influence of reagent lots and multiple measuring systems on estimating the coefficient of variation from quality control data; implications for uncertainty estimation and interpretation of QC results
- Electrophoretic α1-globulin for screening of α1-antitrypsin deficient variants
- A continued method performance monitoring approach for the determination of pediatric renin samples – application within a European clinical trial
- Pilot study for cystic fibrosis neonatal screening: the Cuban experience
- Validation of the analytical performance of the NOVEOS™ System, a system which improves upon the third-generation in vitro allergy testing technology
- IgE cross-reactivity measurement of cashew nut, hazelnut and peanut using a novel IMMULITE inhibition method
- Sexual dimorphism in the cerebrospinal fluid total protein content
- Current state of the morphological assessment of urinary erythrocytes in The Netherlands: a nation-wide questionnaire
- Reference Values and Biological Variations
- Within-subject and between-subject biological variation of first morning void urine amino acids in 12 healthy subjects
- Proenkephalin as a new biomarker for pediatric acute kidney injury – reference values and performance in children under one year of age
- Hematology and Coagulation
- Quality performance for indirect Xa inhibitor monitoring in patients using international external quality data
- Cardiovascular Diseases
- Clinical risk assessment of biotin interference with a high-sensitivity cardiac troponin T assay
- Short- and long-term biological variation of cardiac troponin I in healthy individuals, and patients with end-stage renal failure requiring haemodialysis or cardiomyopathy
- Infectious Diseases
- Monocyte distribution width (MDW) as a screening tool for sepsis in the Emergency Department
- Performance of a Toxo IgM prototype assay for the diagnosis of maternal and congenital Toxoplasma infections
- Letters to the Editors
- Evaluation of an ELISA for SARS-CoV-2 antibody testing: clinical performances and correlation with plaque reduction neutralization titer
- Preliminary evaluation of Roche Cobas Elecsys Anti-SARS-CoV-2 chemiluminescence immunoassay
- Hypoalbuminemia and elevated D-dimer in COVID-19 patients: a call for result harmonization
- Total pathway to method validation
- Derivation of performance specifications for uncertainty of serum C-reactive protein measurement according to the Milan model 3 (state of the art)
- FGF23 measurement in burosumab-treated patients: an emerging treatment may induce a new analytical interference
- Use of a modified IDS-ISYS intact PTH assay for intraoperative PTH measurements
- Agreement of dried blood spot lyso-Gb3 concentrations obtained from different laboratories in patients with Fabry disease
- Influence of delayed separation of plasma from whole blood and centrifugation protocol on Zn plasma concentration
- A survey of order of draw on inpatient wards and adherence to EFLM-COLABIOCLI recommendations
- Successful implementations of automated minimum re-test intervals to overcome ferritin over-requesting in a Spanish hospital laboratory
- Remarkable pseudoleucocytosis induced by mild cryoglobulinemia
- Massive hemolysis due to Clostridium perfringens: a laboratory’s perspective