Within-subject and between-subject biological variation estimates of 21 hematological parameters in 30 healthy subjects
-
Abdurrahman Coşkun
 ,
Anna Carobene
,
Anna Carobene

Abstract
Background:
The complete blood count (CBC) is used to evaluate health status in the contexts of various clinical situations such as anemia, infection, inflammation, trauma, malignancies, etc. To ensure safe clinical application of the CBC, reliable biological variation (BV) data are required. The study aim was to define the BVs of CBC parameters employing a strict protocol.
Methods:
Blood samples, drawn from 30 healthy subjects (17 females, 13 males) once weekly for 10 weeks, were analyzed using a Sysmex XN 3000 instrument. The data were assessed for normality, trends, outliers and variance homogeneity prior to coefficient of variation (CV)-analysis of variance (ANOVA). Sex-stratified within-subject (CVI) and between-subjects (CVG) BV estimates were determined for 21 CBC parameters.
Results:
For leukocyte parameters, with the exception of lymphocytes and basophils, significant differences were found between female/male CVI estimates. The mean values of all erythrocyte-, reticulocyte- and platelet parameters differed significantly between the sexes, except for mean corpuscular hemoglobin concentration, mean corpuscular volume and platelet numbers. Most CVI and CVG estimates appear to be lower than those previously published.
Conclusions:
Our study, based on a rigorous protocol, provides updated and more stringent BV estimates for CBC parameters. Sex stratification of data is necessary when exploring the significance of changes in consecutive results and when setting analytical performance specifications.
Abbreviations:ALT, Alanine aminotransferase; APS, Analytical performance specification; BD, Becton Dickinson; BIVAC, Biological Variation Data Critical Appraisal Checklist; BV, Biological variation; CBC, Complete blood count; CI, Confidence interval; CK, Creatinine kinase; CRP, C-reactive protein; CV, Coefficient of variation; CVA, Analytical variation; CVG, Between-subject biological variation; CVI, Within-subject biological variation; EFLM, European Federation of Clinical Chemistry and Laboratory Medicine; EuBIVAS, European Biological Variation Study; Hgb, Hemoglobin; Htc, Hematocrit; IFCC, International Federation of Clinical Chemistry and Laboratory Medicine; II, Index of individuality; LOQ, Limit of quantification; MCH, Mean corpuscular hemoglobin; MCHC, Mean corpuscular hemoglobin concentration; MCV, Mean corpuscular volume; MPV, Mean platelet volume; NHSP, Numbers of samples required to estimate the homeostatic set points; PDW, Platelet distribution wide; P-LCR, Platelet larger cell ratio; PLT-I, Platelets – impedance; RBC, Red blood cells; RBC-He, Red blood cell hemoglobin equivalent; RCV, Reference change value; RDW, Red cell distribution wide; RDW-SD, Red cell distribution wide standard deviation; RET, Reticulocyte; RET-He, Reticulocyte hemoglobin equivalent; RI, Reference intervals; SD, Standard deviation.
Introduction
A complete (or full) blood count (CBC) is frequently requested in clinical practice and is particularly important for the diagnosis and monitoring of various clinical situations such as anemia, infection, malignancies, trauma, bleeding disorders, etc. A recent study [1] found that counting of leukocytes and measurement of hemoglobin (Hgb) were amongst the most informative of laboratory data, particularly in emergency departments. Widespread application of the CBC is associated with a requirement for objective analytical performance specifications (APSs) and an understanding of biological variation (BV), to enable safe and valid clinical interpretation of CBC components.
The first European Federation of Clinical Chemistry and Laboratory Medicine (EFLM) Strategic Conference updated the hierarchy of models used to establish APSs as [2]:
Model 1. The effect of analytical performance on clinical outcomes;
Model 2. The BV of the measurand;
Model 3. State-of-the-art analytical performance of the measurement.
It has been proposed that the APSs for Hb, platelets and neutrophil measurands of the CBC should be based on clinical outcomes (Model 1) [3]. However, no reliable clinical outcomes are yet available. Model 2 offers an alternative approach for the establishment of APSs and also provides the opportunity to use BV data for many other clinical applications.
Concerns have been raised around the quality of earlier BV studies [4, 5] and, consequently, the robustness of BV estimates collated and made available online in the online 2014 BV database [6]. Additionally, data is lacking for some CBC parameters and the data are not stratified according to sex. Some hematological measurands differ between females and males and the lack of sex-stratification may conceal requirements for more stringent APSs and other indices derivable from BV data (e.g. reference change values [RCVs]).
To address concerns about quality issues associated with acquisition of BV data, the EFLM Biological Variation Working Group initiated the European Biological Variation Study (EuBIVAS); this is a multicenter study based in six European countries that collects samples employing a common stringent protocol [7]. The study has delivered updated BV estimates for several measurands [8, 9], and those for others are in preparation. Additionally, the EFLM BV Task and Finish group developed the Biological Variation Critical Appraisal Checklist (BIVAC) for critical appraisal and meta-analysis of published BV data [10].
The analytical approach used by EuBIVAS is valid for measurands that are stable in samples stored for batched analysis. This is not possible for the measurands of CBC, given the requirement for fresh whole blood. The aim of our study was to deliver BV estimates for 21 CBC parameters based on the collection of fresh blood samples. While the analytical approach necessarily varies from that employed within EuBIVAS, all other elements of that study apply. This indicates that our study has followed rigid pre-analytical and analytical protocols and applied a rigorous statistical approach in line with the EFLM checklist [11] and the EuBIVAS protocol [7] to assure the derivation of the highest-quality BV estimates for the calculation of APSs, and other BV-related applications.
Materials and methods
Study population and protocol
The study was conducted at Acibadem Mehmet Ali Aydınlar University and the Acibadem Labmed Clinical Laboratories, Istanbul, Turkey. The initially enrolled population consisted of 36 apparently healthy Europid subjects (22 females and 14 males) recruited from laboratory workers, university students and university staff. The study protocol was approved by the Ethics Committee of Acibadem Mehmet Ali Aydınlar University and carried out in accordance with the Declaration of Helsinki. All subjects provided written informed consent prior to the study procedure.
The EuBIVAS protocol was used to design the study, to evaluate health status, and to define the inclusion/exclusion criteria [7].
All subjects completed questionnaires exploring health status and lifestyle [7]. In the first week evaluation, subjects whose Hgb levels <120 g/L and body mass index (BMI) >30 kg/m2 were excluded. A subject who has BMI between 30.00 and 34.99 kg/m2 is accepted as Class I Obese and have risk for type 2 diabetes, hypertension, and cardiovascular disease. Further exclusion criteria were verified by laboratory tests (alanine aminotransferase [ALT], creatine kinase [CK], triglycerides, and C-reactive protein [CRP]) measured in serum samples from weeks 1 to 10. We followed-up the health status of all enrolled subjects, as previously described [7].
Sample collection and handling
Although samples for CBC parameters are collected from both fasted and non-fasted patients, recently the effect of non-fasting samples on CBC parameters measurements have been criticized [12, 13]. We collected fasting blood samples to avoid such preanalytical variations. Samples were drawn from all subjects once weekly for 10 consecutive weeks from February to May 2016. Samples were collected on defined days (Tuesday–Thursday) at the same time (8.30–10.30 a.m.). Most samples were drawn by the same phlebotomists.
Blood samples were collected from the antecubital vein using 21-gauge needles (Becton Dickinson [BD] Vacutainer Precision glide, Plymouth, UK) into blood tubes containing K2EDTA (BD Plus-Plastic Tubes). All samples were analyzed within 1 h (at a room temperature controlled at 23±2 °C).
Blood samples for clinical chemistry analyses were drawn into tubes containing gel separators and no additives (BD Vacutainer SSTII Advance Tubes).
Analytical measurements
All samples were analyzed in duplicate using the same module (L) of Sysmex XN 3000 instrument (Sysmex Co., Kobe, Japan). Twenty-one CBC parameters were analyzed, of which 19 are employed in routine practice (the exceptions are red blood cell [RBC] hemoglobin equivalent and reticulocyte hemoglobin equivalent [Ret-He]). The measurement methods are described in Supplementary Data. The same lots of reagents and consumables were used and there was no drift of internal quality control over the course of the entire study period.
Erythrocyte- and reticulocyte-related parameters: within-subject (CVI) and between-subject (CVG) biological variation estimates±95% CIs, mean concentrations, the associated estimates of analytical variation (CVA), the total number of subjects, the average number of samples and replicates per subject included in the calculations.
| Measurand | Sex | Number of subjects | Total number of results | Mean number of samples/subject | Mean number of replicates/subject | Mean | CVA (%) | CVI (%) | CVG (%) | Online 2014 BV databasea | |
|---|---|---|---|---|---|---|---|---|---|---|---|
| CVI, % | CVG, % | ||||||||||
| Erythrocyte, ×1012/L | F | 17 | 337 | 9.94 | 1.99 | 4.60 (4.56–4.64) | 0.66 (0.61–0.72) | 2.77 (2.55–3.04) | 6.98 (5.15–10.65) | 3.2 | 6.3 |
| M | 13 | 250 | 9.62 | 2.00 | 5.53 (5.48–5.58) | 5.58 (4.01–9.40) | |||||
| Hgb, g/L | F | 17 | 336 | 9.88 | 2.00 | 129.7 (128.6–130.8) | 0.58 (0.53–0.63) | 2.74 (2.52–3.00) | 6.57 (4.83–10.01) | 2.85 | 6.8 |
| M | 13 | 250 | 9.62 | 2.00 | 160.3 (158.8–161.7) | 5.81 (4.08–9.57) | |||||
| Htc, % | F | 17 | 336 | 9.88 | 2.00 | 40.2 (39.9–40.5) | 0.63 (0.59–0.69) | 2.82 (2.59–3.09) | 5.51 (4.03–8.41) | 2.7 | 6.41 |
| M | 13 | 248 | 9.54 | 2.00 | 48.1 (47.7–48.5) | 5.46 (3.87–9.07) | |||||
| MCH, pg | F | 17 | 340 | 10.0 | 2.00 | 28.3 (28.1–28.5) | 0.78 (0.73–0.85) | 0.75 (0.65–0.86) | 6.11 (4.55–9.31) | 1.4 | 5.2 |
| M | 13 | 252 | 9.69 | 2.00 | 29.0 (28.9–29.1) | 2.9 (2.22–5.15) | |||||
| MCHC, g/L | F | 17 | 340 | 10.0 | 2.00 | 327.1 (326.3–328.0) | 0.79 (0.73–0.86) | 0.97 (0.87–1.09) | 1.59 (1.13–2.69) | 1.06 | 1.2 |
| M | 13 | 252 | 9.69 | 2.00 | |||||||
| MCV, fL | F | 17 | 338 | 9.94 | 2.00 | 87.32 (87.00–87.64) | 0.18 (0.16–0.19) | 0.72 (0.66–0.79) | 3.96 (3.15–5.33) | 1.4 | 4.85 |
| M | 13 | 252 | 9.69 | 2.00 | |||||||
| RDW-SD, fL | F | 17 | 334 | 9.82 | 2.00 | 41.5 (41.1–41.9) | 0.57 (0.53–0.62) | 1.65 (1.51–1.81) | 7.62 (5.75–11.80) | 3.5 | 5.7 |
| M | 13 | 250 | 9.62 | 2.00 | 39.3 (39.1–39.4) | 2.20 (1.52–3.68) | |||||
| RBC-He, pg | F | 17 | 336 | 9.88 | 2.00 | 29.8 (29.6–30.0) | 0.65 (0.60–0.70) | 2.65 (2.44–2.91) | 5.95 (4.37–9.07) | NA | NA |
| M | 13 | 252 | 9.69 | 2.00 | 30.5 (30.4–30.7) | 2.34 (1.63–4.17) | |||||
| Reticulocyt, ×109/L | F | 17 | 339 | 10.0 | 1.99 | 54.3 (52.5–56.2) | 4.45 (4.12–4.84) | 10.83 (9.90–11.92) | 25.77 (19.17–39.73) | 11.0 | 29.0 |
| M | 13 | 252 | 9.69 | 2.00 | 75.2 (72.9–77.5) | 18.89 (13.35–31.57) | |||||
| RET-He, pg | F | 17 | 332 | 9.76 | 2.00 | 32.4 (32.1–32.7) | 0.79 (0.73–0.86) | 3.40 (3.12–3.73) | 6.59 (4.80–10.03) | NA | NA |
| M | 13 | 252 | 9.69 | 2.00 | 34.0 (33.8–34.2) | 2.72 (1.84–4.79) | |||||
aData obtained from online 2014 BV database, common estimate for both females and males [6]. F, females; M, males; NA, not available; Hgb, hemoglobin; Htc, hematocrit; MCH, mean corpuscular hemoglobin; MCHC, mean corpuscular hemoglobin concentration; MCV, mean corpuscular volume; RDW-SD, red cell distribution wide standard deviation; RBC-He, red blood cell hemoglobin equivalent; RET-He, reticulocyte hemoglobin equivalent. Numbers in bold indicate CVGs used to calculate the analytical performance specification (APS).
ALT activity (modified International Federation of Clinical Chemistry and Laboratory Medicine [IFCC] method [pyridoxal-5-P]) and triglyceride levels (enzymatic method) were measured using a Dimension XPAND EXL (Siemens Healthineers, Tarrytown, NY, USA), whereas the CK activity (NAC Activated, IFCC) and the CRP level (turbidimetric immunoassay) were measured with the aid of Advia 1900 autoanalyzer (Siemens Healthineers, Tarrytown, NY, USA).
Statistical analysis
The statistical methods are described in detail in our previous publications [8, 9]. Briefly, we proceeded as follows:
Prior to analysis, outliers were identified and removed. The homogeneities of within-subject and analytical variabilities (between replicates) were verified using the Bartlett and Cochran tests, respectively [14, 15]. In cases of heterogeneity, outlier data were excluded until homogeneity was attained. The Shapiro-Wilk test [16] was used to check the normality of between- and within-subject data. If the data were not normally distributed, they were log-transformed prior to re-evaluation of normality.
The Dixon-Reed criterion [17] was used to detect outliers. To verify that all subjects were in the steady-state, we performed linear regression on the median group value over the whole study period for each measurand; larger individual systematic changes were identified by the within-subject BV (CVI) homogeneity test (the Cochran test).
Finally, data analysis was performed using coefficient of variation (CV)-analysis of variance (ANOVA), an ANOVA method in which data are first transformed via a CV-transformation [18]; all female and male data were analyzed separately.
The differences between females and males CVI and between-subject BV (CVG) estimates were determined by considering the overlap of the 95% confidence intervals (CIs), calculated as described by Burdick and Graybill [19]. When the 95% CIs of the mean values of females and males did not overlap, the lower of the two CVG estimates was used to calculate the APS. When no significant difference between female and male BV data was apparent, CVI and CVG were reported for all subjects and these estimates used in the application of the BV data.
Analytical performance specifications and other applications
CVI and CVG data were used to calculate the desirable APSs for imprecision (CVAPS) and the bias (BiasAPS), the index of individuality (II), the RCV, and the numbers of samples required to estimate the homeostatic set points (NHSPs), using the equations given below, with CVA denoting analytical variation [20]:
where D is the allowed percentage deviation from the true homeostatic set point, and Z is 1.96 (for a p-value <0.05). We calculated NHSPs associated with 5%, 10%, and 20% deviations from the true homeostatic set points.
Results
After initial evaluation in terms of the inclusion/exclusion criteria for the results from the first sample set, five females with Hgb levels <120 g/L and one male with a BMI >30 kg/m2 were excluded. Thus, 30 of the 36 recruited subjects (17 females and 13 males) were included in the study, of whom 29 completed all 10 scheduled collections and one subject six collections. The mean ages of the females and males were 28 (range, 19–46) and 25 (range, 20–36) years, respectively.
One subject was excluded from the basophil dataset because the measurements were lower than the limit of quantification, as also suggested by homogeneity variance testing. In total, 3.9% of obtained data were excluded from final analysis. All subjects were considered to be in steady-state during the study.
With the exception of the mean corpuscular hemoglobin concentration and mean corpuscular volume (MCV), the mean values of all erythrocyte and reticulocyte parameters in females and males differed significantly, rendering partitioning of the CVG data between the sexes necessary to derive sex-stratified estimates. However, there were no significant differences in CVI estimates between females and males (Table 1).
For leukocyte- and platelet-related parameters, the mean values of all parameters except those of leukocytes, eosinophils, basophils and platelets differed significantly between females and males (Table 2). Significant differences in the CVI estimates for leukocytes, monocytes, neutrophils and eosinophils were also evident (Table 2), as indicated for leukocytes in Figure 1.
Leukocyte- and platelet-related parameters: within-subject (CVI) and between-subject (CVG) biological variation estimates±95% CIs, mean concentrations, the associated estimates of analytical variation (CVA), the total number of subjects, the average number of samples and replicates per subject included in the calculations.
| Measurand | Sex | Number of subjects | Total number of results | Mean number of samples/subject | Mean number of replicates/subject | Mean | CVA (%) | CVI (%) | CVG (%) | Online 2014 databasea | |
|---|---|---|---|---|---|---|---|---|---|---|---|
| CVI, % | CVG, % | ||||||||||
| Leukocytes, ×109/L | F | 17 | 334 | 9.82 | 2.00 | 6.57 (6.45–6.68) | 1.49 (1.38–1.62) | 12.82 (11.51–14.46) | 16.53 (12.83–22.08) | 11.4 | 21.3 |
| M | 13 | 246 | 9.46 | 2.00 | 7.96 (7.02–9.19) | ||||||
| Lymphocytes, ×109/L | F | 17 | 338 | 9.94 | 2.00 | 2.11 (2.05–2.16) | 2.40 (2.21–2.61) | 9.81 (9.00–10.77) | 20.36 (15.17–31.62) | 10.2 | 35.3 |
| M | 13 | 238 | 9.15 | 2.00 | 2.25 (2.17–2.33) | 23.66 (17.1–39.9) | |||||
| Monocytes, ×109/L | F | 17 | 334 | 9.82 | 2.00 | 0.48 (0.46–0.50) | 4.95 (4.58–5.39) | 15.33 (13.68–17.40) | 29.78 (22.53–46.92) | 17.8 | 49.8 |
| M | 13 | 250 | 9.62 | 2.00 | 0.56 (0.55–0.58) | 11.07 (9.67–12.88) | 17.01 (12.34–29.47) | ||||
| Neutrophils, ×109/L | F | 17 | 336 | 9.88 | 2.00 | 3.92 (3.75–4.08) | 1.88 (1.74–2.05) | 20.09 (18.05–22.65) | 27.81 (20.17–42.79) | 17.1 | 32.8 |
| M | 13 | 236 | 9.08 | 2.00 | 3.40 (3.30–3.50) | 11.60 (10.20–13.44) | 16.68 (11.80–28.39) | ||||
| Eosinophils, ×109/L | F | 17 | 267 | 7.88 | 1.99 | 0.12 (0.11–0.13) | 11.01 (10.07–12.13) | 14.83 (12.42–17.62) | 70.5 (59.4–100.6) | 21.0 | 76.4 |
| M | 13 | 212 | 8.38 | 1.89 | 10.11 (7.77–12.26) | ||||||
| Basophils, ×109/L | All | 29 | 480 | 8.79 | 1.79 | 0.04 (0.04–0.04) | 16.65 (15.24–18.35) | 11.36 (7.66–13.24) | 22.10 (16.82–29.93) | 28.0 | 54.8 |
| PLT-I, ×109/L | F | 17 | 336 | 9.88 | 2.00 | 252.8 (249.1–256.5) | 1.80 (1.67–1.96) | 7.22 (6.63–7.91) | 17.42 (12.90–26.71) | 9.1 | 21.9 |
| M | 13 | 250 | 9.62 | 2.00 | 7.23 (4.93–12.42) | ||||||
| PDW, fL | F | 17 | 336 | 9.88 | 2.00 | 12.70 (12.45–12.95) | 3.28 (3.04–3.57) | 3.69 (3.25–4.17) | 15.86 (11.89–24.42) | 2.8 | NA |
| M | 13 | 252 | 9.69 | 2.00 | 11.73 (11.5–11.9) | 10.33 (7.22–16.89) | |||||
| Plateletcrit, % | F | 17 | 336 | 9.88 | 2.00 | 0.27 (0.27–0.28) | 2.57 (2.38–2.80) | 6.45 (5.90–7.11) | 15.72 (11.58–24.01) | 11.9 | NA |
| M | 13 | 250 | 9.62 | 2.00 | 0.25 (0.25–0.26) | 9.96 (6.95–16.63) | |||||
| MPV, fL | F | 17 | 339 | 10.0 | 1.99 | 10.70 (10.59–10.81) | 1.13 (1.04–1.23) | 2.24 (2.04–2.48) | 8.46 (6.29–12.91) | 4.3 | 8.1 |
| M | 13 | 250 | 9.62 | 2.00 | 10.09 (10.00–10.18) | 5.73 (3.99–9.33) | |||||
| P-LCR, % | F | 17 | 338 | 9.94 | 2.00 | 30.59 (29.67–31.51) | 2.83 (2.62–3.08) | 6.60 (6.03–7.27) | 24.42 (18.14–37.24) | NA | NA |
| M | 13 | 250 | 9.62 | 2.00 | 25.95 (25.23–26.67) | 18.40 (12.84–30.03) | |||||
aData obtained from online 2014 BV database, common estimate for both females and males [6]. F, females; M, males; NA, not available; PLT-I, platelets – impedance; PDW, platelet distribution wide; MPV, mean platelet volume; P-LCR, platelet larger cell ratio. Numbers in bold indicate CVGs used to calculate the analytical performance spesifications (APS).
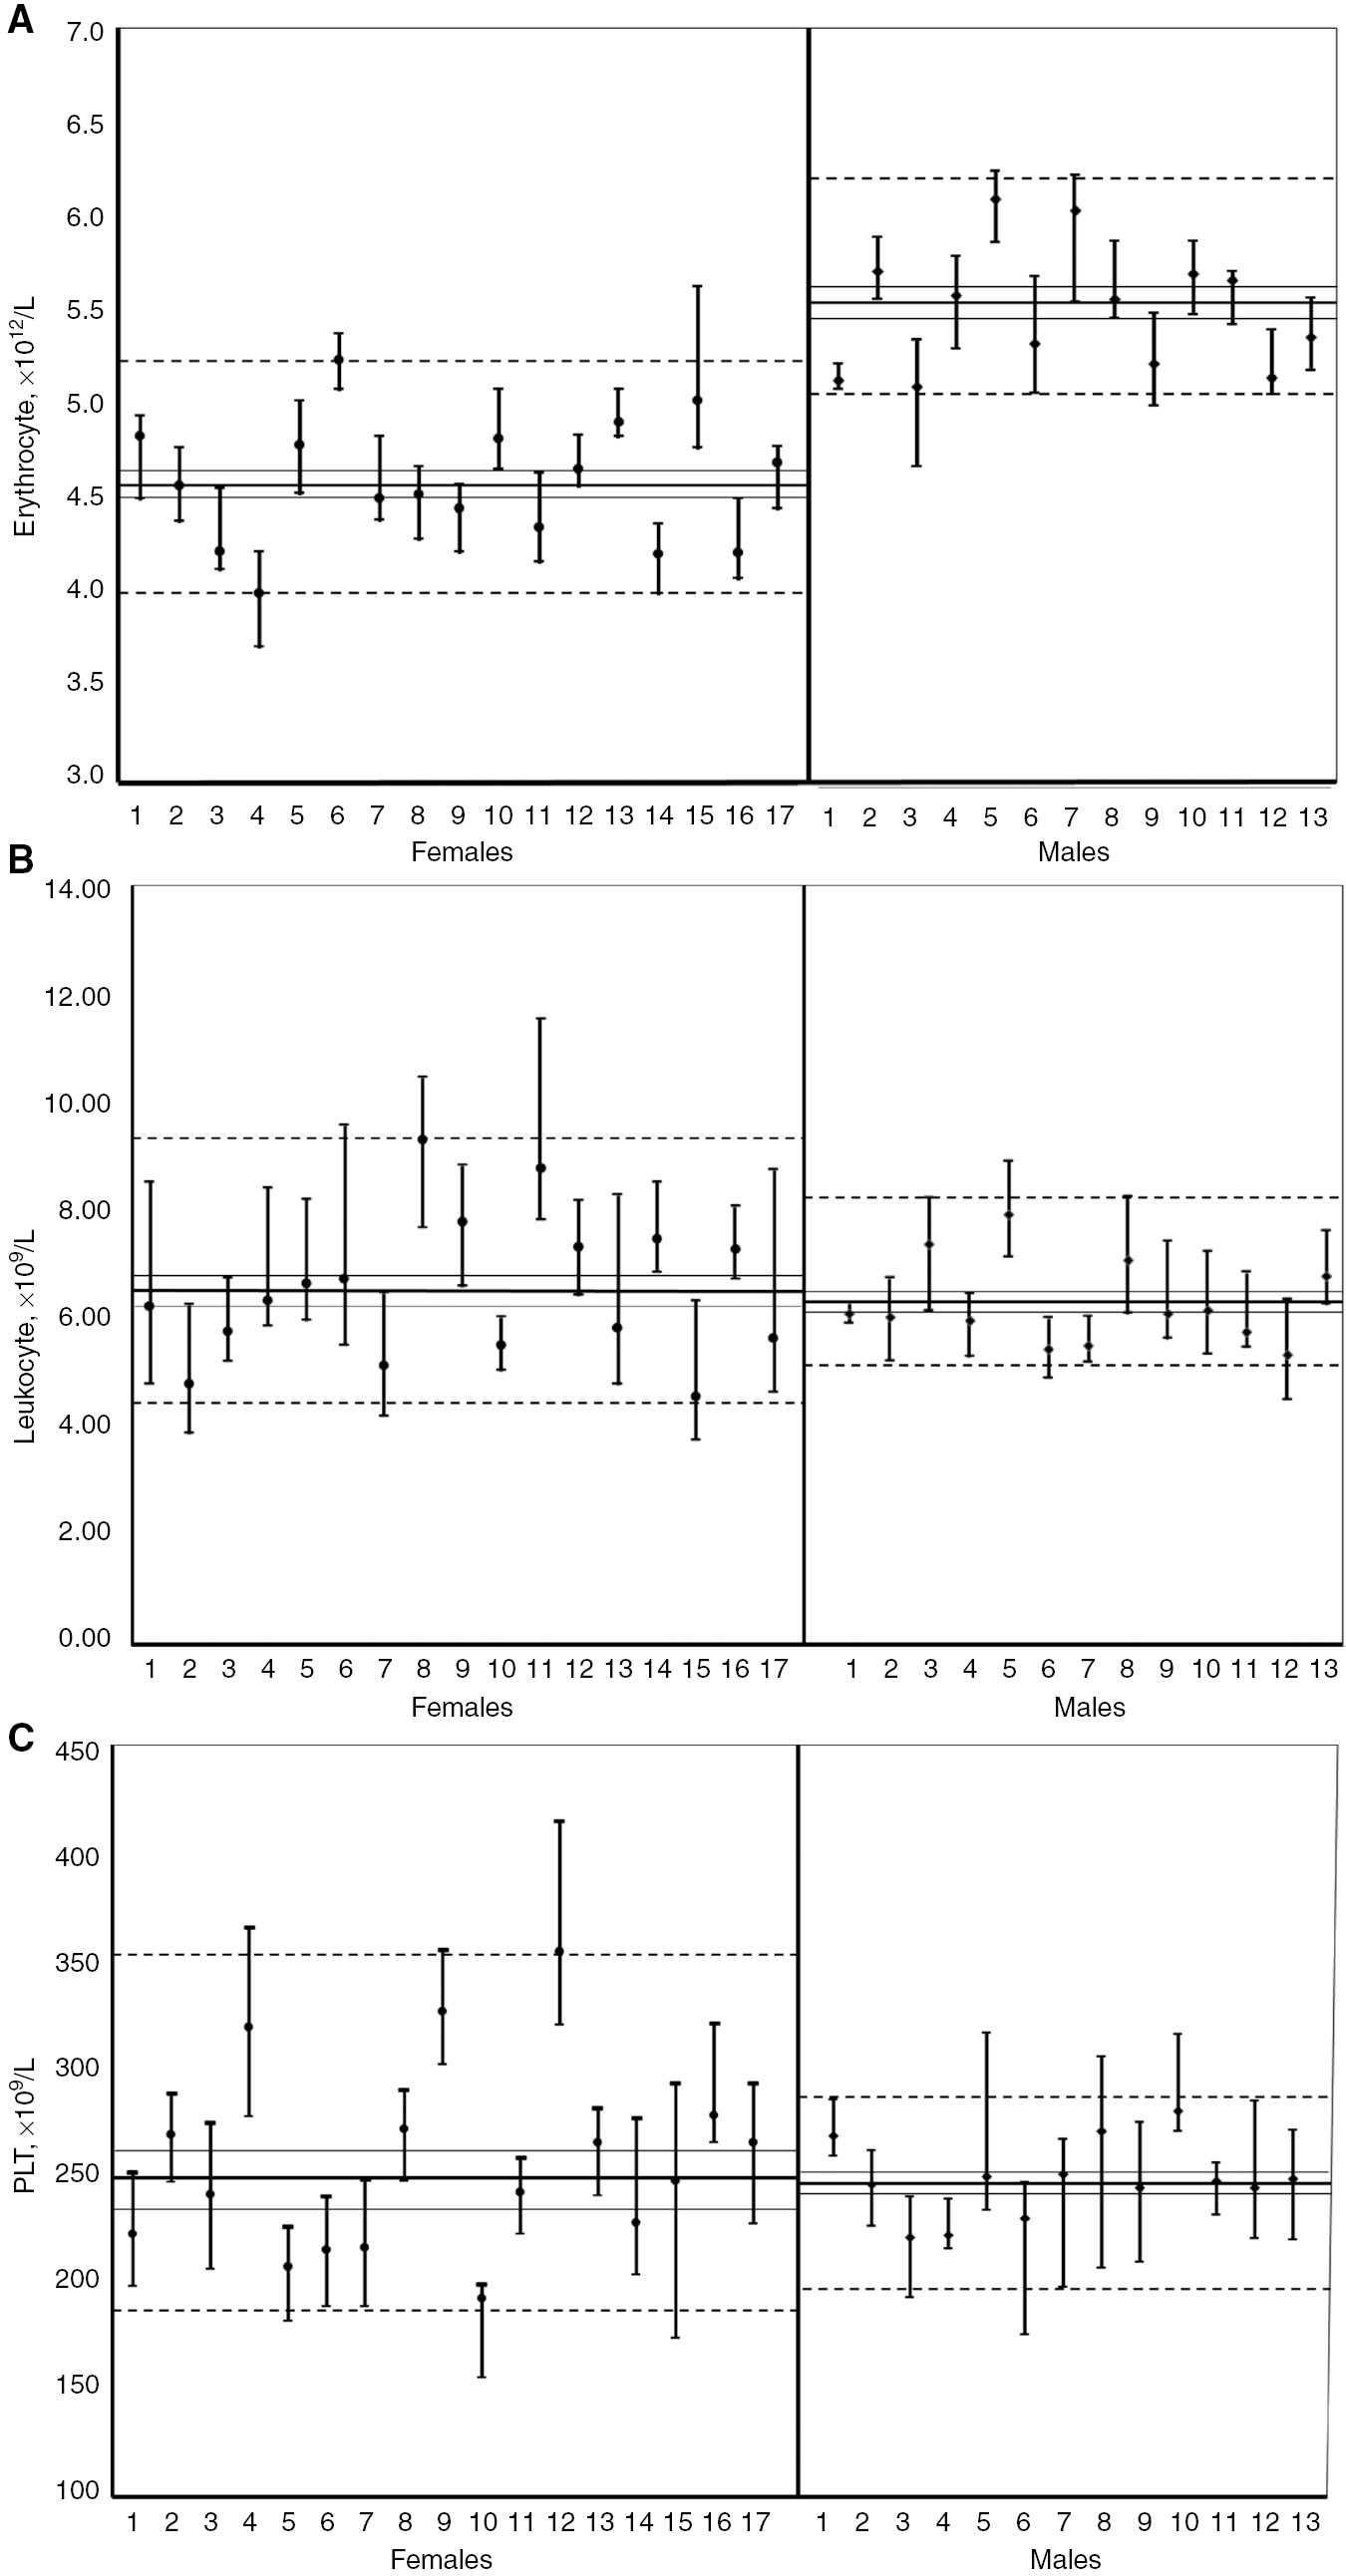
Median values with range (minimum–maximum) of erythrocyte (A), leukocyte (B) and platelet (C) counts for individuals based on weekly samplings for 10 weeks.
Dashed lines indicate 5th and 95th percentiles, the continuous line the median value with 95% CIs.
Generally, estimates of the components of BV of the analytes from our study appear to be lower than those listed in the online 2014 BV database (Tables 1 and 2), providing more stringent APSs and RCVs (Table 3). The NHSP (within 5% of the actual value) was 2 in the erythrocyte group, but much higher in the leukocyte group (exceeding 60 for the basophil count). In the leukocyte group, particularly for basophils and eosinophils, widening the target range to 20% still required the measurement of three to four samples to derive the estimates of homeostatic set points.
Desirable analytical performance specifications for imprecision (CVAPS) and bias (BAPS).
| Measurands | CVAPS | BAPS | RCV | II | No (5%) | No (10%) | No (20%) |
|---|---|---|---|---|---|---|---|
| Erythrocyte parameters | |||||||
| Erythrocytes, ×1012/L | 1.39 | 1.56 | 7.89 | 0.50 | 2 | 1 | 1 |
| Hgb, g/L | 1.37 | 1.61 | 7.76 | 0.47 | 2 | 1 | 1 |
| Htc, % | 1.41 | 1.34 | 8.00 | 0.62 | 2 | 1 | 1 |
| MCH, pg | 0.38 | 0.75 | 3.00 | 0.26 | 1 | 1 | 1 |
| MCHC, g/L | 0.49 | 0.47 | 3.47 | 0.61 | 1 | 1 | 1 |
| MCV, fL | 0.36 | 1.01 | 2.06 | 0.18 | 1 | 1 | 1 |
| RDW-SD, fL | 0.83 | 0.69 | 4.84 | 0.75 | 1 | 1 | 1 |
| RBC-He, pg | 1.33 | 0.88 | 7.56 | 1.13 | 2 | 1 | 1 |
| Reticulocyte parameters | |||||||
| Reticulocyte, ×109/L | 5.42 | 5.44 | 32.4 | 0.57 | 22 | 6 | 2 |
| RET-He, pg | 1.70 | 1.09 | 9.67 | 1.25 | 2 | 1 | 1 |
| Leukocyte parameters | |||||||
| Leukocytes, ×109/L | 3.98 | 4.59 | 22.4 | 0.48 | 11 | 3 | 1 |
| Lymphocytes, ×109/L | 4.91 | 5.65 | 28.0 | 0.48 | 16 | 4 | 1 |
| Monocytes, ×109/L | 5.54 | 5.07 | 33.2 | 0.65 | 23 | 6 | 2 |
| Neutrophils, ×109/L | 5.80 | 5.08 | 32.5 | 0.70 | 22 | 6 | 2 |
| Eosinophils, ×109/L | 5.06 | 17.8 | 41.4 | 0.14 | 35 | 9 | 3 |
| Basophils, ×109/L | 5.68 | 6.21 | 55.8 | 0.51 | 63 | 16 | 4 |
| Platelet parameters | |||||||
| PLT-I, ×109/L | 3.61 | 2.55 | 20.6 | 1.00 | 9 | 3 | 1 |
| PDW, fL | 1.85 | 2.74 | 13.7 | 0.36 | 4 | 1 | 1 |
| Plateletcrit, % | 3.23 | 2.97 | 19.2 | 0.65 | 8 | 2 | 1 |
| MPV, fL | 1.12 | 1.54 | 6.95 | 0.39 | 1 | 1 | 1 |
| P-LCR, % | 3.30 | 4.89 | 19.89 | 0.36 | 8 | 2 | 1 |
The index of individuality (II), the reference change value (RCV), and the numbers of samples (no) required to estimate homeostatic set points for CBC parameters. Hgb, hemoglobin; Htc, hematocrit; MCH, mean corpuscular hemoglobin; MCHC, mean corpuscular hemoglobin concentration; MCV, mean corpuscular volume; RDW-SD, red cell distribution wide standard deviation; RBC-He, red blood cell hemoglobin equivalent; RET-He, reticulocyte hemoglobin equivalent; PLT-I, platelets – impedance; PDW, platelet distribution wide; MPV, mean platelet volume; P-LCR, platelet larger cell ratio.
II of all hematological parameters are shown in Table 3. The IIs of 12 of 21 parameters were lower than 0.60 and for the remaining parameters II ranged from 0.60 to 1.25.
Discussion
Integrated analysis of hematological parameters employing the new generation of hematologic analyzers affords rapid, relatively inexpensive and non-invasive differential diagnosis and disease monitoring in clinical practice. Various clinical situations such as anemia, malignancies, infections bleeding disorders and several other hematological disorders fall within the wide range of clinical conditions that require clinical decision-making on the basis of such analyses [21]. Knowledge of the BV of the various parameters that make up the CBC enables identification of the required APS for analytical systems. In addition, appropriately derived BV data can be used in various ways to enable clinical interpretation and application of laboratory data [22].
For most CBC parameters, previous BV estimates have been derived, some of which are summarized in online 2014 BV database [6]. However, the lack of sex-stratification for these estimates may impact their utility and additionally, the online data lack measures of uncertainty and are derived from publications mostly dated prior to 2000. Such historical data may therefore be less relevant today given the major technological developments in analytical techniques for hematology analyzers and the fact that the analytical performances of current instruments are superior to those of older instruments [23]. It is interesting to note that the APSs for reticulocyte counts of Sandberg et al. [24] were derived using two hematological analyzers, which are no longer available in the market place. Comparison of BV datasets from historical studies and our current study is hindered by the lack of CIs in earlier work and the impossibility of direct methodological comparisons. However, generally, BV estimates delivered by our study are lower than those made available in the online 2014 BV database (Tables 1 and 2). Additionally, our data indicate that for the majority of CBC parameters BV estimates, in most cases either CVI or CVG, should be sex-stratified for valid application (Tables 1 and 2). Thus, indices such as the RCV may differ by sex for some parameters. Further complexity may arise upon aging, especially in females. This is because the kinetics of RBC production change with age [25, 26].
For RBCs and reticulocyte parameters mean concentrations in females were as expected lower than those of males. However, CVIs were not significantly different between sexes (Figure 1; Table 1). Similar observations were made by Buoro et al. [23].
A study evaluating the BV of hematological parameters in adults and elderly subjects reported lower CVI and CVG levels in females than males for RBC, Hb and Hct [27]. Critical evaluation of this study identified factors that may have impacted the reliability of the data: The protocol featured collection of only four samples per subject, impacting the power of the study [28]. The cited work also employed a less robust statistical approach than our study; estimates of CVA were based on quality control samples and not via measurement of replicate subject blood samples, which is the recommended approach. In addition, the CIs of the CVI and CVG values were not reported, rendering a comparison of BV data between the two studies difficult.
Different mean concentration levels were also observed for some leukocyte subgroups (Table 2). With the exceptions of the CVI and CVG values of basophils, and the CVG values of lymphocytes and eosinophils, the leukocyte parameters exhibited similar patterns in terms of both CVI and CVG, with numerically higher BV estimates for females compared with males. Additionally, the CVI and CVG estimates reported by our study are clearly lower than those of the online 2014 BV database [6], and substantially so for eosinophils and basophils. Our new data thus deliver more stringent APSs (Table 3) for imprecision, in particular of eosinophils and basophils (Table 2). Higher CVA values widen the CIs of BV estimates [28]. Because a wide CI range decreases the utility of BV data, our results emphasize the need for further development of the analytical methods to meet APSs based on BV.
No difference in mean levels or CVI between sexes was observed for platelets, however, CVG was significantly lower in the male group. We found lower estimates of CVI and CVG for all platelet parameters with the exception of the CVI of the platelet distribution width (PDW) when compared to the online 2014 BV database [6]. Another study, [27], evaluating CBC parameters stratified by sex, observed similar results for females and males (CVI 13.7% and CVG 14% for both genders) in terms of platelets.
Varying sampling intervals may also produce different BV estimates. A recent study derived BV estimates of platelet parameters over 5 consecutive days (day to day variation) and 5 consecutive weeks (week to week variation) using the Sysmex XN analyzer [29]. The CVGs were similar in the two situations while the day to day variation CVI was approximately 50% lower than the week to week variaton CVI. This can be explained by the short duration (5 days) of the study; this covered a period less than that required for platelet turnover [30]. The platelet group BV data of the present study were in agreement (all CIs overlapped) with the week to week variation reported by Buoro et al. [29]. The only exception was the platelet CVG, which, in our study, differed significantly between the sexes; only the female CVG was similar to the value reported by Buoro et al. [29].
The turnover time of CBC parameters varies in vivo; the turnover time for platelets is 7–10 days [31]; that for reticulocytes 1–2 days [32]; that for leukocytes ~3 weeks (subgroups differ in terms of turnover time) [33]; and that for erythrocytes ~4 months [32]. Within our study period of 10 weeks, we covered several multiples of the turnover periods for reticulocytes, leukocytes and platelets, but less than one turnover period for erythrocytes. This may impact the CVI magnitudes of the CBC parameters and may explain why the CVI of erythrocyte group tests was dramatically lower than the CVI of other tests.
Knowledge of BVs enables calculation of the number of samples required to provide an estimate of homeostatic set points within a certain percentage of the true value. This is important, because test results are often evaluated on the basis of a single sample. For the erythrocyte group (Table 3), the result of a single measurement of a single sample is sufficient to predict the homeostatic set point within 10% (with the given APS). For the reticulocyte and leukocyte groups, more samples are needed to predict the homeostatic set point within a reasonable percentage such as 5% or 10%. This is the case particularly for eosinophil and basophil measurands, because they have high CVI values; additionally, analyzers fail to meet to deliver the APSs required to evaluate imprecision. Under such conditions, replicate measurements are necessary to obtain the required estimates.
Individuality is a marked property of all CBC parameters. The IIs of 12 of 21 parameters were lower than 0.60, which as expected suggests that population-based reference intervals (RIs) are of very limited utility. In such situations, a clinically significant change may occur in a subject whose value remains within the conventional population-based RI, and who may thus be missed. In such situations, the individual is clearly the best point of reference for assessing change, armed with the knowledge of the BV of the measurand. The IIs of certain CBC parameters ranged from 0.60 to 1.25, indicating that RIs may indeed be of some value, but the preferred value of >1.40 was never exceeded.
RCV provides a useful tool for assessment of results when marked individuality compromises the use of conventional population-based RIs, particularly when monitoring patients [20]. Caution should be applied to the use of RCV in certain circumstances. The RCV is calculated from the CVA and CVI; RCV may not be an appropriate parameter in tests that do not meet the APSs for imprecision (i.e. eosinophils and basophils).
Study limitations
A possible limitation of this study is the relatively narrow age range of the female volunteers (all 22 females were of fertile age); additional studies may be needed to verify the utility of these data in post-menopausal women.
Another limitation is that all analyses were performed using only one instrument and reagents from a single manufacturer (Sysmex XN 3000 instrument, Sysmex Co., Kobe, Japan). However, it is unlikely that this will have affected BV estimates. In fact, although many morphological parameters measured by the new generation of hematological analyzers (not considered in this study) are analyzer- and technology-dependent (e.g. MCV), the standard parameters are an exception, and their BV findings may be transferred to analyzers produced by other manufacturers, as revealed by external quality assessments showing good agreement among different technologies [23].
Blood samples were assayed on the day of collection. A variability between days could not be detected by duplicate measurements of subjects’ samples. However, all internal and external QC parameters were within acceptable ranges during the study period; no significant trend was apparent.
Conclusions
Because of the concerns raised around the quality and the reliability of the current BV database, EFLM Biological Variation Working Group initiated the EuBIVAS to updated BV estimates for several measurands. In this study strict pre-analytical protocols and appropriate statistical techniques were used to obtain reliable data for the BV of hematological parameters and the presented data is compliant with BIVAC [10]. With some exceptions, the BV estimates of hematological parameters were found to be lower than those of the BVD [6]. Because individuality is characteristic of hematological parameters, sex-related RCVs should be used instead of RIs for patient monitoring.
Acknowledgments
We would like to thank Thomas Røraas for statistical analysis of the paper and all the volunteers involved in the study, and the staff of Sysmex Turkey for their technical assistance and donation of reagents.
References
1. van de Wijngaart DJ, Scherrenburg J, van den Broek L, van Dijk N, Janssens PM. A survey of doctors reveals that few laboratory tests are of primary importance at the Emergency Department. Diagnosis 2014;1:239–44.10.1515/dx-2014-0025Suche in Google Scholar PubMed
2. Sandberg S, Fraser CG, Horvath AR, Jansen R, Jones G, Oosterhuis W, et al. Consensus statement defining analytical performance specifications: consensus statement from the 1st Strategic Conference of the European Federation of Clinical Chemistry and Laboratory Medicine. Clin Chem Lab Med 2015;53:833–5.10.1515/cclm-2015-0067Suche in Google Scholar PubMed
3. Ceriotti F, Fernandez-Calle P, Klee GG, Nordin G, Sandberg S, Streichert T, et al. Criteria for assigning laboratory measurands to models for analytical performance specifications defined in the 1st EFLM Strategic Conference. Clin Chem Lab Med 2017;55:189–94.10.1515/cclm-2017-0772Suche in Google Scholar PubMed
4. Carobene A. Reliability of biological variation data available in an online database: need for improvement. Clin Chem Lab Med 2015;53:871–7.10.1515/cclm-2014-1133Suche in Google Scholar PubMed
5. Aarsand AK, Røraas T, Sandberg S. Biological variation – reliable data is essential. Clin Chem Lab Med 2015;53:153–4.10.1515/cclm-2014-1141Suche in Google Scholar PubMed
6. Minchinella J, Ricos C, Perich C, Fernandez-Calle P, Alvarez V, Domenech M, et al. Biological variation database and quality specifications for imprecision, bias and total error (desirable and minimum). The 2014 update. Available at: https://www.westgard.com/biodatabase-2014-update.htm. Accessed 7 Nov 2017.Suche in Google Scholar
7. Carobene A, Strollo M, Jonker N, Barla G, Bartlett WA, Sandberg S, et al. Sample collections from healthy volunteers for biological variation estimates’ update: a new project undertaken by the Working Group on Biological Variation established by the European Federation of Clinical Chemistry and Laboratory Medicine. Clin Chem Lab Med 2016;54:1599–608.10.1515/cclm-2016-0035Suche in Google Scholar PubMed
8. Carobene A, Røraas T, Sølvik UØ, Sylte MS, Sandberg S, Guerra E, et al. Biological variation estimates obtained from 91 healthy study participants for 9 enzymes in serum. Clin Chem 2017;63:1141–50.10.1373/clinchem.2016.269811Suche in Google Scholar PubMed
9. Carobene A, Marino I, Coşkun A, Serteser M, Unsal I, Guerra E, et al. The EuBIVAS project: within- and between-subject biological variation data for serum creatinine using enzymatic and alkaline picrate methods and implications for monitoring. Clin Chem 2017;63:1527–36.10.1373/clinchem.2017.275115Suche in Google Scholar PubMed
10. Aarsand AK, Røraas T, Fernandez-Calle P, Ricos C, Díaz-Garzón J, Jonker N, et al. The biological variation data critical appraisal checklist: a standard for evaluating studies on biological variation. Clin Chem 2018;64:501–14.10.1373/clinchem.2017.281808Suche in Google Scholar PubMed
11. Bartlett WA, Braga F, Prusa R, Sandberg S, Carobene A, Coşkun A, et al. A checklist for critical appraisal of studies of biological variation. Clin Chem Lab Med 2015;53:879–85.10.1515/cclm-2014-1127Suche in Google Scholar PubMed
12. Koscielniak BK, Charchut A, Wójcik M, Sztefko K, Tomasik PJ. Impact of fasting on complete blood count assayed in capillary blood samples. Lab Med 2017;48:357–61.10.1093/labmed/lmx044Suche in Google Scholar PubMed
13. Zeng SG, Zeng TT, Jiang H, Wang LL, Tang SQ, Sun YM, et al. A simple, fast correction method of triglyceride interference in blood hemoglobin automated measurement. J Clin Lab Anal 2013;27:341–5.10.1002/jcla.21568Suche in Google Scholar PubMed PubMed Central
14. Cochran WG. Human genetics. Hum Genet 1941;11:47–52.Suche in Google Scholar
15. Snedecor GW, Cochran WG. Statistical methods, 8th ed. Ames, Iowa: Iowa State University Press, 1989.Suche in Google Scholar
16. Shapiro SS, Wilk MB. An analysis of variance test for normality (complete samples). Biometrika 1965;52:591–611.10.1093/biomet/52.3-4.591Suche in Google Scholar
17. Dixon WJ. Processing data for outliers. Biometrics 1953;9: 74–89.10.2307/3001634Suche in Google Scholar
18. Røraas T, Støve B, Petersen PH, Sandberg S. Biological variation: the effect of different distributions on estimated within-person variation and reference change values. Clin Chem 2016;62: 725–36.10.1373/clinchem.2015.252296Suche in Google Scholar PubMed
19. Burdick RK, Graybill F. Confidence intervals on variance components, 1st ed. New York: Marcel Dekker, Inc., 1992.10.1201/9781482277142Suche in Google Scholar
20. Fraser CG. Biological variation: from principles to practice. Washington, DC: AACC Press, 2001.Suche in Google Scholar
21. Desai SP. Clinician’s guide to laboratory medicine, 2nd ed. Housten, TX: MD2B, 2009.Suche in Google Scholar
22. Hilderink JM, Klinkenberg LJ, Aakre KM, de Wit NC, Henskens YM, van der Linden N, et al. Within-day biological variation and hour-to-hour reference change values for hematological parameters. Clin Chem Lab Med 2017;55:1013–24.10.1515/cclm-2016-0716Suche in Google Scholar PubMed
23. Buoro S, Carobene A, Seghezzi M, Manenti B, Dominoni P, Pacioni A, et al. Short- and medium-term biological variation estimates of red blood cell and reticulocyte parameters in healthy subjects. Clin Chem Lab Med 2018;56:954–63.10.1515/cclm-2017-0902Suche in Google Scholar PubMed
24. Sandberg S, Rustad P, Johannesen B, Stølsnes B. Within-subject biological variation of reticulocytes and reticulocyte-derived parameters. Eur J Haematol 1998;61:42–8.10.1111/j.1600-0609.1998.tb01059.xSuche in Google Scholar PubMed
25. Price EA. Aging and erythropoiesis: current state of knowledge. Blood Cells Mol Dis 2008;41:158–65.10.1016/j.bcmd.2008.04.005Suche in Google Scholar PubMed
26. Mahlknecht U, Kaiser S. Age-related changes in peripheral blood counts in humans. Exp Ther Med 2010;1:1019–25.10.3892/etm.2010.150Suche in Google Scholar PubMed PubMed Central
27. Pineda-Tenor D, Laserna-Mendieta EJ, Timón-Zapata J, Rodelgo-Jiménez L, Ramos-Corral R, Recio-Montealegre A, et al. Biological variation and reference change values of common clinical chemistry and haematologic laboratory analytes in the elderly population. Clin Chem Lab Med 2013;51:851–62.10.1515/cclm-2012-0701Suche in Google Scholar PubMed
28. Røraas T, Petersen PH, Sandberg S. Confidence intervals and power calculations for within-person biological variation: effect of analytical imprecision, number of replicates, number of samples, and number of individuals. Clin Chem 2012;58:1306–13.10.1373/clinchem.2012.187781Suche in Google Scholar PubMed
29. Buoro S, Seghezzi M, Manenti B, Pacioni A, Carobene A, Ceriotti F, et al. Biological variation of platelet parameters determined by the Sysmex XN hematology analyzer. Clin Chim Acta 2017;470:125–32.10.1016/j.cca.2017.05.004Suche in Google Scholar PubMed
30. Wang B, Zheng J. Platelet generation in vivo and in vitro. Springerplus 2016;5:787.10.1186/s40064-016-2384-1Suche in Google Scholar PubMed PubMed Central
31. Lu S-J, Li F, Yin H, Feng Q, Kimbrel EA, Hahm E, et al. Platelets generated from human embryonic stem cells are functional in vitro and in the microcirculation of living mice. Cell Res 2011;21:530–45.10.1038/cr.2011.8Suche in Google Scholar PubMed PubMed Central
32. Glader B. Destruction of erythrocytes. In: Greer JP, Foerster J, Lukens JN, Rodgers GM, Paraskevas F, Glader B, editors. Wintrobe’s clin hematol, 2nd ed. Philadelphia: Lippincot Williams and Wilkins, 2004:249–65.Suche in Google Scholar
33. Pillay J, den Braber I, Vrisekoop N, Kwast LM, de Boer RJ, Borghans JA, et al. In vivo labeling with 2H2O reveals a human neutrophil lifespan of 5.4 days. Blood 2010;116:625–7.10.1182/blood-2010-01-259028Suche in Google Scholar PubMed
Supplementary Material:
The online version of this article offers supplementary material (https://doi.org/10.1515/cclm-2017-1155).
©2018 Walter de Gruyter GmbH, Berlin/Boston
Artikel in diesem Heft
- Frontmatter
- Editorials
- Procalcitonin for diagnosing and monitoring bacterial infections: for or against?
- Is it time to abandon the Nobel Prize?
- In Memoriam
- Norbert Tietz, 13th November 1926–23rd May 2018
- Reviews
- Procalcitonin guidance in patients with lower respiratory tract infections: a systematic review and meta-analysis
- Telomere biology and age-related diseases
- Opinion Paper
- Procalcitonin-guided antibiotic therapy: an expert consensus
- Genetics and Molecular Diagnostics
- mRNA expression profile in peripheral blood mononuclear cells based on ADRB1 Ser49Gly and Arg389Gly polymorphisms in essential hypertension — a case-control pilot investigation in South Indian population
- General Clinical Chemistry and Laboratory Medicine
- External quality assessment schemes for glucose measurements in Germany: factors for successful participation, analytical performance and medical impact
- Long-term stability of glucose: glycolysis inhibitor vs. gel barrier tubes
- Observational studies on macroprolactin in a routine clinical laboratory
- Anti-streptavidin IgG antibody interference in anti-cyclic citrullinated peptide (CCP) IgG antibody assays is a rare but important cause of false-positive anti-CCP results
- Point-of-care creatinine testing for kidney function measurement prior to contrast-enhanced diagnostic imaging: evaluation of the performance of three systems for clinical utility
- Hematology and Coagulation
- Analytical performance of an automated volumetric flow cytometer for quantitation of T, B and natural killer lymphocytes
- Lupus anticoagulant testing using two parallel methods detects additional cases and predicts persistent positivity
- Reference Values and Biological Variations
- Within-subject biological variation of activated partial thromboplastin time, prothrombin time, fibrinogen, factor VIII and von Willebrand factor in pregnant women
- Within-subject and between-subject biological variation estimates of 21 hematological parameters in 30 healthy subjects
- Immunoglobulin G (IgG) and IgG subclass reference intervals in children, using Optilite® reagents
- Cancer Diagnostics
- Serum carbohydrate sulfotransferase 7 in lung cancer and non-malignant pulmonary inflammations
- Cardiovascular Diseases
- Clinical performance of a new point-of-care cardiac troponin I test
- Diabetes
- Testing for HbA1c, in addition to the oral glucose tolerance test, in screening for abnormal glucose regulation helps to reveal patients with early β-cell function impairment
- Effects of common hemoglobin variants on HbA1c measurements in China: results for α- and β-globin variants measured by six methods
- Infectious Diseases
- Serum procalcitonin concentration within 2 days postoperatively accurately predicts outcome after liver resection
- Predictive value of serum gelsolin and Gc globulin in sepsis – a pilot study
- Cerebrospinal fluid free light chains as diagnostic biomarker in neuroborreliosis
- Letter to the Editor
- Glucose and total protein: unacceptable interference on Jaffe creatinine assays in patients
- Interference of glucose and total protein on Jaffe-based creatinine methods: mind the covolume
- Interference of glucose and total protein on Jaffe based creatinine methods: mind the covolume – reply
- Measuring procalcitonin to overcome heterophilic-antibody-induced spurious hypercalcitoninemia
- Paraprotein interference in the diagnosis of hepatitis C infection
- Timeo apis mellifera and dona ferens: bee sting-induced Kounis syndrome
- Bacterial contamination of reusable venipuncture tourniquets in tertiary-care hospital
- Detection of EDTA-induced pseudo-leukopenia using automated hematology analyzer with VCS technology
- Early adjustment of antimicrobial therapy after PCR/electrospray ionization mass spectrometry-based pathogen detection in critically ill patients with suspected sepsis
- Thromboelastometry reveals similar hemostatic properties of purified fibrinogen and a mixture of purified cryoprecipitate protein components
- Bicarbonate interference on cobas 6000 c501 chloride ion-selective electrodes