Evaluation of the RF depositions at 3T in routine clinical scans with respect to the SAR safety to improve efficiency of MRI utilization
-


Abstract
Objectives
This study explores the potential for improving of 3T MRI utilization by assessing and tailoring RF exposure in routine clinical scans while complying to standard safety limit.
Methods
Using two generic human body models, we evaluated pbSAR10g values at four landmark positions (knee, pelvis, thoracic spine, head) at different wbSAR levels. Specifically, we analyzed local SAR10g in different operating modes and computed the maximum safety wbSAR, ensuring compliance with IEC limits.
Results
In normal operating mode, the RF power deposition reached wbSAR limit before the pbSAR10g limit. In the first level controlled operating mode, pbSAR10g limit is reached before the wbSAR limit in the knee, thoracic spine scanning scenarios, while the wbSAR limit is reached first in the pelvis scanning scenarios, making it the most potential-releasing (up to 33.33 %) scanning scenario. For head exposure, the head SAR10g limit is reached before the wbSAR limit, highlighting the necessity for strict SAR control. Moreover, we calculated the minimum allowable TR for common imaging sequences for reference.
Conclusions
Different RF exposure setups are necessary to meet safety standards in various scenarios. By implementing careful RF exposure setups in routine clinical scans, the high potential capacity of 3T MRI can be fully released.
Introduction
Magnetic resonance imaging (MRI) is a highly efficient diagnostic tool that provides non-invasive and highly sensitive imaging of the brain, abdomen, and other areas of the body. The development of novel MRI pulse sequences and hardware have greatly enhanced the image quality and spatial resolution of modern MRI systems. However, the applications of new MR technology are often constrained by the issue of radiofrequency (RF) power deposition. Factors such as field strength [1], coil geometry [2], and acquisition sequence parameters [3] (e.g., RF pulse duration, pulse type, and flip angle) significantly influence the RF power deposition within tissues. Additionally, anatomical body characteristics [4], [5], [6], tissue properties [7], and landmark positions [2], 8] also play a significant role in determining the RF power deposition.
To ensure patient’s safety from potential thermal stress and injuries, it is essential to control the RF power deposition during MRI scans. The current MRI safety standard (IEC 60601-2-33 Edition 4.0 2022 [9]) specifies specific absorption rate (SAR) limits that are averaged over the entire body (wbSAR). For normal operating mode with a body transmit coil, the wbSAR10g limit is set at 2 W/kg, while the first level controlled operating mode allows a limit of 4 W/kg. In addition to wbSAR, IEC also imposes limitations on partial body SAR (pbSAR) and head SAR. The head SAR10g limit is set at 3.2 W/kg for both normal operating mode and the first level controlled operating mode. Limitations on local SAR10g (average value over cubical volumes of 10 g of tissue mass) for all modes are applied only when using local transmit coils. This IEC standard has gained recognition from the FDA (U.S. Food and Drug Administration) and is acknowledged as a recognized standard. Meanwhile, ICNIRP [10] still utilizes local SAR10g to control RF power exposure within RF coils. The local SAR10g are 2 W/kg for the head and torso and 4 W/kg for limb for general public. Previous studies have indicated that the local SAR10g limits are often reached before the wbSAR limits when using a body coil [2], [11], [12], [13], particularly in 3T and higher field strength. These studies, however, did not simultaneously consider pbSAR and head SAR. Consequently, despite the existence of these well-defined limits, one important question that among head SAR, pbSAR, and wbSAR, which one should necessarily be used as the determinant limit for RF exposure for patients in diverse positional scenarios has not been thoroughly investigated.
During clinical examinations, only wbSAR can be monitored by the MRI scanner or clinical personnel, as it can be estimated more easily by using the RF power detection circuits and calculating the patient’s mass based on operator input. In practice, MRI manufacturers often incorporate an additional safety factor [14] above and beyond the IEC safety limit in wbSAR for various reasons. For instance, Manuel Johannes Murbach has stated that, in practice, wbSAR seldom surpasses 2–3 W/kg, based on the typically undisclosed manufacturer’s default settings, while the IEC safety standard permits wbSAR values of up to 4 W/kg [14]. AbdEl-Monem M. El-Sharkawy et al. reported that the scanners almost always overestimate the wbSAR as compared to the actual power deposited [15]. Consequently, the RF exposure by clinical MRI scanners are often overestimated [16], [17], [18], [19], and the full potential of the MR scanner in its designated operating modes is seldom realized. This may unnecessarily limit the utilization of the MR scanner in its designated operating modes.
To improve efficiency and safer operation of MRI scanners, previous studies have explored quantifying smaller safety factors for various localized RF exposure scenarios [6], 20], 21]. Additionally, MRI scanner-independent RF dosimeters have been designed [16], [17], [18] to enable accurate power monitoring. Furthermore, the use of the thermal model CEM43 °C in RF safety assessment has been recommended by Manuel Johannes Murbach, as it reduces scan times and allows for higher RF exposures [14]. However, the challenge of how much potential capacity of 3T MRI can be fully realized remains unresolved to this day. To further explore utilization efficiency of MRI scanners while ensure patients’ safety, this study aimed to analyze different RF exposure scenarios in routine clinical scans with varying wbSAR level restrictions at 3T.
Materials and methods
EM simulations
Finite integration simulations were performed using the commercial solver package CST Studio Suite (CST AG, Darmstadt, Germany) on a 64 bit server PC equipped with one graphics processing unit card (NVIDIA TITAN RTX, 24 GB memory). Two birdcage coil models were developed for the study: a 16-rung body-size coil (600 mm coil diameter, 562 mm length, 670 mm shield diameter, and 1,180 mm length, Body Coil) commonly used in clinical MRI, and a smaller head-size coil (285 mm coil diameter, 210 mm length, 355 mm shield diameter, and 350 mm length, Head Coil) for comparison. Both birdcage resonators were driven in quadrature and tuned to a resonance frequency of 123.3 MHz by adjusting the capacitors in their end rings. The capacitances remained constant across simulations. When human models were placed in the coils, matching circuits were added through co-simulation [22] for each case.
The Virtual Family [23] models, including the male model Duke and the female model Ella, with an isotropic resolution of 2 mm, were employed as human models. Frequency-dependent dielectric properties of tissues were obtained from the IT’IS database [24]. Simulations were conducted for each body model with the Body Coil center positioned near the knee, pelvis, thoracic spine, and head, respectively. Additionally, Duke’s head and Ella’s head were positioned inside the Head Coil. The relative position of coil and model can be visualized in Figure 1A, including the Body Coil and Head Coil models.
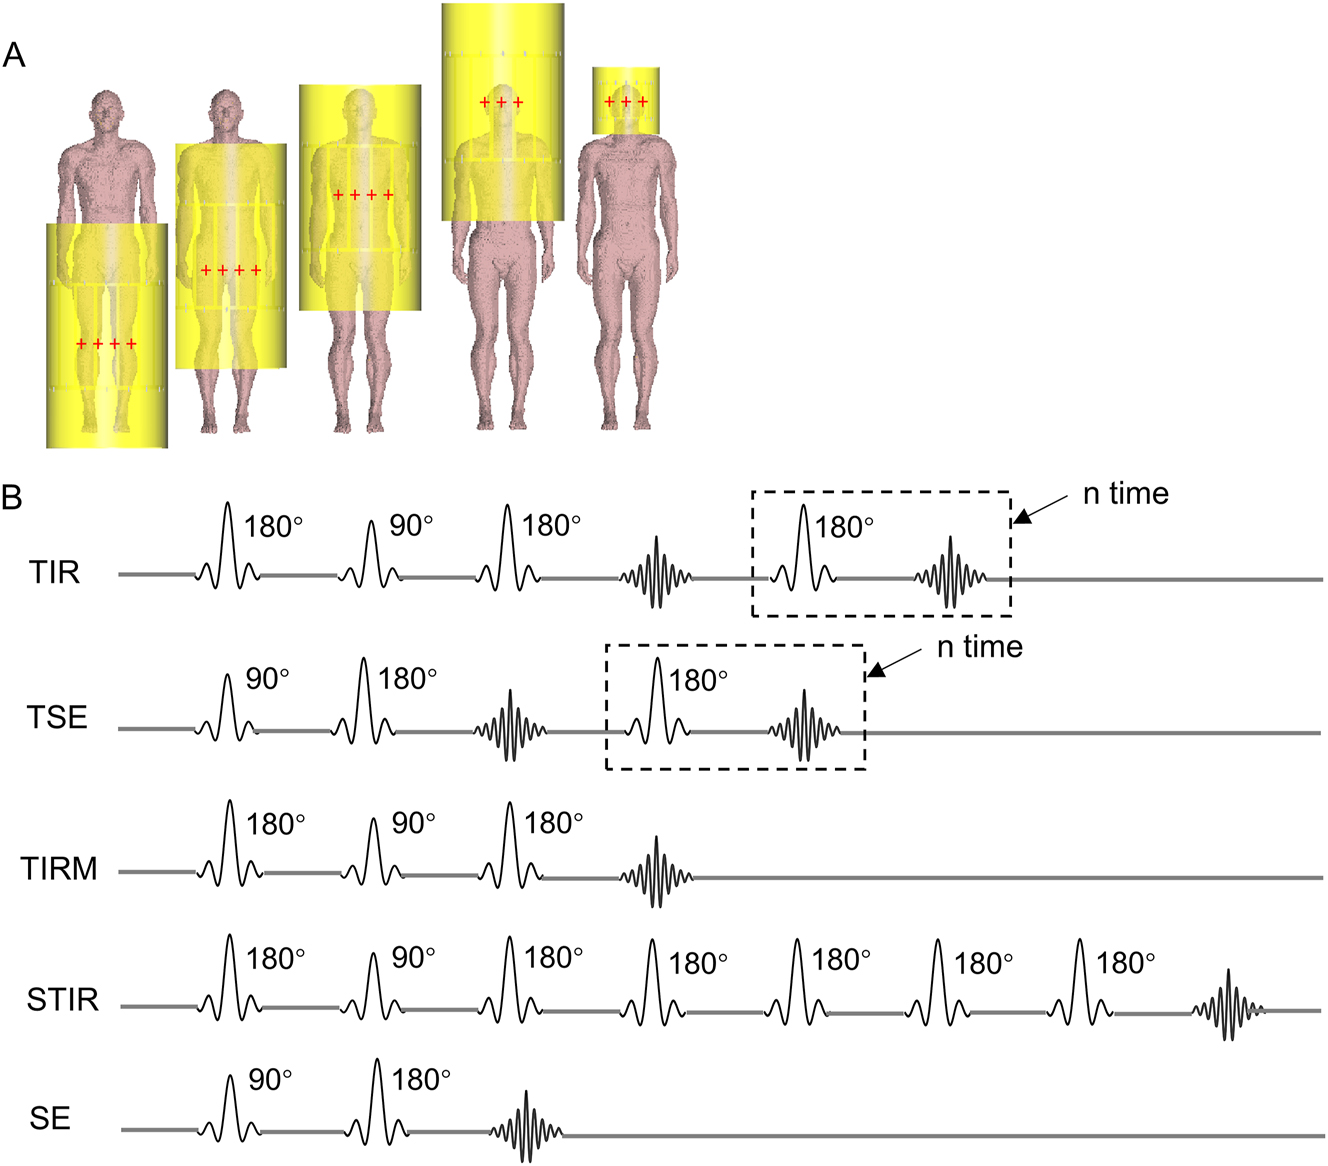
Simulation setup for RF coil positions and commonly used MRI pulse sequences. (A) The relative position of the RF coil and human model, showing Duke with Body Coil centered at four landmark positions and Head Coil centered at the eye level. The center of each coil is marked with red crosshairs. (B) RF pulses sequences of five imaging sequences commonly used in clinical MRI. We assume that only SINC 90° and 180° pulses are used in these sequences.
After each simulation, the 10 g averaged SAR (SAR10g) was calculated in CST using the IEEE/IEC 62704-1 standard [25], which corresponds to IEC safety guidelines. Considering the SAR limitations set by IEC standard, we normalized the electromagnetic exposures to facilitate comparisons.
Calculation of partial body SAR10g limits
In accordance with the stipulations of the IEC standards, the pbSAR10g limits are delineated within a range of 2 W/kg to 10 W/kg in normal operating mode, and 4 W/kg to 10 W/kg in the first-level controlled mode. Notably, the upper limit of 10 W/kg is a dynamic value derived by compensating for the patient’s mass exposed to the effective volume of the RF transmit coil in relation to the total patient mass. This correction mechanism ensures a nuanced and context-specific approach to SAR limits in different operational scenarios.
In normal operating mode, the pbSAR10g limit undergoes correction through the application of Equation (1) [9]:
In the first-level controlled mode, Equation (2) is employed to adjust the limit value of pbSAR10g [9]:
The calculated pbSAR10g limits for subjects Duke and Ella are shown in Figure 2, these adjustments consider the positioning of their knees, pelvis, and thoracic spine at the center of the Body Coil, respectively.

SAR limits and calculations for pbSAR 10g and head SAR 10g in various scanning scenarios. (A) Calculations of pbSAR10g values and pbSAR10g limits for Duke and Ella with Body Coil centered at knee, pelvis, and thoracic spine regions, respectively, when wbSAR equals to 2 W/kg and 4 W/kg. (B) Calculations of head SAR10g when the head of Duke and Ella is positioned in the center of the Head Coil and the Body Coil, respectively, with the wbSAR equals to 2 W/kg and 4 W/kg.
Calculations of maximum safety wbSAR level in clinical
Clinically, wbSAR level generally does not reach the maximum of IEC limits due to various limitations. In this study, the maximum safe wbSAR level that can be applied by an MRI machine without exceeding IEC limit is calculated. The calculations are performed in both normal operating mode and first level controlled operating mode, in two steps. In the first step, pbSAR10g is computed for various scanning scenarios when wbSAR is set to 2 W/kg and 4 W/kg. In this calculation, it becomes apparent which one, between pbSAR10g and wbSAR, reaches the limiting value first. In the second step, the wbSAR level is determined when the metric that reaches the limiting value first has indeed reached that limit. The wbSAR level calculated in the second step is the maximum safety wbSAR level.
SAR calculations for arbitrary RF pulse sequences
SAR varies depending on the type of pulse sequence, as it is closely associated with the RF pulse and repetition time. For a given RF pulse with pulse duration τ and flip angle α, the induced SAR levels can be determined by using a relatively simple formula [26]:
where f is a factor determined by the type of pulse used, calculated as a power ratio of the given pulse to a rectangular pulse with the same α and τ. When a rectangular pulse is used, f=1.0 [1]. For a Gaussian pulse, τ is defined as the full-width half-maximum of the Gaussian, and f=0.67 [1]. For a sinc pulse, τ is defined as the width of the central lobe at the zero crossings, and f=2.0 [1].
In a given pulse sequence, the SAR levels are the average of the energy absorbed from the pulses during the total image acquisition time. This can be expressed as [26]:
where αn and τn represent the flip angle and pulse duration of the n th pulse in a sequence with N RF pulses, and T total is the total time required for the image acquisition. Assuming the same N RF pulses are used in each repetition of a pulse sequence, the SAR over the total imaging time T total is equal to the SAR over the repetition time (TR). The minimum permissible TR can be calculated to avoid exceeding in SAR (SAR lim ) as [27]:
As is shown in Figure 1B, we assumed that only SINC 90° and 180° pulses (with flip angle defined at center of coil) with τ=1.6 ms are used in spin echo (SE) sequence, fast spin echo (FSE/TSE) sequence (number of refocusing pulses per excitation pulse: echo train length, ETL=4) and turbo inversion recovery (TIR) sequence. We calculated the minimum allowable TR for each sequence in all cases. The TR in clinical refers to the TR used in routine clinical scans with the SIEMENS (MAGNETOM Verio 3.0T) MRI scanner.
Results
Figure 2A shows the calculated pbSAR10g and pbSAR10g limits for Duke and Ella with their knees, pelvis, and thoracic spine positioned at the center of the Body Coil, respectively. Figure 2B shows the calculated results of head SAR10g with the head of Duke and Ella positioned at the center of Head Coil and Body Coil, respectively. These results are computed under two cases when wbSAR levels equals to 2 W/kg and 4 W/kg. Compared the calculated pbSAR10g with the calculated pbSAR10g limits, it is obvious that none of the limbs or torsos surpass their respective pbSAR10g limit at a wbSAR level of 2 W/kg, while only the scenario with the pelvis at the center of the Body Coil does not exceed the pbSAR10g limits at a wbSAR level of 4 W/kg. Irrespective of whether the head is positioned at the center of Body Coil or Head Coil, the head SAR10g exceeded the limit at both wbSAR levels of 2 W/kg and 4 W/kg. These data suggest that when knees, thoracic spine exposed to Body Coil, the wbSAR limit is reached before the pbSAR10g limits in the normal operating mode, while the opposite hold true in the first level controlled operating mode. When pelvis exposed to the Body Coil, the wbSAR limit is reached before the pbSAR10g limits in both normal operating mode and the first level controlled operating mode. The head SAR10g limit is reached before the wbSAR limits when exposed to the Head Coil or the Body Coil. It underscores that it is necessary to reduce wbSAR level for head scanning, while allowing for appropriate higher wbSAR levels for the scanning of other body parts.
Table 1 lists the calculations of the maximum safety wbSAR levels. The scanning scenarios considered are Duke and Ella with their knee, pelvis, thoracic spine and head respectively centered at the Body Coil, and head centered at the Head Coil. At the wbSAR levels listed in Table 1, neither pbSAR10g nor head SAR10g exceeded their IEC-specified limits. As mentioned by Murbach, the actual scans rarely exceed a wbSAR level of 2–3 W/kg [14]. If wbSAR level is set to 3 W/kg in the first level controlled operating mode, the data in Table 1 indicate that the wbSAR level in thoracic spine and pelvis scanning scenarios can reach 3.74 W/kg and 4.00 W/kg, respectively, significantly improving MRI utilization efficiency. Notably, when Duke’s knee is at the center of the Body Coil, exceeding a wbSAR level of 3 W/kg in the first level controlled operating mode is not recommended. The computed results in Table 1 also highlight that a wbSAR level exceeding 1 W/kg is not recommended during head region scans. The use of excessively small Head Coils should be minimized to ensure the safety of MRI scanning. It’s essential to note that the provided values are reference points, and in practical scenarios, the wbSAR level should be adjusted based on the coil size and the patient’s body mass.
Calculated results of maximum safety wbSAR level (W/kg) within IEC limits for different scanning scenarios.
| Coil type and position | Normal operating mode, W/kg | First level controlled operating mode, W/kg | Potentiala |
|---|---|---|---|
| Duke knee, Body Coil | 2.00 | 2.54 | / |
| Duke pelvis, Body Coil | 2.00 | 4.00 | 33.33% |
| Duke thoracic spine, Body Coil | 2.00 | 3.74 | 24.78% |
| Ella knee, Body Coil | 2.00 | 3.12 | 3.93% |
| Ella pelvis, Body Coil | 2.00 | 4.00 | 33.33% |
| Ella thoracic spine, Body Coil | 2.00 | 3.83 | 27.51% |
| Duke head, Body Coil | 0.95 | 0.95 | / |
| Duke head, Head Coil | 0.21 | 0.21 | / |
| Ella head, Body Coil | 0.94 | 0.94 | / |
| Ella head, Head Coil | 0.23 | 0.23 | / |
-
aPotential stands for the potential of MRI machine that could be released. Potential=(calculated wbSAR level in the first level controlled operating mode/wbSAR level in clinical) – 1. Suppose the wbSAR level in clinical is 3 W/kg in the first level controlled operating mode.
Figure 3 depict the local SAR10g distributions of Duke and Ella with their knee, pelvis, and thoracic spine centered at the Body Coil, respectively. In both models, it is evident that the local SAR10g distributions are asymmetric between left and right body side. The asymmetry is due to wave behavior of the circularly polarized RF field in the body and the transmit coil. In certain regions, especially in the peripheral body regions, elevated local SAR10g values emerged in the skin, muscles, and fat at specific landmark positions. For instance, with the Body Coil knee-centered (Figure 3A–G), the maximum values of local SAR10g are observed on the right side of the right knee. With the Body Coil pelvis-centered (Figure 3B–H), the surface of certain organs, such as the liver and stomach, experience relatively high levels of local SAR10g. The maximum value is located at the right wrist of Duke and the right groin of Ella for this scenario. Specifically, Duke has a peak SAR10g value of 21.03 W/kg in the right wrist and a peak SAR10g value of 19.90 W/kg in the trunk, indicating that the extremities would reach pbSAR10g limit before the trunk in this case. When the Body Coil is thoracic spine-centered (Figure 3C–I), the local SAR10g values in the lung, small intestine, large intestine, and stomach also exhibit partial elevations, and the maximum local SAR10g occur in the right arm of Duke and the left wrist of Ella. These distribution of local SAR10g in Figure 3 reveals which body part in the coil may reach the pbSAR10g limit first under different scenarios. Ensuring careful attention to these body parts during MRI scans is essential for patient safety and the optimization of scan protocols.

SAR10g distributions of Duke (A–F) and Ella (G–L) when ody Coil centered at knee (A, D, G, J), pelvis (B, E, H, K) and thoracic spine regions (C, F, I, L). Results are compared in the central coronal, sagittal and axial slice when local SAR10g is normalized to the calculated maximum safety wbSAR level in the normal operating mode (A, B, C, G, H, I) and first level controlled operating mode (D, E, F, J, K, L), respectively.
For more precise statistics, the histograms in Figure 4 show the statistical distributions of local SAR10g in the extremity and trunk regions of Duke for knee, pelvis and thoracic spine-centered cases. Significantly, the majority of local SAR10g values are consistently well below 10 W/kg for trunk and 20 W/kg for extremity. When the wbSAR is set to 2.0 W/kg with the Body Coil knee-centered, only 0.59 % of local SAR10g in the trunk of Duke exceed 10 W/kg, while 3.84 % of Duke’s extremities reach 20 W/kg. When the wbSAR is set to the calculated maximum level in the first level controlled operating mode, 0.98 % of Duke’s trunk and 6.74 % of Duke’s extremities exceeded the 10 W/kg for trunk and 20 W/kg for extremity. With Body Coil pelvis-centered, 3.29 % of local SAR10g in the trunk of Duke exceeded 10 W/kg and a few values in the extremities surpassed 20 W/kg when exposed to a wbSAR level of 2.0 W/kg. The share of the excess evaluates to 14.5 % for Duke when the wbSAR level is set to the calculated maximum level. With Body Coil thoracic spine-centered, the percentages of trunk with local SAR10g higher than 10 W/kg decrease from 15.14 % to 3.04 % for Duke when scaling the wbSAR level from the calculated maximum level to 2 W/kg. The minority of local SAR10g values in the extremity regions, 0.08 % for Duke exceeded 20 W/kg at a wbSAR level of 2.0 W/kg. Although IEC has canceled the limitations on local SAR10g for body coil in the newest standard, the local SAR10g is after all a safety concern. After repeated calculations, it is proved that some points of the trunk do have a local SAR10g higher than 10 W/kg and some of the extremities have a local SAR10g higher than 20 W/kg, which is an intrinsic issue that should be further discussed with the experts working on MRI safety.

Statistical distributions of local SAR10g values in trunk region (A, C, E) and in extremity region (B, D, F) of Duke when the wbSAR is set to the calculated maximum safety level listed in Table 1, respectively. From the first row to the third row: Body Coil centered at knee (A, B), pelvis (C, D) and thoracic spine regions (E, F).
Figure 5 provides a comparison of the local SAR10g maps when the head of Duke and Ella is positioned in the center of the Head coil and the Body coil. It is interesting to note the similarity in the global pattern of SAR10g distributions within the head. Local SAR10g values in white matter, gray matter, cerebrospinal fluid, and the cerebral cortex were comparatively high when exposed to a head SAR level of 3.2 W/kg. However, there were differences between the two coil sizes. As depicted in Figure A.1, compared to the Body Coil, the values of local SAR10g were considerably higher when the human models were positioned in the Head Coil. The maximum values of local SAR10g occurred in the skin of the neck for the Body Coil, while they occurred in the lateral brain region for the Head coil. None of local SAR10g in the head for Duke and Ella would exceed 10 W/kg when exposed to a head SAR level of 3.2 W/kg.

SAR10g distributions of Duke (A, B) and Ella (C, D) when their head in the ody Coil (A, C) and Head Coil (B, D). Results were compared in the central coronal, sagittal and axial slice when local SAR10g was normalized to a head SAR10g level of 3.2 W/kg, respectively.
Table 2 lists the minimum allowable TR for common imaging sequences of Duke and Ella with their knee, pelvis, thoracic spine and head respectively centered at the Body Coil, and head centered at the Head Coil. The calculated minimum allowable TR is shorter compared to the TR used in clinical practice, indicating potential opportunities for sequence design. In reality, the manufacturers will calculate the minimum TR based on sequence parameters given wbSAR limit through simple equations. The calculated minimum allowable TR here are for reference to the sequence designers.
Calculated minimum allowable TR (ms) in contrast to TR (ms) in clinical for common imaging sequences of Duke and Ella with their knee, pelvis, thoracic spine and head respectively centered at the Body Coil, and head centered at the Head Coil. We assumed only 1.6 ms SINC pulse was used in each sequence.
| TR in clinical | TR, Duke | Room for adjustment [1], (Duke) | TR, Ella | Room for adjustmenta(Ella) | |
|---|---|---|---|---|---|
| Head (head coil) | |||||
| TIR (ETL=5) | 2,000 | 103 | 94.86 % | 116 | 94.22 % |
| TSE (ETL=4) | 4,000 | 83 | 97.92 % | 94 | 97.66 % |
| TIRM | 9,000 | 44 | 99.51 % | 50 | 99.45 % |
| Head (body coil) | |||||
| TIR (ETL=5) | 2,000 | 485 | 75.76 % | 1,458 | 27.10 % |
| TSE (ETL=4) | 4,000 | 392 | 90.19 % | 1,180 | 70.49 % |
| TIRM | 9,000 | 208 | 97.69 % | 643 | 92.86 % |
| Thoracic spine | |||||
| HASTE | 1,400 | 34 | 97.60 % | 53 | 96.23 % |
| T2_TSE | 2,600 | 571 | 78.05 % | 898 | 65.46 % |
| TIRM | 4,000 | 302 | 92.45 % | 475 | 88.11 % |
| Pelvic | |||||
| TIRM | 4,500 | 769 | 82.91 % | 510 | 88.67 % |
| T2_TSE | 3,000 | 1,453 | 51.57 % | 963 | 67.90 % |
| STIR | 3,500 | 2,478 | 29.19 % | 1,643 | 53.06 % |
| Knee | |||||
| TSE (ETL=4) | 4,670 | 2,266 | 52.39 % | 712 | 85.04 % |
| SE | 700 | 667 | 4.77 % | 210 | 70.07 % |
-
aRoom for adjustment stands for the room of adjusting TR. Adjusting Space=1 – (calculated minimum allowable TR/TR in clinical).
Discussion
Various international organizations have established standards for SAR control, each with distinct scopes and focuses. ICNIRP’s standards prioritize safeguarding public health against both short- and long-term electromagnetic exposures but may not be universally applicable to certain medical treatment scenarios [10]. Federal Communications Commission (FCC) standards [28], 29], on the other hand, concentrate on SAR control within wireless communication environments, encompassing the usage of portable and mobile devices. IEC imposes limitations on the fundamental safety aspects of MR equipment. Therefore, most of the MRI manufacturers adhere to the IEC standard for SAR control during clinical MRI scans. Although IEC 60601-2-33:2022 does not impose a limit on local SAR10g while using a volume coil, the distribution of local SAR10g highlights the body parts with higher SAR values at identical irradiation levels, signifying potential constraints on the overall irradiation level. From the results it is found that the distribution of local SAR10g in the human body is not homogeneous. Approximating the axial section of the human body as a circle of radius r, and the RF magnetic field (B 1) of the coil is uniformly distributed and perpendicular to the axial direction of the body, then the induced electric field perpendicular to B 1 field in the human body can be expressed by [30]:
Where b 1 is the magnitude of the B 1 field. The derivation process is detailed in the appendix. From Equation (6) we can see that E is proportional to r, which explains the phenomenon that the closer to the center of the body the lower the SAR in the same axial section. In the circular polarization mode, the electromagnetic field moves around the B0 direction, following the left-hand principle. Due to the same current passing through the surface of the human body, for axial sections with larger r, the charge spreads over a larger surface, leading to a decrease in charge density. Conversely, when the r of the axial section approaches zero, the charge can be considered to converge to a single point, resulting in a higher charge density and consequently a higher SAR. This explains why the SAR at the top of the head is higher than that at the cheekbone. Moreover, the reduced radius of the thighs compared to the trunk results in charge enrichment at the junction of the trunk and thighs during the rotation of the B 1 field, resulting in a higher SAR at this location. Similarly, the junction of the head and neck shows a higher SAR. Figure A.2 compares the SAR10g distribution between linear-polarized mode and circular-polarized mode, using the scenario where Duke’s thoracic spine is centered in the coil as an example. The SAR10g distribution in Figure A.2A is more symmetric than the SAR10g distribution in Figure A.2B. In conclusion, the rotation of B 1 field leads to the asymmetry of E filed and SAR distribution between the left and right sides of the human body.
The current SAR management practices may be conservatively calculated by the MRI systems and could potentially be adjusted within the constraints of the IEC standard. To assess RF exposure in routine clinical scans and maximize the utilization of 3T MRI, this study analyzed RF exposure scenarios with different wbSAR level restrictions using two human models. The generic body models are usually utilized to mimic the patient being scanned in clinic [27], 31], 32]. The chosen landmark positions of the body model represent the commonly scanned areas in hospitals. The statistical calculations in Table 1 reveal that it should keep the restrictions of wbSAR to a level of 2 W/kg in the normal operating mode to ensure the patient RF safety. In the first level controlled operating mode, it should be acceptable to relax the restrictions of wbSAR to a level of more than 3 W/kg in most of the scenarios, improving the efficiency of MRI utilization. However, the statistical calculations in Table 1 indicate the necessity of reducing the RF exposure level during MRI head imaging, especially when a Head Coil is used. This can be attributed to the fact that a smaller coil can generate a higher magnetic field [33] with less input power, resulting in less RF power being absorbed by the patients. Due to space constraints, this paper only investigates the SAR levels in the human body under two different sizes of birdcage coils, which are typical volume RF transmit coils commonly used in 3T MRI. Besides, transmit array coils are also available in 3T imaging. The independently controllable driving currents of each coil can create various complex field distributions, which increases the difficulty of SAR management. However, there is evidence that using multi-row parallel transmit coils could decrease local SAR levels compared to the conventional birdcage coil [34]. Some studies even use phased-array coils and volume coils simultaneously during transmission, which results in lower SAR levels compared to using a volume coil alone [35]. Therefore, it is reasonable to believe that the proposed SAR management strategy is able to be applied in the circumstances when transmit array coils or phased-array coils are used. It would be beneficial for MRI manufacturers to set flexible wbSAR levels for different landmark positions and RF coils by considering the dynamic pbSAR10g limits set by IEC. This would facilitate a much better balance between patient’s safety and the need for scanner utilization efficiency for faster scan or higher spatial resolution, which can potentially result in a significant savings for tens of thousands of MRI scanners worldwide.
The numerical results in this paper are technically valid only for the model and coil arrangement presented here until they can be experimentally verified. SAR levels are influenced by several factors such as individual anatomical variations. For example, there is a substantially difference between the maximum local SAR10g values of Duke and Ella when Body Coil centered at their knee regions, which is caused by their size differences. In practice, the variability in the tissue electric properties and loading effect to the RF coil (uncertainties in the tuning and matching of the coil) could significantly change the input RF power needed for a given sequences and power deposition to a patient. SAR is also dependent of pulse types and duration, suggesting that developing new sequences could further enhance MRI utilization efficiency.
To sum up, a careful and dynamic estimation of RF exposure safety in clinical is crucial for the effective and safe use of MRI scanners in diagnosing a diverse patient population. The analyses presented in this paper not only serve as a valuable guide for MRI physicists and technologists in determining permissible experiments with Body and Head Coils but also suggest a possible SAR management strategy for MRI manufacturers to improve efficiency in utilization of 3T MRI.
Conclusions
This study offers a comprehensive evaluation of localized and partial RF exposures during routine clinical scans using two human models under different wbSAR levels. The study compared local SAR10g, pbSAR10g, head SAR10g values at four scan landmark positions (head, thoracic spine, pelvis and knee) when the wbSAR was normalized to the level of 2.0 W/kg and 4.0 W/kg. Moreover, the maximum safety wbSAR values were calculated in each case. The findings emphasize the need for flexible and tailored evaluation on RF exposure, which are revisable when new data and technology become available. By adopting a more nuanced approach to SAR management, the full capacity of MRI scanners can be effectively accessed and utilized to its maximum potential.
Funding source: Science and Technology Program of Guangdong (Foreign Famous Expert), China
Award Identifier / Grant number: 207223078007
Funding source: National Foreign Expert Project
Award Identifier / Grant number: G2023163005L
Funding source: Guangdong Provincial Key Laboratory of Human Digital Twin
Award Identifier / Grant number: 2022B1212010004
Funding source: National Natural Science Foundation of China
Award Identifier / Grant number: 61671229
Award Identifier / Grant number: 61929101
-
Research ethics: Not applicable.
-
Informed consent: Not applicable.
-
Author contributions: The authors have accepted responsibility for the entire content of this manuscript and approved its submission. Ruixin Li: conceptualization, methodology, data curation, formal analysis, visualization, writing – original draft. Xinlian Chen: conceptualization, methodology, data curation, writing – original draft. Yupeng Liao: software, validation, writing – review & editing, Sherman Xuegang Xin: conceptualization, project administration, funding acquisition, supervision, writing – review & editing.
-
Use of large language models, AI and machine learning tools: The authors wrote the whole paper word by word. Occasionally, we use ChatGPT to check the grammar of some sentences.
-
Conflict of interest: The authors state no conflict of interest.
-
Research funding: This work was partly supported by the National Natural Science Foundation of China (No. 61929101, 61671229), Guangdong Provincial Key Laboratory of Human Digital Twin (2022B1212010004), National Foreign Expert Project (No. G2023163005L), and Science and Technology Program of Guangdong (Foreign Famous Expert), China (No. 207223078007).
-
Data availability: The raw data can be obtained on request from the corresponding author.
.

Statistical distributions of local SAR10g values for Duke (A, B) and Ella (C, D) when their head in the Body Coil (A, C) and Head Coil (B, D). All numerical statistics are conducted under the condition of head SAR10g=3.2 W/kg.

SAR10g distributions of Duke with the Body Coil centered at the thoracic spine region. The Body Coil is fed in linear-polarized mode (A) and circular-polarized mode (B), respectively. The local SAR10g is normalized to the level of 2 W/kg.
Mathematical proofs of Equation 6
According to Faraday’s law, the relationship between magnetic flux density and electric field strength can be expressed by:
where B is the magnetic flux density, E is the electric field strength. Approximating the axial section of the human body as a circle of radius r, the cross-sectional area S is πr2 and the perimeter l is 2πr. Assume the RF magnetic field (B 1) of the coil is uniformly distributed and perpendicular to the axial direction of the body, then the B 1 field of the coil can be expressed by [30]:
Where b 1 is the magnitude of the B 1 field. Considering the coil’s B 1 field and combining the equation A.1, A.2, the induced electric field perpendicular to B 1 field in the human body can be expressed approximately by equation (6) in the paper.
References
1. Bottomley, PA, Redington, RW, Edelstein, WA, Schenck, JF. Estimating radiofrequency power deposition in body NMR imaging. Magn Reson Med 1985;2:336–49. https://doi.org/10.1002/mrm.1910020404.Search in Google Scholar PubMed
2. Yeo, DT, Wang, Z, Loew, W, Vogel, MW, Hancu, I. Local specific absorption rate in high-pass birdcage and transverse electromagnetic body coils for multiple human body models in clinical landmark positions at 3T. J Magn Reson Imaging 2011;33:1209–17. https://doi.org/10.1002/jmri.22544.Search in Google Scholar PubMed PubMed Central
3. Igboanugo, E, Lazar, V, B, B, D, K, M, A. Estimation of Specific Absorption Rate (SAR) in an 1.5 Tesla Magnetic Resonance Imaging (MRI) scanner using common Brain Sequences. Int J Sci Res 2018;7:16–7.Search in Google Scholar
4. de Greef, M, Ipek, O, Raaijmakers, AJ, Crezee, J, van den Berg, CA. Specific absorption rate intersubject variability in 7T parallel transmit MRI of the head. Magn Reson Med 2013;69:1476–85. https://doi.org/10.1002/mrm.24378.Search in Google Scholar PubMed
5. Ipek, Ö, Raaijmakers, AJ, Lagendijk, JJ, Luijten, PR, van den Berg, CA. Intersubject local SAR variation for 7T prostate MR imaging with an eight-channel single-side adapted dipole antenna array. Magn Reson Med 2014;71:1559–67. https://doi.org/10.1002/mrm.24794.Search in Google Scholar PubMed
6. Le Garrec, M, Gras, V, Hang, MF, Ferrand, G, Luong, M, Boulant, N. Probabilistic analysis of the specific absorption rate intersubject variability safety factor in parallel transmission MRI. Magn Reson Med 2017;78:1217–23. https://doi.org/10.1002/mrm.26468.Search in Google Scholar PubMed
7. Shao, Y, Zeng, P, Wang, S. Statistical simulation of SAR variability with geometric and tissue property changes by using the unscented transform. Magn Reson Med 2015;73:2357–62. https://doi.org/10.1002/mrm.25367.Search in Google Scholar PubMed PubMed Central
8. Kopanoglu, E, Deniz, CM, Erturk, MA, Wise, RG. Specific absorption rate implications of within-scan patient head motion for ultra-high field MRI. Magn Reson Med 2020;84:2724–38. https://doi.org/10.1002/mrm.28276.Search in Google Scholar PubMed PubMed Central
9. International Electrotechnical Commission. Medical electrical equipment - Part 2-33: particular requirements for the safety of magnetic resonance equipment for medical diagnosis. IEC 60601-2-33:2022, 4th ed Geneva: IEC; 2022.Search in Google Scholar
10. International Commission on Non-Ionizing Radiation Protection. Guidelines for limiting exposure to electromagnetic fields (100 kHz to 300 GHz). Health Phys 2020;118:483–524. https://doi.org/10.1097/HP.0000000000001210.Search in Google Scholar PubMed
11. Wang, Z, Lin, JC, Mao, W, Liu, W, Smith, MB, Collins, CM. SAR and temperature: simulations and comparison to regulatory limits for MRI. J Magn Reson Imaging 2007;26:437–41. https://doi.org/10.1002/jmri.20977.Search in Google Scholar PubMed PubMed Central
12. Nadobny, J, Szimtenings, M, Diehl, D, Stetter, E, Brinker, G, Wust, P. Evaluation of MR-induced hot spots for different temporal SAR modes using a time-dependent finite difference method with explicit temperature gradient treatment. IEEE Trans Biomed Eng 2007;54:1837–50. https://doi.org/10.1109/tbme.2007.893499.Search in Google Scholar
13. Wang, Z, Lin, JC. Partial-body SAR calculations in magnetic-resonance image (MRI) scanning systems [telecommunications health and safety. IEEE Antenn Propag Mag 2012;54:230–7. https://doi.org/10.1109/map.2012.6230763.Search in Google Scholar
14. Murbach, MJ. EMF Risk Assessment: exposure assessment and safety considerations in MRI and other environments [Ph.D. thesis]. Zurich, Switzerland: ETH Zurich; 2013.Search in Google Scholar
15. El-Sharkawy, AMM, Qian, D, Bottomley, PA, Edelstein, WA. A multichannel, real-time MRI RF power monitor for independent SAR determination. Med Phys 2012;39:2334–41. https://doi.org/10.1118/1.3700169.Search in Google Scholar PubMed PubMed Central
16. Stralka, JP, Bottomley, PA. A prototype RF dosimeter for independent measurement of the average specific absorption rate (SAR) during MRI. J Magn Reson Imaging 2007;26:1296–302. https://doi.org/10.1002/jmri.21141.Search in Google Scholar PubMed PubMed Central
17. Qian, D, El-Sharkawy, AMM, Bottomley, PA, Edelstein, WA. An RF dosimeter for independent SAR measurement in MRI scanners. Med Phys 2013;40:122303. https://doi.org/10.1118/1.4829527.Search in Google Scholar PubMed PubMed Central
18. Seo, Y. An MRI scanner-independent radiofrequency dosimeter for the estimation of RF power deposition with a human torso phantom. Concepts Magn Reson B 2017;47:e21351. https://doi.org/10.1002/cmr.b.21351.Search in Google Scholar
19. Seo, Y, Wang, ZJ. MRI scanner-independent specific absorption rate measurements using diffusion coefficients. J Appl Clin Med Phys 2017;18:224–9. https://doi.org/10.1002/acm2.12095.Search in Google Scholar PubMed PubMed Central
20. Meliadò, EF, Sbrizzi, A, van den Berg, CAT, Steensma, BR, Luijten, PR, Raaijmakers, AJE. Conditional safety margins for less conservative peak local SAR assessment: a probabilistic approach. Magn Reson Med 2020;84:3379–95. https://doi.org/10.1002/mrm.28335.Search in Google Scholar PubMed PubMed Central
21. Adibzadeh, F, Paulides, MM, van Rhoon, GC. SAR thresholds for electromagnetic exposure using functional thermal dose limits. Int J Hyperther 2018;34:1248–54. https://doi.org/10.1080/02656736.2018.1424945.Search in Google Scholar PubMed
22. Kozlov, M, Turner, R. Fast MRI coil analysis based on 3-D electromagnetic and RF circuit co-simulation. J Magn Reson 2009;200:147–52.10.1016/j.jmr.2009.06.005Search in Google Scholar PubMed
23. Christ, A, Kainz, W, Hahn, EG, Honegger, K, Zefferer, M, Neufeld, E, et al.. The virtual family – development of surface-based anatomical models of two adults and two children for dosimetric simulations. Phys Med Biol 2010;55:N23–38.10.1088/0031-9155/55/2/N01Search in Google Scholar PubMed
24. Hasgall, PA, Di Gennaro, F, Baumgartner, C, Neufeld, E, Lloyd, B, Gosselin, MC, et al.. IT’IS Database for thermal and electromagnetic parameters of biological tissues, Version 4.1. 2022. https://doi.org/10.13099/VIP21000-04-1.Search in Google Scholar
25. International Electrotechnical Commission (IEC), Institute of Electrical and Electronics Engineers (IEEE). Determining the peak spatial-average specific absorption rate (SAR) in the human body from wireless communications devices, 30 mhz to 6 ghz – part 1: general requirements for using the finite-difference time-domain (fdtd) method for sar calculations. IEC/IEEE 62704-1:2017. Geneva: IEC; 2017.Search in Google Scholar
26. Collins, CM, Li, S, Smith, MB. SAR and B1 field distributions in a heterogeneous human head model within a birdcage coil. Magn Reson Med 1998;40:847–56. https://doi.org/10.1002/mrm.1910400610.Search in Google Scholar PubMed
27. Collins, CM, Smith, MB. Calculations of B1 distribution, SNR, and SAR for a surface coil adjacent to an anatomically-accurate human body model. Magn Reson Med 2001;45:692–9.10.1002/mrm.1092Search in Google Scholar PubMed
28. Fields, RE. Evaluating compliance with FCC guidelines for human exposure to radiofrequency electromagnetic fields. OET Bull 1997;65:1–57.Search in Google Scholar
29. US Federal Communications Commission. Human exposure to radiofrequency electromagnetic fields and reassessment of FCC radiofrequency exposure limits and policies. Fed Regist 2020. Available from: https://www.federalregister.gov/documents/2020/04/01/2020-02745/human-exposure-to-radiofrequency-electromagnetic-fields-and-reassessment-of-fcc-radiofrequency.Search in Google Scholar
30. Rupprecht, S, Sica, CT, Chen, W, Lanagan, MT, Yang, QX. Improvements of transmit efficiency and receive sensitivity with ultrahigh dielectric constant (uHDC) ceramics at 1.5 T and 3 T. Magn Reson Med 2018;79:2842–51.10.1002/mrm.26943Search in Google Scholar PubMed PubMed Central
31. Wu, X, Zhang, X, Tian, J, Schmitter, S, Hanna, B, Strupp, J, et al.. Comparison of RF body coils for MRI at 3 T: a simulation study using parallel transmission on various anatomical targets. NMR Biomed 2015;28:1332–44. https://doi.org/10.1002/nbm.3378.Search in Google Scholar PubMed PubMed Central
32. Yao, A, Murbach, M, Goren, T, Zastrow, E, Kainz, W, Kuster, N. Induced radiofrequency fields in patients undergoing MR examinations: insights for risk assessment. Phys Med Biol 2021;66:185014. https://doi.org/10.1088/1361-6560/ac212d.Search in Google Scholar PubMed
33. Vincent, DE, Wang, T, Magyar, TA, Jacob, PI, Buist, R, Martin, M. Birdcage volume coils and magnetic resonance imaging: a simple experiment for students. J Biol Eng 2017;11:1–7. https://doi.org/10.1186/s13036-017-0084-1.Search in Google Scholar PubMed PubMed Central
34. Guérin, B, Gebhardt, M, Serano, P, Adalsteinsson, E, Hamm, M, Pfeuffer, J, et al.. Comparison of simulated parallel transmit body arrays at 3 T using excitation uniformity, global SAR, local SAR, and power efficiency metrics. Magn Reson Med 2015;73:1137–50. https://doi.org/10.1002/mrm.25243.Search in Google Scholar PubMed PubMed Central
35. Avdievich, NI, Oh, S, Hetherington, HP, Collins, CM. Improved homogeneity of the transmit field by simultaneous transmission with phased array and volume coil. J Magn Reson Imaging 2010;32:476–81. https://doi.org/10.1002/jmri.22257.Search in Google Scholar PubMed PubMed Central
© 2024 the author(s), published by De Gruyter, Berlin/Boston
This work is licensed under the Creative Commons Attribution 4.0 International License.
Articles in the same Issue
- Frontmatter
- Editorial
- Change of publication model for Biomedical Engineering/Biomedizinische Technik
- Research Articles
- Mechano-responses of quadriceps muscles evoked by transcranial magnetic stimulation
- A type-2 fuzzy inference-based approach enables walking speed estimation that adapts to inter-individual gait patterns
- DeepCOVIDNet-CXR: deep learning strategies for identifying COVID-19 on enhanced chest X-rays
- Prediction of muscular-invasive bladder cancer using multi-view fusion self-distillation model based on 3D T2-Weighted images
- Evaluation of the RF depositions at 3T in routine clinical scans with respect to the SAR safety to improve efficiency of MRI utilization
- A software tool for fabricating phantoms mimicking human tissues with designated dielectric properties and frequency
- MedShapeNet – a large-scale dataset of 3D medical shapes for computer vision
- Concept and development of a telemedical supervision system for anesthesiology in operating rooms using the interoperable communication standard ISO/IEEE 11073 SDC