Mechano-responses of quadriceps muscles evoked by transcranial magnetic stimulation
-
Zafirah Zakaria


Abstract
Mechanomyography (MMG) may be used to quantify very small motor responses resulting from muscle activation, voluntary or involuntary. The purpose of this study was to investigate the MMG mean peak amplitude (MPA) and area under the curve (AUC) and the corresponding mechanical responses following delivery of transcranial magnetic stimulation (TMS) to the knee extensors. Fourteen adults (23 ± 1 years) received single TMS pulses at intensities from 30–80 % maximum stimulator output to elicit muscle responses in the relaxed knee extensors while seated. An accelerometer-based sensor was placed on the rectus femoris (RF) and vastus lateralis (VL) muscle bellies to measure the MMG signal. Pearson correlation revealed a positive linear relationship between MMG MPA and TMS intensity for RF (r=0.569; p<0.001) and VL (r=0.618; p<0.001). TMS intensity of ≥60 % maximum stimulator output produced significantly higher MPA than at 30 % TMS intensity and evoked measurable movement at the knee joint. MMG MPA was positively correlated to AUC (r=0.957 for RF and r=0.603 for VL; both p<0.001) and knee extension angle (r=0.596 for RF and r=0.675 for VL; both p<0.001). In conclusion, MMG captured knee extensor mechanical responses at all TMS intensities with the response increasing with increasing TMS intensity. These findings suggest that MMG can be an additional tool for assessing muscle activation.
Introduction
Patients with neurological deficits often struggle with impaired motor function which includes decreased range of motion (ROM) and muscle weakness. Apart from measurement of ROM or muscle activity using electromyography, the common practice of monitoring or assessing muscle improvements among clinicians is to perform manual muscle testing [1]. Manual muscle testing is one method to identify joint ROM impairments which can be caused by factors such as muscle tightness or inability to activate all contractile fibres [2]. Joint movement is preceded by muscular contraction as specific cortical neurons transmit action potentials along the corticospinal tract and motor neurons to the muscle fibres, leading to force production [3] and mechanical vibrations [4].
Experimental evaluation of muscle mechanical performance uses indicators such as ROM and force measured by dynamometers [5] and force transducers [6], 7]. Researchers measure muscle contraction and limb movement, whereby the bones act as a lever for the muscles to act around the joints to produce angular movements [8]. Dynamometers and force transducers measure the resultant force at the end effector; however, measurement of low force levels before a contraction can be observed in the muscle is problematic, especially in persons with neurological deficits. Therefore, instead of quantifying the resultant force produced at the end-effector during a contraction, having transducers at the skin surface of the muscle, i.e. measuring the muscle acceleration or muscle vibrations, could provide more information about what is happening at the muscle level.
One potential tool that has been reported to be sensitive to subtle changes of muscle contractile function is mechanomyography (MMG). It measures mechanical vibrations generated by the muscle fibres and acts as a proxy of muscle force [9], 10]. MMG has the potential to detect even the slightest change in vibrations of the muscle fibres. Reza et al. [11] found that MMG signal amplitude and area showed an increment with the increase in contraction intensity at 60 % maximum voluntary force as well as shortened onset latency. In addition, MMG has the potential to be used as a tool for investigating motor unit activation strategies across a range of contraction intensities, demonstrating that the contribution of each motor unit can be related with the pressure waves generated by active muscle fibres, detectable through MMG [11].
Understanding the mechanical vibrations of muscle fibres as part of the mechanical response to the neural drive from the brain is important because it provides additional information about the contractile properties and force output of the muscle fibres [12]. MMG, which has been shown to have a high signal-to-noise ratio [13], directly measures the strength of mechanical vibrations generated by muscle fibres. MMG allows non-invasive, safe and easy to use [14] direct muscle assessment of vibrations during muscle contractions, sensitive to subtle changes in muscle function, reflecting changes in neuromuscular control. This can be particularly useful for lower-limb motor control assessment, as the motor control point for the lower limbs are located deep in the motor cortex [15]. The area of the motor cortex corresponding to the lower limbs is also much smaller than of the upper-limb muscles. The fact that both corresponding hemispheres are close together with the corresponding area including the sulcus further compounds the difficulty of lower-limb stimulation using transcranial magnetic stimulation (TMS). Weaker corticospinal projections to the knee extensors also makes it challenging to effectively stimulate them via TMS [16].
Therefore, the objective of this study was to investigate the use of MMG to quantify mechanical responses of knee extensors evoked by TMS when the muscles are at rest in healthy individuals. We hypothesized that the mechanical muscle responses of TMS particularly at lower stimulus intensities would be too small to detect and that MMG would be able to detect muscle responses across a range of TMS intensities.
Materials and methods
Subjects
Fourteen healthy participants (23 ± 1 years; 164 ± 8 cm; 68 ± 15 kg; 10 males, 4 females) volunteered to participate in this study. Written informed consent was obtained after the experiment had been fully explained. Participants were excluded if they had difficulties to perform the normal range of knee extension and if they presented with neurological conditions or contraindications to TMS [17]. This investigation complied with the tenets of the Helsinki Declaration. This study was approved by the University Malaya Medical Centre Ethics Committee (MREC ID: 2021103-10635).
Experimental procedure
Participants’ footedness was evaluated using the Waterloo Footedness Questionnaire-Revised (WFQ-R) and was observed during mobilizing tasks aimed at identifying their preferred or dominant foot for activities such as kicking and balancing [18]. Participants were seated on a platform with their lower legs hanging freely (knees in approximately 90° flexion) about 3 cm above the ground (Figure 1). All participants were right leg dominant. Participants were instructed to perform three maximum voluntary contractions (MVC) of their dominant leg with 30 s rest in between each MVC [19]. The MVC was selected as the highest MMG amplitude for each participant out of all trials.

TMS procedure which involves the double cone coil placement, position of the legs and sensor placement.
Transcranial magnetic stimulation
Transcranial magnetic stimulation was carried out on the contralateral motor cortex using a double cone coil (D110, 110 mm, peak magnetic field >1.2 T; Magstim 2002, The Magstim Company Limited, Whitland, UK) to induce an anterior-posterior current. Responses were elicited from the rectus femoris (RF) and vastus lateralis (VL) muscles.
Participants were asked to don a lycra swimming cap with a middle reference line. The nasion, inion and vertex were marked [20]. A cartesian plane of x-axis and y-axis was drawn with 1 cm between each point (Figure 2). The point with the largest RF and VL MMG responses, measured simultaneously, was used for all TMS stimulation.
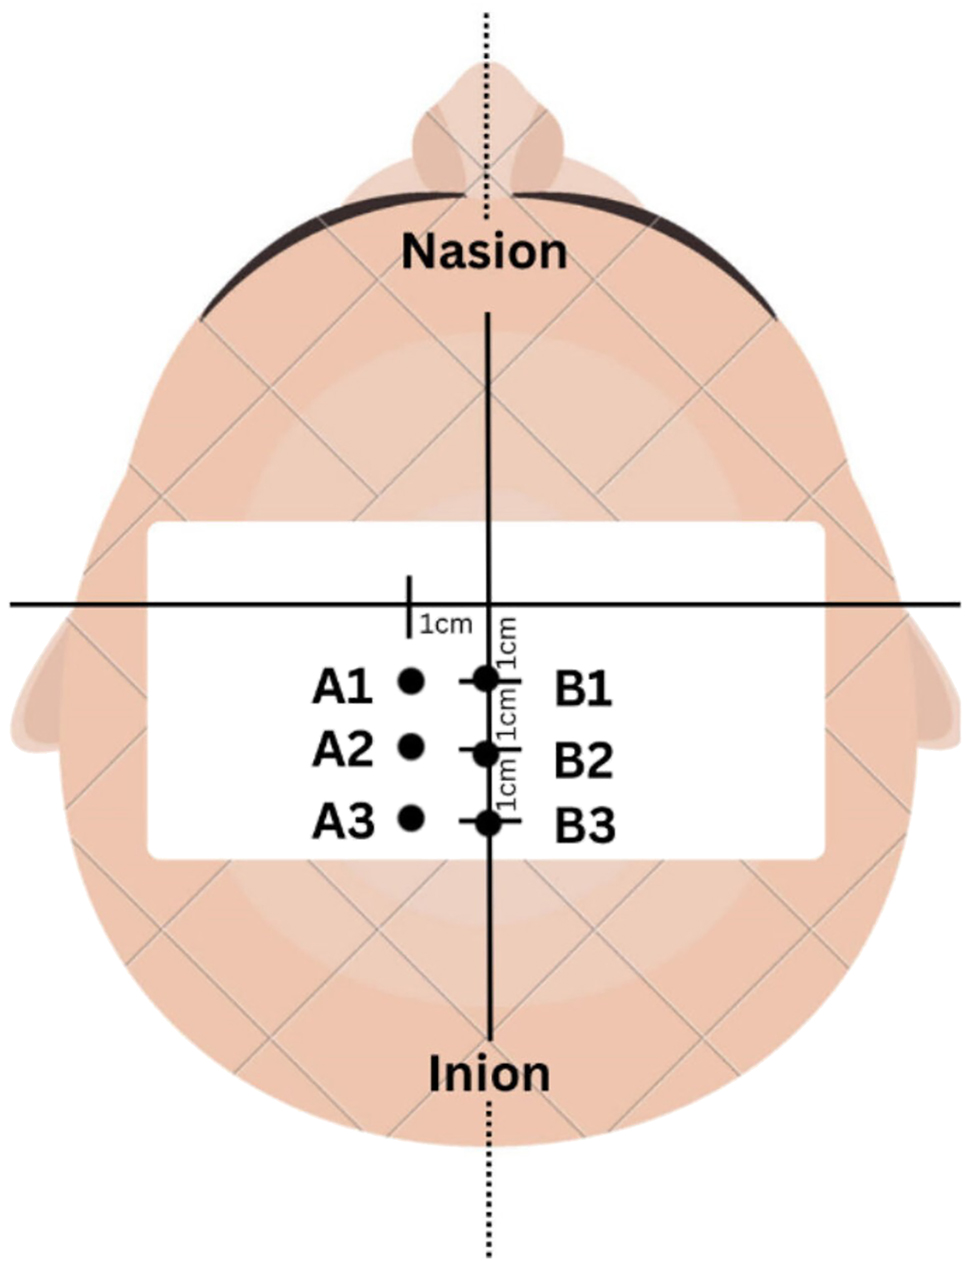
TMS stimulation at six points on the motor cortex.
In order to ensure that the mechanical vibrations measured by MMG were solely attributed to the muscle fibres and not influenced by voluntary muscle contraction, participants were instructed to remain completely relaxed during the TMS procedure and the muscles were observed to ensure that there was no visible contraction prior to TMS delivery. Five stimuli were delivered at each of 30 , 40, 50, 60, 70 and 80 % maximum stimulator output with 20 s between each stimulus.
Mechanomyography
The MMG responses to TMS were detected by two acquisition units, round-shaped accelerometers (HLT100C, BIOPAC System Inc., Goleta, CA, USA). Dedicated software (Acqknowledge 4.3.1, BIOPAC System Inc.) was used to record and store the raw MMG data on a computer for offline analyses. The accelerometers were attached by medical adhesive tape to RF and VL muscles (Figure 1). The MMG signal was recorded at a sampling rate of 2 kHz. Since the highest recorded MMG was below 100 Hz, the raw data were relayed and digitally band-pass filtered between 20 and 200 Hz, suitable for muscle stimulation [21], [22], [23].
Goniometer
A goniometer was used to measure knee extension. The goniometer’s pivot point was positioned in the centre of patella on the lateral side of the participants’ right knee joint with the stationary arm aligned with the longitudinal axis of the femur and the movable arm aligned with the longitudinal axis of the tibia. This placement ensured consistent measurement of knee extension angles throughout the study.
Data analyses
MMG mean peak amplitude (MPA) was determined from each of the five repetitions at each TMS intensity. The obtained data were normalized based on the maximum MMG MPA obtained from each participant from the MVCs. The dataset processed from the MMG signal was based on the time domain and the amplitude was identified as the voltage value. The data for MMG MPA and knee extension angle were plotted at each TMS intensity from 30 to 80 % maximum stimulator output in 10 % increments. The area under the curve (AUC) estimation for MMG MPA was calculated using the time taken from the start of the MMG increase to the end of the MMG MPA curve, estimated using a triangle formula.
All data were plotted using Microsoft Excel 2014 (Microsoft, Redmond, WA, USA).
Statistical analyses
All data were analysed using IBM SPSS Statistics 21 (SPSS Inc., Chicago, IL, USA). Normality was confirmed for all variables via the Shapiro–Wilk test (p>0.05). To assess the effect of TMS intensity (6 intensities from 30 to 80 % maximum stimulator output) on MMG MPA, MMG AUC and knee extension angle, analyses of variance (ANOVA) were conducted using the F-test. Post-hoc comparisons were conducted using Least Significance Difference (LSD) and Bonferroni if the ANOVAs identified significant effects. The correlation between MMG MPA and TMS intensities as well as with AUC was performed using Pearson correlation based on the criteria for low (0.3< r <0.5), moderate (0.5< r <0.7) and strong (0.8< r <1.0) correlations [24]. Chi-Square test was performed for the relationship between MMG MPA and knee extension angle by quantifying the extent and direction of the association between these variables.
Results
Mechanomyography mean peak amplitude at different stimulus intensities
Figure 3 illustrates the MMG MPA at each TMS intensity from 30 to 80 % maximum stimulator output. Table 1 shows that the MMG MPA for both RF and VL muscles increased with the TMS intensity. The Pearson correlation coefficient revealed a moderate positive correlation between MMG MPA and TMS intensity for RF (r=0.569, p<0.001) and VL (r=0.618, p<0.001). There was a significant effect of TMS intensity on MMG MPA for RF [F (5, 246)=29.48; p<0.001] and VL [F (5, 246)=37.64; p<0.001].

Graphical representation of MMG Mean Peak Amplitude (MPA) (vertical height of signal) and area under the curve (shaded) at different TMS intensities.
MMG MPA and area under the curve for RF and VL, maximum knee angle.
| TMS intensity (% maximum stimulator output) | MMG MPA, mV | Area under curve (mV ms) | Maximum knee angle (°) | ||
|---|---|---|---|---|---|
| RF | VL | RF | VL | ||
| 30 | 0.10 ± 0.36 | 1.04 ± 0.83 | 0.00 ± 0.00 | 0.00 ± 0.00 | 90 ± 0 |
| 40 | 0.06 ± 0.23 | 2.29 ± 1.82 | 0.00 ± 0.00 | 0.21 ± 0.15 | 90 ± 0 |
| 50 | 0.72 ± 1.16 | 1.65 ± 1.41 | 0.17 ± 0.30 | 0.25 ± 0.41 | 92 ± 4 |
| 60 | 2.95 ± 2.90a | 2.98 ± 2.11a | 0.87 ± 0.73a | 0.86 ± 0.64a | 95 ± 7a |
| 70 | 4.57 ± 3.87b | 5.04 ± 3.91b | 1.02 ± 1.39b | 1.39 ± 1.16b | 101 ± 9b |
| 80 | 7.45 ± 6.25b | 6.97 ± 5.10b | 1.95 ± 1.65b | 2.57 ± 2.21b | 107 ± 11b |
-
aStatistical significance at the 0.05 level compared to 30 % maximum stimulator output; bStatistical significance at the 0.001 level compared to 30 % maximum stimulator output. TMS, transcranial magnetic stimulation; MMG MPA, mechanomyography mean peak amplitude; RF, rectus femoris and VL, vastus lateralis.
Mechanomyography area under the curve at different stimulus intensities
A strong positive correlation was identified between RF MMG MPA and AUC (r=0.957, p<0.001) and a moderate correlation was obtained between VL MMG MPA and AUC (r=0.603, p<0.001). Table 1 shows the AUC for MMG responses at each TMS intensity. MMG AUC was larger at 60 , 70 and 80 % maximum stimulator output than at 30 % maximum stimulator output.
Knee extension angle at different stimulus intensities
There was a significant effect of TMS intensity on knee extension angle [F(5, 228)=40.996; p<0.001]. Post-hoc analysis showed significantly greater knee extension angle at 60 , 70 and 80 % maximum stimulator output compared to 30 %.
Mechanomyography mean peak amplitude and knee extension angle
A significant relationship was found between the MMG MPA and knee extension angle, based on a Chi-Square test [χ2 (840, n=234)=1,625.00, p<0.001]. Positive correlations were observed between MMG MPA and mean knee extension angle for both RF and VL muscles [RF: r=0.596; VL: r=0.675; both p<0.001].
Discussion
MMG has been widely studied to assess muscle vibrations and one common parameter used for this purpose is the MMG amplitude. A larger MMG amplitude, as reflected in higher motor unit spike amplitudes, can be associated with an increased number of active motor units [25], 26]. Under various force conditions (constant, declining, and fatiguing), the MMG signal demonstrates sensitivity by effectively tracking muscle activities and recruitment strategies of motor units [27]. Several studies have analysed MMG in relation to relative contraction intensity of the quadriceps [28], [29], [30], [31]. These investigations have revealed that in isometric muscle actions, MMG amplitude exhibits a linear or curvilinear pattern up to 100 % of MVC [31], [32], [33]. To delve further into the muscle vibrations during an evoked contraction, our study diverged from manipulating force levels and instead focused on stimulating the brain using TMS at different intensities of maximum stimulator output. By inducing different levels of neural drive, we investigated the strength of muscle contractions and analysed the corresponding MMG amplitude. Notably, we observed that higher TMS intensities led to increased MMG amplitude and even at the lowest level of stimulation when muscles are at rest, MMG MPA could be detected. The quantification of MMG MPA shows the presence of mechanical responses in the muscle following TMS stimulation. The stronger the message from the brain, the greater the muscle response shown by the MMG MPA even in the relaxed muscle state.
The MMG response curve can also be effectively analysed using time domain analysis to understand motor unit recruitment changes during muscle contractions [30], 32], 34]. Our study focused on cumulative muscle responses from a single TMS pulse, presented by the AUC. Rather than solely examining amplitude changes and peak-to-peak distances of a series of repeated stimuli [25], this approach offers a comprehensive view of total mechanical muscle responses over a particularly short duration, i.e. in the order of milliseconds. In our study, a positive correlation between TMS intensity and AUC was observed, signifying bigger mechanical responses with increasing TMS intensities. This outcome aligns with the concurrent increase in MMG activity, suggesting that a larger AUC corresponds to the recruitment of more active motor units with higher stimulation intensities.
Furthermore, the relationship between joint angle and torque production has been extensively studied in the past, indicating that the maximum torque is influenced by the isometric knee joint angle [35]. Joint angle and muscle activation are said to be related, whereby knee joint position influences quadriceps activation as measured through force and electromyography [36]. Notably, the quadriceps act as one muscle, combining their individual forces to represent overall quadriceps muscle force [37]. While Krishnan et al. [38] found a significant impact of knee joint angle on electromyographic activity, other research found lower muscle activity at shorter and longer muscle lengths, with stability around the middle length [39], 40]. Considering the interplay of joint angle, torque, and muscle activation represented by electromyographic activity, the relationship between joint angle and mechanical muscle response is worth exploring further because the mechanical component could give additional information for the muscle responses when stimulated. Future studies are needed to determine if MMG MPA and AUC are affected by the knee joint position, including with the same TMS intensity.
Previous studies have shown a linear relationship between MMG signal amplitude and extension torque, supporting the idea that MMG could serve as a proxy for muscle torque in functional movements [28]. Ibitoye and coworkers [9] suggested that a strong positive relationship between MMG signal and electrically-evoked torque production in paralyzed muscle from complete spinal cord injury may indicate the potential of MMG as a proxy for muscle torque. While not exactly comparable, our study, which delivered a single TMS pulse, also found positive correlations between knee extension angle and MMG amplitude for RF (r=0.596) and VL (r=0.675). Since the relationship between torque and knee angle has been established in previous literature [35], 41], this study suggests that the MMG MPA increment could be related to the changes in knee joint angle even though torque was not measured. However, at low stimulation intensities below 60 %, the knee extension angle was not measurable even though MMG MPA was present. This may indicate that the while the neural drive from the brain activated the motor units, it did not reach the motor unit activation threshold required for producing enough torque to alter the joint angle. Thus, this study suggested that changes in MMG MPA are related to the observed alterations in knee extension angle and more distinguishable at higher TMS intensities. Further investigation is required to understand the role of factors such as muscle composition, physical activity level and age.
Limitations
One limitation of this study is the lack of measurement of electromyography to support the findings from a physiological perspective. However, this study attempted to ensure that voluntary muscle contractions were absent as the participants were instructed to relax their muscles during TMS stimulation. Factors such as muscle contractility, elasticity, and extensibility in producing visible knee extension were not accounted for in this study. Furthermore, the participants were all healthy young adults, so the findings may not be generalizable to other age groups or individuals with neuromuscular disorders. Additionally, the study did not control for factors such as caffeine consumption, time of day, or hydration levels, which may affect muscle excitability and TMS responses [42], 43]. As the investigators did not put emphasis on the specificity of MMG sensor placement onto the muscles, factors such as skinfold and fat thickness could not be elaborated and may have affected the MMG output results. This however highlighted the versatility of MMG sensors in gathering meaningful and significant outcomes without the need of specificity of placement, as long as it is on the muscle belly.
Conclusions
This study showed that TMS intensity of ≥60 % maximum stimulator output produced significantly higher MPA than at 30 % TMS intensity and evoked measurable movement at the knee joint. Pearson correlation revealed a positive linear relationship between MMG MPA and TMS intensity for RF (r=0.569; p<0.001) and VL (r=0.618; p<0.001). MMG MPA was positively correlated to AUC (r=0.957 for RF and r=0.603 for VL; both p<0.001) and knee extension angle (r=0.596 for RF and r=0.675 for VL; both p<0.001). MMG was able to differentiate multiple levels of knee extensor mechanical vibrations when evoked by different intensities of TMS when the muscles were relaxed. MMG MPA and AUC can be used to describe the changes in physical muscle responses. However, future studies could investigate the potential of MMG with higher TMS intensities to identify any plateau effect. At this juncture, this study suggests that MMG could be an additional tool for muscle assessment by recording minute muscle responses that is still too small to reach the level of muscle contraction.
Funding source: Kementerian Pendidikan Malaysia
Award Identifier / Grant number: Fundamental Grant Research Scheme (FRGS) FRGS/1/20
-
Research ethics: This investigation complied with the tenets of the Helsinki Declaration. This study was approved by the University Malaya Medical Centre Ethics Committee (MREC ID: 2021103-10635).
-
Informed consent: Written informed consent was obtained after the experiment had been fully explained.
-
Author contributions: All authors contributed to the final approval of the version to be published; AND agree to be accountable for all aspects of the work in ensuring that questions related to the accuracy or integrity of any part of the work are appropriately investigated and resolved.
-
Competing interests: Authors declare no conflict of interest.
-
Research funding: This study was funded by the Ministry of Higher Education Malaysia through Fundamental Grant Research Scheme (FRGS) FRGS/1/2020/SKK0/UM/02/1 and ‘Yayasan Penyelidikan Otak, Minda dan Neurosains Malaysia (YPOMNM)’ Incentive Research Grant 2023 GA036-2023.
-
Data availability: The raw data can be obtained on request from the corresponding author and the first author.
References
1. Cuthbert, SC, Goodheart, GJJr. On the reliability and validity of manual muscle testing: a literature review. Chiropr Osteopat 2007;15:4. https://doi.org/10.1186/1746-1340-15-4.Search in Google Scholar PubMed PubMed Central
2. Schmitt, WHJr., Cuthbert, SC. Common errors and clinical guidelines for manual muscle testing: “the arm test” and other inaccurate procedures. Chiropr Osteopat 2008;16:16. https://doi.org/10.1186/1746-1340-16-16.Search in Google Scholar PubMed PubMed Central
3. Cavanagh, PR, Komi, PV. Electromechanical delay in human skeletal muscle under concentric and eccentric contractions. Eur J Appl Physiol Occup Physiol 1979;42:159–63. https://doi.org/10.1007/bf00431022.Search in Google Scholar
4. Esposito, F, Limonta, E, Cè, E. Time course of stretching-induced changes in mechanomyogram and force characteristics. J Electromyogr Kinesiol 2011;21:795–802. https://doi.org/10.1016/j.jelekin.2011.07.012.Search in Google Scholar PubMed
5. Samosawala, NR, Vaishali, K, Kalyana, BC. Measurement of muscle strength with handheld dynamometer in Intensive Care Unit. Indian J Crit Care Med 2016;20:21–6. https://doi.org/10.4103/0972-5229.173683.Search in Google Scholar PubMed PubMed Central
6. Pascal, M, Afshin, S, Mark de, Z, Uwe, K. Biomechanical assessments in sports and ergonomics. In: Vaclav, K, editor. Theoretical Biomechanics. Rijeka: IntechOpen; 2011. Ch 16.Search in Google Scholar
7. Bunc, M, Suput, D, Rozman, J. Force transducer for measurement of muscle contraction. J Med Eng Technol 1999;23:222–4. https://doi.org/10.1080/030919099294078.Search in Google Scholar PubMed
8. Enoka, RM. Neuromechanics of human movement. Champaign, IL: Human kinetics; 2008.Search in Google Scholar
9. Ibitoye, MO, Hamzaid, NA, Hasnan, N, Abdul Wahab, AK, Islam, MA, Kean, VS, et al.. Torque and mechanomyogram relationships during electrically-evoked isometric quadriceps contractions in persons with spinal cord injury. Med Eng Phys 2016;38:767–75. https://doi.org/10.1016/j.medengphy.2016.05.012.Search in Google Scholar PubMed
10. Ibitoye, MO, Hamzaid, NA, Abdul Wahab, AK, Hasnan, N, Olatunji, SO, Davis, GM. SVR modelling of mechanomyographic signals predicts neuromuscular stimulation-evoked knee torque in paralyzed quadriceps muscles undergoing knee extension exercise. Comput Biol Med 2020;117. https://doi.org/10.1016/j.compbiomed.2020.103614.Search in Google Scholar PubMed
11. Reza, MF, Ikoma, K, Chuma, T, Mano, Y. Mechanomyographic response to transcranial magnetic stimulation from biceps brachii and during transcutaneous electrical nerve stimulation on extensor carpi radialis. J Neurosci Methods 2005;149:164–71. https://doi.org/10.1016/j.jneumeth.2005.05.013.Search in Google Scholar PubMed
12. Ibitoye, MO, Hamzaid, NA, Zuniga, JM, Abdul Wahab, AK. Mechanomyography and muscle function assessment: a review of current state and prospects. Clin Biomech (Bristol, Avon) 2014;29:691–704. https://doi.org/10.1016/j.clinbiomech.2014.04.003.Search in Google Scholar PubMed
13. Talib, I, Sundaraj, K, Lam, CK. Association of anthropometric parameters with amplitude and crosstalk of mechanomyographic signals during forearm flexion, pronation and supination torque tasks. Sci Rep 2019;9:16166. https://doi.org/10.1038/s41598-019-52536-4.Search in Google Scholar PubMed PubMed Central
14. Woodward, RB, Stokes, MJ, Shefelbine, SJ, Vaidyanathan, R. Segmenting mechanomyography measures of muscle activity phases using inertial data. Sci Rep 2019;9:5569. https://doi.org/10.1038/s41598-019-41860-4.Search in Google Scholar PubMed PubMed Central
15. Kesar, TM, Stinear, JW, Wolf, SL. The use of transcranial magnetic stimulation to evaluate cortical excitability of lower limb musculature: challenges and opportunities. Restor Neurol Neurosci 2018;36:333–48. https://doi.org/10.3233/rnn-170801.Search in Google Scholar
16. Brouwer, B, Ashby, P. Corticospinal projections to lower limb motoneurons in man. Exp Brain Res 1992;89:649–54. https://doi.org/10.1007/bf00229889.Search in Google Scholar PubMed
17. Rossi, S, Hallett, M, Rossini, PM, Pascual-Leone, A. Screening questionnaire before TMS: an update. Clin Neurophysiol 2011;122:1686. https://doi.org/10.1016/j.clinph.2010.12.037.Search in Google Scholar PubMed
18. van Melick, N, Meddeler, BM, Hoogeboom, TJ, Nijhuis-van der Sanden, M, Van Cingel, R. How to determine leg dominance: the agreement between self-reported and observed performance in healthy adults. PloS one 2017;12. https://doi.org/10.1371/journal.pone.0189876.Search in Google Scholar PubMed PubMed Central
19. Nur, NM, Dawal, SZ, Dahari, M, Sanusi, J. Muscle activity, time to fatigue, and maximum task duration at different levels of production standard time. J Phys Ther Sci 2015;27:2323–6. https://doi.org/10.1589/jpts.27.2323.Search in Google Scholar PubMed PubMed Central
20. Temesi, J, Gruet, M, Rupp, T, Verges, S, Millet, GY. Resting and active motor thresholds versus stimulus-response curves to determine transcranial magnetic stimulation intensity in quadriceps femoris. J NeuroEng Rehabil 2014;11:40. https://doi.org/10.1186/1743-0003-11-40.Search in Google Scholar PubMed PubMed Central
21. Abd Aziz, M, Hamzaid, NA, Hasnan, N, Dzulkifli, MA. Mechanomyography-based assessment during repetitive sit-to-stand and stand-to-sit in two incomplete spinal cord-injured individuals. Biomed Tech 2020;65:175–81. https://doi.org/10.1515/bmt-2018-0200.Search in Google Scholar PubMed
22. Dzulkifli, MA, Hamzaid, NA, Davis, GM, Hasnan, N. Neural network-based muscle torque estimation using mechanomyography during electrically-evoked knee extension and standing in spinal cord injury. Front Neurorob 2018;12:50. https://doi.org/10.3389/fnbot.2018.00050.Search in Google Scholar PubMed PubMed Central
23. Ibitoye, MO, Hamzaid, NA, Zuniga, JM, Hasnan, N, Wahab, AK. Mechanomyographic parameter extraction methods: an appraisal for clinical applications. Sensors (Basel) 2014;14:22940–70. https://doi.org/10.3390/s141222940.Search in Google Scholar PubMed PubMed Central
24. Akoglu, H. User’s guide to correlation coefficients. Turk J Emerg Med 2018;18:91–3. https://doi.org/10.1016/j.tjem.2018.08.001.Search in Google Scholar PubMed PubMed Central
25. Orizio, C. Muscle sound: bases for the introduction of a mechanomyographic signal in muscle studies. Crit Rev Biomed Eng 1993;21:201–43.Search in Google Scholar
26. Yoshitake, Y, Moritani, T. The muscle sound properties of different muscle fiber types during voluntary and electrically induced contractions. J Electromyogr Kinesiol 1999;9:209–17. https://doi.org/10.1016/s1050-6411(98)00035-2.Search in Google Scholar PubMed
27. Matheson, GO, Maffey-Ward, L, Mooney, M, Ladly, K, Fung, T, Zhang, YT. Vibromyography as a quantitative measure of muscle force production. Scand J Rehabil Med 1997;29:29–35. https://doi.org/10.2340/1650197719972935.Search in Google Scholar
28. Coburn, JW, Housh, TJ, Weir, JP, Malek, MH, Cramer, JT, Beck, TW, et al.. Mechanomyographic responses of the vastus medialis to isometric and eccentric muscle actions. Med Sci Sports Exerc 2004;36:1916–22. https://doi.org/10.1249/01.mss.0000145449.14799.5f.Search in Google Scholar PubMed
29. Coburn, JW, Housh, TJ, Cramer, JT, Weir, JP, Miller, JM, Beck, TW, et al.. Mechanomyographic and electromyographic responses of the vastus medialis muscle during isometric and concentric muscle actions. J Strength Cond Res 2005;19:412–20. https://doi.org/10.1519/00124278-200505000-00029.Search in Google Scholar
30. Ebersole, KT, Housh, TJ, Johnson, GO, Evetovich, TK, Smith, DB, Perry, SR. MMG and EMG responses of the superficial quadriceps femoris muscles. J Electromyogr Kinesiol 1999;9:219–27. https://doi.org/10.1016/s1050-6411(98)00036-4.Search in Google Scholar PubMed
31. Shinohara, M, Kouzaki, M, Yoshihisa, T, Fukunaga, T. Mechanomyogram from the different heads of the quadriceps muscle during incremental knee extension. Eur J Appl Physiol Occup Physiol 1998;78:289–95. https://doi.org/10.1007/s004210050422.Search in Google Scholar PubMed
32. Beck, TW, Housh, TJ, Johnson, GO, Weir, JP, Cramer, JT, Coburn, JW, et al.. Mechanomyographic and electromyographic time and frequency domain responses during submaximal to maximal isokinetic muscle actions of the biceps brachii. Eur J Appl Physiol 2004;92:352–9. https://doi.org/10.1007/s00421-004-1110-9.Search in Google Scholar PubMed
33. Stokes, MJ, Dalton, PA. Acoustic myographic activity increases linearly up to maximal voluntary isometric force in the human quadriceps muscle. J Neurol Sci 1991;101:163–7. https://doi.org/10.1016/0022-510x(91)90041-5.Search in Google Scholar PubMed
34. Madeleine, P, Bajaj, P, Søgaard, K, Arendt-Nielsen, L. Mechanomyography and electromyography force relationships during concentric, isometric and eccentric contractions. J Electromyogr Kinesiol 2001;11:113–21. https://doi.org/10.1016/s1050-6411(00)00044-4.Search in Google Scholar PubMed
35. Marginson, V, Eston, R. The relationship between torque and joint angle during knee extension in boys and men. J Sports Sci 2001;19:875–80. https://doi.org/10.1080/026404101753113822.Search in Google Scholar PubMed
36. Saito, A, Akima, H. Knee joint angle affects EMG-force relationship in the vastus intermedius muscle. J Electromyogr Kinesiol 2013;23:1406–12. https://doi.org/10.1016/j.jelekin.2013.08.009.Search in Google Scholar PubMed
37. Akima, H, Tomita, A, Ando, R. Effect of knee joint angle on the neuromuscular activation of the quadriceps femoris during repetitive fatiguing contractions. J Electromyogr Kinesiol 2019;49:102356. https://doi.org/10.1016/j.jelekin.2019.102356.Search in Google Scholar PubMed
38. Krishnan, C, Allen, EJ, Williams, GN. Effect of knee position on quadriceps muscle force steadiness and activation strategies. Muscle Nerve 2011;43:563–73. https://doi.org/10.1002/mus.21981.Search in Google Scholar PubMed PubMed Central
39. Heloyse Uliam, K, Fábio Mícolis de, A, Luciana, SOT, Emanuelle Moraes, M, Rúben de Faria Negrão, F, Neri, A. The relationship between electromyography and muscle force. In: Mark, S, editor. EMG Methods for Evaluating Muscle and Nerve Function. Rijeka: IntechOpen; 2012. Ch 3.10.5772/25381Search in Google Scholar
40. Watanabe, K, Akima, H. Effect of knee joint angle on neuromuscular activation of the vastus intermedius muscle during isometric contraction. Scand J Med Sci Sports 2011;21:e412–20. https://doi.org/10.1111/j.1600-0838.2011.01347.x.Search in Google Scholar PubMed
41. Ruiter, C, Kooistra, R, Paalman, M, Haan, A. Initial phase of maximal voluntary and electrically stimulated knee extension torque at different knee angles. J Appl Physiol 2004;97:1693–701. https://doi.org/10.1152/japplphysiol.00230.2004.Search in Google Scholar PubMed
42. Specterman, M, Bhuiya, A, Kuppuswamy, A, Strutton, P, Catley, M, Davey, N. The effect of an energy drink containing glucose and caffeine on human corticospinal excitability. Physiol Behav 2005;83:723–8. https://doi.org/10.1016/j.physbeh.2004.09.008.Search in Google Scholar PubMed
43. Concerto, C, Infortuna, C, Chusid, E, Coira, D, Babayev, J, Metwaly, R, et al.. Caffeinated energy drink intake modulates motor circuits at rest, before and after a movement. Physiol Behav 2017;179:361–8. https://doi.org/10.1016/j.physbeh.2017.07.013.Search in Google Scholar PubMed
© 2024 the author(s), published by De Gruyter, Berlin/Boston
This work is licensed under the Creative Commons Attribution 4.0 International License.
Articles in the same Issue
- Frontmatter
- Editorial
- Change of publication model for Biomedical Engineering/Biomedizinische Technik
- Research Articles
- Mechano-responses of quadriceps muscles evoked by transcranial magnetic stimulation
- A type-2 fuzzy inference-based approach enables walking speed estimation that adapts to inter-individual gait patterns
- DeepCOVIDNet-CXR: deep learning strategies for identifying COVID-19 on enhanced chest X-rays
- Prediction of muscular-invasive bladder cancer using multi-view fusion self-distillation model based on 3D T2-Weighted images
- Evaluation of the RF depositions at 3T in routine clinical scans with respect to the SAR safety to improve efficiency of MRI utilization
- A software tool for fabricating phantoms mimicking human tissues with designated dielectric properties and frequency
- MedShapeNet – a large-scale dataset of 3D medical shapes for computer vision
- Concept and development of a telemedical supervision system for anesthesiology in operating rooms using the interoperable communication standard ISO/IEEE 11073 SDC