Bcl2 negatively regulates Protective Immune Responses During Mycobacterial Infection
-
Aayushi Singh
 ,
Vandana Anang
,
Vandana Anang

Abstract
We previously reported that M. tb on its own as well as together with HIV inhibits macrophage apoptosis by upregulating the expression of Bcl2 and Inhibitor of Apoptosis (IAP). In addition, recent reports from our lab showed that stimulation of either macrophages or BMDCs results in the significant upregulation of Bcl2. In this report, we delineate the role of Bcl2 in mediating defense responses from dendritic cells (BMDCs) during mycobacterial infection. Inhibiting Bcl2 led to a significant decrease in intracellular bacterial burden in BMDCs. To further characterize the role of Bcl2 in modulating defense responses, we inhibited Bcl2 in BMDCs as well as human PBMCs to monitor their activation and functional status in response to mycobacterial infection and stimulation with M. tb antigen Rv3416. Inhibiting Bcl2 generated protective responses including increased expression of co-stimulatory molecules, oxidative burst, pro-inflammatory cytokine expression and autophagy. Finally, co-culturing human PBMCs and BMDCs with antigen-primed T cells increased their proliferation, activation and effector function. These results point towards a critical role for Bcl2 in regulating BMDCs defense responses to mycobacterial infection.
Introduction
Tuberculosis, a multi-systemic disease with innumerable manifestations and presentations, is the most common cause of infectious disease-related mortality globally. Mycobacterium tuberculosis (M. tb), the causative agent of tuberculosis, is transmitted by the respiratory route. It is known that M. tb after entering the alveolar passages, first contacts the resident macrophages [1,2]. In addition, DCs are known to play a very important role in the early stages of infection since they display better antigen presentation properties than macrophages and play a key role in activating T lymphocytes with specific M. tb antigens [3,4,5,6,7]. Over the last several years we showed that many M. tb antigens activate BMDCs that induce responses that favor the pathogen instead of the host [8,9,10,11].
M. tb modulates macrophage survival to establish long-term infection. We reported a synergistic effect of M. tb and HIV co-infection in regulating macrophage survival. Our results identified over-expression of Bcl2 during M. tb, HIV and M. tb-HIV co-infection [12]. Therefore, in this report we attempted to characterize the role of Bcl2 in mediating immune responses from BMDCs and PBMCs during mycobacterial infection. Inhibiting Bcl2 in BMDCs prior to either mycobacterial infection or stimulation with M. tb antigen Rv3416 resulted in reduced intracellular bacterial burden in these cells. This was accompanied by an increase in ROS production, upregulation of costimulatory molecules and production of pro-inflammatory cytokines. Further co-culturing Bcl2 inhibited BMDCs with antigen-primed T cells increased their activation and effector function. These data point towards a role of Bcl2 in inhibiting host-defense responses during mycobacterial infection.
Materials and methods
Materials
Female Balb/c mice 4-6 week of age kept in a pathogen-free environment were used. Antibodies to Bcl-2 (Cat No. sc-7382), Beclin-1 (Cat No. sc-48341), ATG-5 (Cat No. sc-133158) and LC-3(Cat No. sc-398822) were procured from Santa Cruz Biotechnologies (Santa Cruz, CA). Recombinant mouse GM-CSF was purchased from R&D Systems (Minneapolis, MN, Cat No. 415-ML-010). Bcl2 specific inhibitor EM20-25 (Cat No. SML0183) and ROS sensitive dye Dichloro-dihydro-fluorescein diacetate (DCFH-DA) (Cat No. 4091-99-0) were purchased from Merck. ELISA kits for the estimation of cytokines in culture supernatants were from eBiosciences Inc. (USA). MTT dye was purchased from Invitrogen, Cat No. M6494). HiPerFect Transfection reagent used for siRNA transfection experiments was purchased from Qiagen (Cat No. 301075). BCG expressing Green Fluorescent Protein (GFP-BCG) was a kind gift from Prof. Jaya S. Tyagi, All India Institute of Medical Sciences, New Delhi, India [13].
Methods
Flow Cytometry
Mouse BMDCs or Human PBMCs were stained for the surface levels of CD80 (Mouse FITC CD80-Cat No.553768; Human FITC-CD80, Cat No. 557226), CD86 (Mouse FITC CD86-Cat No.553691; Human PE CD86-Cat No. 560957) PD-L1 (Mouse PE PD-L1, Cat No.558091; Human FITC PD-L1-Cat No. 558065), CD40 (Mouse FITC CD40-Cat No.553790; Human PE CD40-Cat No. 555589), CCR7(Mouse PE CCR7-Cat No.560682; Human PE CCR7-Cat No.560682), CD62L (Mouse PE CD62L-Cat No.553151; Human APC CD62L-Cat No.553151), CD69 (Mouse FITC CD69-Cat No.553236). Cells were analyzed by flow cytometry on FACSCalibur or FACS Aria III (BD Biosciences). The data were plotted and analyzed using CellQuest Pro or Flowjo software [14].
Enrichment of Human PBMCs
PBMCs were enriched from blood of healthy volunteers. Briefly PBMCs were isolated from the buffy coat of healthy volunteers over a Histopaque gradient. PBMCs were seeded and allowed to settle in a 5% CO2 incubator at 37°C. Post settlement, cells were then treated with 10 μM of Bcl2 Inhibitor for 1h. After 1h cells were then stimulated with Rv3416 at a concentration of 15 μg/ml and BCG at 2.5 MOI for 48 h. Cells were then stained for T cell activation markers using Fluorescence-tagged monoclonal antibodies and analyzed by flow cytometry on FACS Aria III (BD Biosciences). The data were plotted and analyzed using Flowjo Software.
Differentiation of bone marrow-derived mouse dendritic cells (BMDCs)
BMDCs were differentiated with mouse Granulocyte Macrophage Colony Stimulating Factor GM-CSF as described previously [8,15,16,17]. Briefly, 3–4 weeks old healthy female Balb/c mice were sacrificed and bone marrow from the tibias and femur was flushed out in RPMI-1640 medium. RBCs were lysed using RBC lysis buffer (10X, 12 mM NaHCO3, 155 mM NH4Cl, 0.1 mM EDTA) for 3 min. B and T lymphocytes and MHC class-II+ cells were removed by incubation with CD45R, CD90− and I-A+ coupled microbeads respectively, followed by Magnet Assisted Cell Sorting (MACS) (Miltenyi Biotech, USA). Cells were suspended in RPMI 1640 medium supplemented with 10% FBS (Gibco South American Origin) and 15 ng/ml GM-CSF along with 1 mM sodium pyruvate and 0.05 M β-mercaptoethanol. Cells were cultured for 4 days in non-coated six-well culture dishes with fresh medium added on the third day along with GM-CSF. Infections and stimulations were given after the third day. Unless otherwise stated, BMDCs were stimulated with 15 μg/ml recombinantly expressed Rv3416 or with 2.5 MOI of BCG for times mentioned above. Bcl2 Inhibitor was used at a concentration of 10 μM for 1h following standardization of optimum dose, prior to stimulation or infection (data not shown).
Measurement of intracellular reactive oxygen species (ROS)
Intracellular ROS levels were measured by flow cytometry, using the redox-sensitive dye DCFH-DA [15,18,19,20]. BMDCs were stimulated with 15 μg/ml of M. tb antigen Rv3416 or 2.5 MOI of BCG with or without Bcl2 Inhibitor for 1h. Cells were incubated with 10μM DCFH-DA in dark for 30 minutes prior to the end of each incubation period. Cells were thoroughly and quickly washed with chilled 1X PBS, given pulse spin and immediately subjected to analyses in FACSCalibur (BD Biosciences). The data were plotted and analyzed using CellQuest Pro software.
Confocal microscopy
Biotinylation of antibody
Biotinylation of antibodies was carried out as described previously [12,15,19]. Briefly, 5 μl (1 μg) of antibody to Bcl-2, Beclin-1, ATG-5 or LC-3 was diluted in 0.1 M sodium bicarbonate buffer (pH 8.5). 10 μl (10 μg of 1mg/ml N-hydroxysuccinimide ester (NHS)-Biotin was added to the diluted antibody and incubated for an hour at room temperature. Excess NHS-biotin was removed by overnight dialysis in phosphate buffer saline (1X PBS).
For monitoring intracellular survival of mycobacteria
Monitoring of intracellular mycobacterial survival was carried out as recently described [21]. Briefly, BMDCs were stimulated with 10 μM Bcl2 Inhibitor. After 1h the cells were infected with 10 MOI of GFP expressing M. bovis BCG for 72h. Cells were washed with 1X PBS post 72 h of infection to remove any extracellular bacteria. Cells were mounted on slides with Fluoroshield mounting medium containing DAPI. Single plane confocal images were acquired using a Nikon C2 laser scan confocal microscope at 60X objective magnification, a numerical aperture of 1.4, and a refractive index of 1.5. Data were analyzed using the NIS Elements Advanced Research software. The MFI numbers in bar graphs of confocal microscopy images represent Mean Fluorescence Intensity (of FITC Channel) of three experiments for all the bacteria present in multiple fields per experiment as calculated by ROI Statistics option present in the toolbar of NIS Elements Analysis Software. This is calculated by the software itself.
Measurement of Cytokines
Culture supernatants of BMDCs or BMDC:T cell co-cultures at the end of incubation period i.e. 24 h for supernatants of BMDCs and 48 h for supernatants from BMDC:T cell co-culture were analyzed for the levels of IFN-γ or TGF-β or IL-10 or IL-6 using a sandwich ELISA, as recommended by the manufacturer. Briefly, ELISA plates were coated with 100 μl/well of capture antibody overnight at 4°C. Plates were washed with 1X PBS and wells were blocked with ELISPOT diluent for 1h at room temperature. Plates were washed with 1X PBS and wells and coated with samples and standards overnight at 4°C. Plates were washed with 1X PBS and wells were coated with 100 μl/well of Detection Antibody for 1h at room temperature. Plates were washed with 1X PBS and coated with 100 μl/well of diluted Avidin HRP. Plates were sealed and incubated at room temperature for 30 min. Wells were washed with 1X PBS and incubated with 100 μl/well of 1X TMB at room temperature for 15 min. 50 μl/well of Stop solution was added to the wells and plates were read at 450nm. The sensitivity ranges for all the cytokines were between 31.2 and 2000 pg/ml. Quantitation was made against a standard curve obtained for individual cytokine standards provided by the manufacturer. Samples were correspondingly diluted to obtain values within the linear range of the standards.
siRNA mediated knockdown of Bcl2
siRNA mediated knockdown of Bcl2 mRNA (purchased from SantaCruz Biotechnology, Cat No. sc-29215) was carried out as described earlier [12,14,15]. Briefly, 3 × 10⁶ of bone marrow precursor cells from naïve mice were transfected with 60 pmoles of siRNAs against either Bcl2 or Controls siRNAs. After 4h, RPMI 1640 medium containing 10% FBS, 0.05 M 2-mercaptoethanol, 1 mM sodium pyruvate and 15 ng/ml mouse GM-CSF was added and incubated for 72 h. Cells were stimulated or infected as above and processed. Figure 2, Panel B shows the knockdown efficiency of the siRNAs used.
T cell enrichment and processing
Mice were immunized with Rv3416 (50 μg/mouse) subcutaneously at the base of the tail for one week following which T lymphocytes from inguinal lymph nodes were enriched by MACS as described earlier [8,9,22]. Cells were incubated with anti-CD11c, anti-CD11b, anti-I-A+ and anti-B220+ microbeads to remove contaminating BMDCs, macrophages, MHC-II+ cells, and B lymphocytes, respectively. The purity of the enriched T cells was checked by surface staining for CD90.2 and equaled 98%. The ratio of I-A+ cells was 0.05%. T cells were co-cultured with Rv3416 stimulated BMDCs for 48h, and T cell activation markers expression was checked by Flow cytometry. For PBMCs, cells were treated with Bcl2 Inhibitor for 1h followed by infection with 2.5 MOI BCG or stimulation with Rv3416 for 48h and T cell activation markers were checked by flow cytometry.
MTT [3-(4,5 Dimethylthiozol-2-yl)-2,5 Dipheyltetrazolium Bromide Assay
MTT assay was carried out as described recently. Briefly BMDCs were cultured in 96-well plates at 37°C by treating with Bcl2 Inhibitor followed by stimulation with Rv3416 for 24h. After the incubation period cells were washed with 1X PBS. 20 μM of MTT solution with concentration of 5 mg/ml was added to each well along with 100 μl of cell supernatant. Formazan crystals formed after 4h of incubation were then dissolved in 100 μl of Dimethyl Sulfoxide (DMSO). The absorbed intensity was recorded at 570nm with a reference wavelength of 620nm. All experiments were performed in triplicates.
Annexin V staining Assay
After the desired treatment, apoptosis and necrosis were monitored in the cells using Annexin V-Propidium Iodide (PI) staining (purchased from eBiosciences Cat No. 88-8007). Following termination of the incubation period, cells were subjected to AnnexinVAPC and PI-PE staining using manufacturer's instruction. Acquisition was done on FACSCalibur and data were plotted using CellQuest Pro software.
Recombinant protein expression
Rv3416 was expressed as described previously [12,15,19,23]. Briefly, Rv3416, was cloned in pQE31 (Qiagen) vector, and expressed as a His-tagged recombinant protein in E. coli following standard procedures. The expression of Rv3416 was observed as inclusion bodies. Protein expressed as inclusion bodies was purified by batch method with Nickel affinity column under denaturing conditions with buffers containing urea, as per the manufacturer's instructions (Qiagen). Excess urea was removed by conventional-step dialysis, with reducing concentrations of urea in 10 mM NaH2PO4 buffer (pH 8) [17,18]. Endotoxin levels were estimated and found to be less than 0.05 ng/ml.
Statistics
Statistical analysis were performed using One-way ANOVA, followed by the Bonferroni's multiple comparison post-hoc test to determine difference among various groups by GraphPad Prism 8 software (San Diego, CA, USA). A two tailed Student's t-test was also performed for experiments containing two experimental groups by GraphPad Prism 8 software (San Diego, CA, USA). Values of P<0.05 were considered as significant. Mean Fluorescence Intensities of each group were used for comparison and applied to Statistical test performed. * denotes statistical significance at P<0.05, **p<0.01, ***p<0.001 and **** p<0.0001.
Ethical statement
All experiments were conducted following approval from the institutional human and animal ethics committees of Dr. B. R. Ambedkar Centre for Biomedical Research, University of Delhi. The research related to animals’ use has been complied with all the relevant national regulations and institutional policies for the care and use of animals.
Results
Inhibition of Bcl2 attenuates bacterial survival in BMDCs
To begin with, we first monitored the expression levels of Bcl2 in murine BMDCs. As shown in Figure 1 (Panel A, C and E) stimulation of BMDCs with M. tb antigen Rv3416 significantly increased the expression levels of Bcl2. We previously identified several proteins/antigens that mediate suppressor responses [15,18,19,23]. We, therefore, investigated the role of Bcl2 under one such antigen, i.e. Rv3416 stimulation of BMDCs and PBMCs. We first looked into whether Bcl2 Inhibitor alone has any role in regulating cell survival. Then, we performed MTT assay. As shown in Figure 2 Panel A, treatment of cells with Bcl2 Inhibitor had no significant reduction in cell viability. Panel B shows the knockdown efficiency of the siRNA used in further experiments. We then monitored the growth of BCG in BMDCs following Bcl2 inhibition. We first ensured that BCG is internalized by BMDCs as a function of time. To that end we infected BMDCs with GFP-BCG and monitored the internalization by z-stacking of the cells by confocal microscopy. As shown in Supplementary Figure 1 BCG was sufficiently internalized within 6h of infection. Next, we inhibited Bcl2 either using Bcl2 Inhibitor or siRNA-based knockdown of Bcl2 followed by infection of cells with GFP expressing BCG for 72h and the intensity of fluorescence was taken as a measure of survival by confocal microscopy [24]. As shown in Figure 2 (Panel C, D & E), and Supplementary Figure 2 inhibition of Bcl2 in BMDCs with Bcl2 inhibitor significantly attenuated the growth of internalized BCG when compared with Bcl2 sufficient cells. These results clearly point towards a negative role for Bcl2 in mediating the growth of mycobacteria in BMDCs. A similar reduction in BCG burden was obtained following siRNA mediated knockdown of Bcl2 (Figure 2, Panel F, G & H).

Rv3416 stimulation of BMDCs induces higher expression of Bcl2. For Panel A BMDCs were stimulated with 15 μg/ml Rv3416 for 24h. Cells were stained with biotinylated and streptavidin FITC conjugated specific antibody to Bcl2. Confocal imaging was performed with Nikon C2 laser scan confocal microscope. Nucleus was stained with DAPI (blue). Data were analyzed using the NIS Elements Advanced Research software. Bar chart in Panel B represents the mean Fluorescence Intensity of 5 fields. P value between groups Control and Rv3416 is P<0.01. Panel C represents flow cytometric analysis of Bcl2 protein expression in BMDCs as determined by immunostaining with Streptavidin FITC labelled Bcl2 mAb upon stimulation with Rv3416 for 24h. Thick grey line represents Isotype matched Control. Shaded histogram represents unstimulated cells and thin dotted line depicts cells stimulated with Rv3416 antigen. Data shows a representative image for two independent experiments. Panel D represents Mean Fluorescent Intensities of two independent experiments on the selected groups of Panel C. P value between groups Control and Rv3416 is P<0.05. Panel E represents a representative image of immunoblot for Bcl2 in BMDCs cytoplasmic extracts at 24h following stimulation with Rv3416. Student's t-test was performed, * denotes statistical significance at P< 0.05. ** denotes statistical significance at P <0.01.

Inhibition of Bcl2 attenuates bacterial survival in BMDCs. Panel A shows cell viability following treatment with either Rv3416 or Bcl2 Inhibitor. Panel B shows knockdown efficiency of siRNA against Bcl2 (siBcl2). Total protein extracts from either Control siRNA or siBcl2 transfected cells were western blotted and probed for levels of Bcl2. Data from one of the three experiments is shown. Values shown below the immunoblot represent relative Bcl2 expression levels normalized to GAPDH in BMDCs as calculated by Densitometric analysis of the immunoblot as detailed in Materials and Methods. For Panels C,D,F&G BMDCs were infected 10 MOI GFP-BCG following either inhibition of Bcl2 with 10 μM Bcl2 Inhibitor (Panel D) or transfection with control siRNAs (siControl Panel F) or siRNA against Bcl2 (siBcl2) (Panel G) for 72h. Cells were processed for confocal microscopy performed using Nikon C2 laser scan confocal microscope. Data were analyzed using the NIS Elements Advanced Research software. Panels C&D and Panels F&G show a representative image of three experiments. Bar charts in Panel E&H represent the mean Fluorescence Intensity of two independent experiments (of 5 fields/experiment). In Panel E, P value between groups BCG and BCG+Bcl2 Inhibitor is P<0.001 and in Panel H between groups siControl+BCG and BCG+siBcl2 is P<0.001. Student's t-test was performed, *** denotes statistical significance at P <0.001.
Inhibiting Bcl2 prior to Rv3416 stimulation enhances the expression of T cell co-stimulatory molecules on BMDCs and PBMCs.
In order to investigate the role of Bcl2 in regulating the surface expression of T cell co-stimulatory molecules, we inhibited Bcl2 expression in BMDCs (Figure 3 Panels A–P) and PBMCs (Supplementary Figure 3 & Supplementary Figure 4 Panels A–R) both prior to Rv3416 or BCG stimulation. Results show that Rv3416 or BCG stimulation had no significant effect on the expression of CD80 on BMDCs, while it increased it on PBMCs. On the other hand, Rv3416 or BCG stimulation increased CD86 levels on BMDCs but not so much on PBMCs. Nevertheless, stimulation of BMDCs with either Rv3416 or BCG did not significantly affect the levels of CD40 on BMDCs and PBMCs. However, Rv3416 or BCG stimulation of BMDCs or PBMCs significantly upregulated the levels of PD-L1. LPS (Lipopolysaccharide) is a major non-protein constituent of cell walls of Gram-negative bacteria which induces strong proinflammatory responses by enhancing the production of various cytokines and chemokines, which induces antibacterial functions of phagocytes like macrophages and dendritic cells. Thus, we included LPS as a positive control in some experiments.

Inhibiting Bcl2 in Rv3416 stimulated or BCG infected BMDCs induces the expression of T cell co-stimulatory molecules on BMDCs. BMDCs were incubated with 10 μM Bcl2 Inhibitor for 1h followed by stimulation with 15 μg/ml Rv3416 or 2.5 MOI of BCG for 24h. Cells were stained either with FITC-conjugated (CD40, CD80 and CD86) or PE-conjugated (PD-L1) specific monoclonal antibodies. Grey line in Panel (A,E,I&M) represents Isotype matched control cells. Black line represents Unstimulated (Control) cells, Light blue line in Panel (A,E,I&M) indicates LPS treated cells. Green line in Panel B,F,J&N represents Rv3416 treated cells. Green line in Panel C,G,K&O represents BCG infected cells. Pink line in Panels B,F,J&N and in Panels C,G,K&O represent Bcl2 Inhibitor treated cells. Blue line in Panels B,F,J&N represents Bcl2 Inhibitor treated cells prior to Rv3416 stimulation and in Panels C,G,K&O represents Bcl2 Inhibitor treated cells prior to BCG infection. Data shows a representative image of two independent experiments. Bar chart for Panel D,H,L&P alongside the graphs represents the Mean Fluorescence Intensities (MFI) of indicated groups for all the performed experiments.. For CD80, P value between groups Rv3416 and Rv3416+Bcl2 Inhibitor is P<0.001 and between groups BCG and BCG+Bcl2 Inhibitor is P<0.001. For CD86, P value between groups Control and LPS is P<0.0001, between Control and Rv3416 is P<0.01, between groups Control and BCG is P<0.001 and between groups Rv3416 and Rv3416+Bcl2 Inhibitor is P <0.01. For PDL-1, P value between groups Control and LPS is P<0.001, between groups Control and Rv3416 is P<0.001, between Control and BCG is P<0.001, between groups Rv3416 and Rv3416+Bcl2 Inhibitor is P<0.001 and between groups BCG and BCG+Bcl2 Inhibitor is P<0.001. For CD40, P value between groups Control and LPS is P<0.0001 and between groups BCG and BCG+Bcl2 Inhibitor is P<0.0001. One way ANOVA was performed followed by Bonferroni's multiple comparison post-hoc test with 95% confidence interval. * denotes statistical significance at P <0.05, ** denotes statistical significance at P<0.01, *** denotes statistical significance at P<0.001 and **** denotes statistical significance at P<0.0001.
Inhibiting Bcl2 prior to Rv3416 stimulation significantly increased CD80 expression on BMDCs as well as PBMCs. In the case of CD86, while no significant enhancement could be observed upon Bcl2 inhibition on BMDCs, the levels did increase in the case of PBMCs in the BCG stimulated groups. On the other hand, inhibiting Bcl2 significantly increased CD40 expression following Rv3416 or BCG stimulation for both BMDCs and PBMCs. The same was also true for PD-L1, wherein inhibiting Bcl2 significantly decreased PD-L1 expression both in the case of BMDCs or PBMCs. These results indicate that Bcl2 may promote the expression of T cell inhibitory molecule PD-L1, which could attenuate productive T cell responses.
Inhibiting Bcl2 increases the production of pro-inflammatory cytokine from Rv3416 stimulated BMDCs and PBMCs
Since the profile of cytokines produced by antigen-presenting cells drives the quality of subsequent T cell responses, we next investigated the role of Bcl2 in modulating the cytokine milieu following Rv3416 stimulation. As shown in Figure 4 (Panel A–C) while Rv3416 or BCG stimulation of BMDCs increased the expression of pro-inflammatory cytokine IFN-γ by 2-fold, they enhanced the production of IL-10 and TGF-β by 3-fold, thus promoting a suppressor response. However, inhibiting Bcl2 prior to Rv3416 or BCG stimulation significantly upregulated the expression of proinflammatory cytokine IFN-γ by 4-fold and at the same time significantly reduced the expression of anti-inflammatory cytokines IL-10 and TGF-β by 2–3 fold in BMDCs. Likewise, in PBMCs (Panel D–F) Rv3416 or BCG stimulation decreased the production of proinflammatory cytokine IFN-γ and also enhanced the production of IL-10 and TGF-β. Inhibiting Bcl2 prior to either Rv3416 or BCG stimulation enhanced proinflammatory cytokine IFN-γ production and at the same time decreased the production of suppressor cytokines IL-10 and TGF-β. The collective results in Figure 4 indicate that Bcl2 plays a negative role in regulating the T cell stimulatory capacity of BMDCs and PBMCs as measured by the levels of co-stimulatory molecules. The altered cytokine profile may contribute towards the generation of pro-inflammatory T cell responses.

Inhibiting Bcl2 in Rv3416 stimulated or BCG infected BMDCs and PBMCs increases the production of pro-inflammatory cytokine. BMDCs (Panels A–C) or PBMCs (Panels D–F) were incubated with 10 μM Bcl2 Inhibitor for 1h followed by stimulation with 15 μg/ml Rv3416 or 2.5 MOI BCG for 24h and culture supernatants were analyzed for the levels of the cytokines by ELISA. Three independent experiments were performed and bar charts represent the mean values for all the performed experiments. For Panel A, P value between groups Control and Rv3416 is P<0.001, between groups Control and BCG is P<0.0001, between groups Rv3416 and Rv3416+Bcl2 Inhibitor is P<0.0001 and between groups BCG and BCG+Bcl2 Inhibitor is P<0.0001. For Panel B, P value between groups Control and Rv3416 is P<0.0001, between groups Control and BCG is P<0.0001, between groups Rv3416 and Rv3416+ Bcl2 Inhibitor is P<0.0001, between groups BCG and BCG+Bcl2 Inhibitor is P<0.0001. For Panel C, P value between groups Control and Rv3416 is P<0.001, between groups Control and BCG is P<0.001, between groups Rv3416 and Rv3416+Bcl2 Inhibitor is P<0.001, between groups BCG and BCG+Bcl2 Inhibitor is P<0.001. For Panel D, P value between groups Control and Rv3416 is P<0.05, between groups Control and BCG is P<0.01, between groups Rv3416 and Rv3416+Bcl2 Inhibitor is P<0.0001 and between groups BCG and BCG+Bcl2 Inhibitor is P<0.0001. For Panel E, P value between groups Control and Rv3416 is P<0.0001, between groups Control and BCG is P<0.0001, between groups Rv3416 and Rv3416+Bcl2 Inhibitor is P<0.01, between BCG and BCG+Bcl2 Inhibitor is P<0.0001. For Panel F, P value between groups Control and Rv3416 is P<0.001, between groups Control and BCG is P<0.001, between groups Rv3416 and Rv3416+Bcl2 Inhibitor is P<0.001, between groups BCG and BCG+Bcl2 Inhibitor is P<0.001. One way ANOVA was performed followed by Bonferroni's multiple comparison post-hoc test with 95% confidence interval. * denotes statistical significance at P <0.05, ** denotes statistical significance at P <0.01, *** denotes statistical significance at P<0.001 and **** denotes statistical significance at P<0.0001.
Inhibiting Bcl2 enhances oxidative burst in dendritic cells and PBMCs.
We next investigated the generation of oxidative burst in BMDCs and PBMCs upon inhibiting Bcl2. As shown in Figure 5 and consistent with our earlier reports [12,23], stimulation with Rv3416 or BCG infection of BMDCs inhibited basal levels of ROS in BMDCs (A–C) and also marginally reduced the same in PBMCs (D–E). However, inhibiting Bcl2 significantly reversed ROS inhibition by Rv3416 or BCG in BMDCs and PBMCs and increased the levels either equal to or over and above unstimulated BMDCs. These results showed that inhibiting the expression of Bcl2 in BMDCs and PBMCs prior to antigenic stimulation increased ROS generation that could contribute to their functional responses. We have also verified the mode of cell death in the inhibitor plus Rv3416 treated cells by Annexin V staining assay. As shown in Figure 5 Panel H, an increase in the positive population for Annexin V staining was observed in Bcl2 inhibited and Rv3416 stimulated cells compared to unstimulated (Figure 5 Panel F) or Rv3416 stimulated cells (Figure 5 Panel G). The results presented that Bcl2 inhibition could promote apoptosis in antigen stimulated cells. These data are consistent with our previous report on the role of Rv3416 and HIV antigen Nef-1 in regulating macrophage cell survival [12].

Inhibiting Bcl2 in Rv3416 stimulated BMDCs and PBMCs induces oxidative burst. Either BMDCs (Panel A–C) or PBMCs (Panel D&E) were incubated with 10 μM Bcl2 Inhibitor for 1h followed by stimulation with 15 μg/ml Rv3416 for 1h. For Panel C BMDCs were transfected with either Control siRNAs (Panel C) or Bcl2 specific siRNAs prior to Rv3416 stimulation. ROS levels were monitored by flow cytometry. Shaded histogram in all the Panels represents unstimulated cells. Thin Grey line in Panels A,B,D&E represent Bcl2 Inhibitor treated cells. Thin Grey line in Panel C represents Control siRNA treated cells. Dotted line in Panels A&D represents Rv3416 treated cells. Dotted line in Panels B,C&E represents BCG infected cells. Thick Black line in Panels A&D represents Rv3416+Bcl2 inhibitor treated cells. Thick Black line in Panels B&E represents BCG+Bcl2 inhibitor treated cells. Thick Black line in Panels C represents BCG+siBcl2 treated cells. Data shows a representative image of two independent experiments. Bar charts below each histogram represents Mean Fluorescence Intensity of the groups as a mean of two independent experiments. For Panel A, Control and Rv3416 is P<0.01, between groups Rv3416 and Rv3416+Bcl2 Inhibitor is P<0.01. For Panel B, Control and BCG is P<0.001, between BCG and BCG+Bcl2 Inhibitor is P<0.01. For Panel C, siControl and BCG is P<0.0001, BCG and BCG+siBcl2 is P<0.0001. For Panel D, P value between groups Rv3416 and Rv3416+Bcl2 Inhibitor is P<0.01. For Panel E, BCG and BCG+Bcl2 Inhibitor is P<0.01. One way ANOVA was performed followed by Bonferroni's multiple comparison post-hoc test with 95% confidence interval. * denotes statistical significance at P <0.05. ** denotes statistical significance at P< 0.01, *** denotes statistical significance at P< 0.001 and **** denotes statistical significance at P< 0.0001. For Panels F-H BMDCs were either unstimulated (Panel F, Control) or stimulated with 15 μg/ml Rv3416 (Panel G) or Rv3416+Bcl2 Inhibitor treated cells (Panel H) for 24h. Cells were stained for Propidium Iodide and Annexin V-APC. Values within the dot plots represent Annexin V-APC positive cells. Data shows a representative image of three experiments. Bar charts in Panel I represent the Mean Fluorescence Intensities (MFI) the dot plots in Panels (F–H) as a mean of three independent experiments on the described groups.
Inhibiting Bcl2 enhances expression of autophagy markers ATG-5, Beclin-1 and LC-3 in BMDCs
In the next set of experiments, we investigated if the inhibition of autophagy by Rv3416 also involves the role of Bcl2. To that end, we monitored the expression levels of three key molecules in the autophagy pathway, namely ATG-5, Beclin-1 and LC-3. While Beclin-1 is an initiator molecule of autophagy, ATG-5 works towards enhancing autophagosome formation and associated processes [25]. As shown in Figure 6 Panel A and Panel B, Rv3416 stimulation did not result in appreciable change in the levels of ATG-5 expression, but BCG stimulation did reduce the levels. Inhibiting Bcl2 significantly enhanced the levels of ATG-5 upon Rv3416 or BCG stimulation. In the case of Beclin-1, inhibiting Bcl2 prior to Rv3416 and BCG stimulation marginally enhanced the levels. Additionally, incubating BMDCs with autophagy inhibitor 3-MA (that blocks autophagosome formation by inhibiting class III PI-3K) [26], in either Rv3416+Bcl2 inhibitor or BCG+Bcl2 Inhibitor groups reversed the effects of Bcl2 inhibition. These results illustrated a role for Bcl2 in modulating autophagy in a manner similar to 3-MA treatment. Furthermore, we also monitored LC-3 puncta in the above groups. As shown in Figure 6 Panel E, inhibiting Bcl2 increased the formation of LC-3 puncta in BMDCs that was once again reversed upon treatment with 3-MA.

Inhibiting Bcl2 induces autophagy in Rv3416 stimulated BMDCs. For Panel A&C, BMDCs were incubated with 10 μM Bcl2 Inhibitor for 1h (Sub-Panels d,f,g,h&i) followed by stimulation with 15 μg/ml Rv3416 (Sub-Panels b,f&h) or infection with 2.5 MOI of BCG for 24h (Sub-Panels c,g&i). Sub-Panels e,h&i cells were treated with 10 μM 3-MA prior to stimulation with either Rv3416+Bcl2 Inhibitor (Sub-Panel h) or BCG+Bcl2 Inhibitor (Sub-Panel i). Cells were stained with biotinylated and FITC conjugated specific antibodies to ATG-5 (Panel A) or Beclin-1 (Panel C). For Panel E cells were incubated with 10 μM Bcl2 Inhibitor with or without 3-MA for 1h followed by infection with 2.5 MOI of GFP-BCG for 24h. Cells were stained with biotinylated and PE conjugated antibody to LC-3. Nucleus of the cells was stained with DAPI (blue). Confocal imaging was performed with Nikon C2 laser scan confocal microscope. Data were analyzed using the NIS Elements Advanced Research software. Data shows a representative image of two independent experiments. Bar charts in Panel B&D represent the mean Fluorescence Intensity of two independent experiments (of 5 fields/experiment) for each panel. For Panel A, P value between groups Rv3416 and Rv3416+ Bcl2 Inhibitor is P<0.05, between groups BCG and BCG+Bcl2 Inhibitor is P<0.01. One way ANOVA was performed followed by Bonferroni's multiple comparison post-hoc test with 95% confidence interval for ATG-5. * denotes statistical significance at P<0.05. ** denotes statistical significance at P<0.01.
Bcl2 inhibited BMDCs activate T cells for effector function
Since a major function of BMDCs is to stimulate productive T cell responses, in the next set of experiments we investigated the role of Bcl2 inhibited BMDCs to modulate T cell activation and function. To begin with we first investigated the cytokine profile during DC:T cell interaction. To that end, Bcl2 was inhibited in BMDCs followed by stimulation with Rv3416 for 24 h. These BMDCs were then co-cultured with T cells enriched from Rv3416 immunized mice. Levels of cytokines were measured in the co-culture. As shown in Figure 7, T cells from Rv3416 or BCG stimulated BMDCs produced low levels of IFN-γ. They, however, produced higher levels of IL-10 and TGF-β. However, inhibition of Bcl2 prior to Rv3416 or BCG stimulation significantly enhanced the expression levels of IFN-γ and IL-6, while effectively decreasing the levels of IL-10 and TGF-β.

Bcl2 inhibited and Rv3416 stimulated BMDCs induce pro-inflammatory Th1 responses from interacting T cells. BMDCs were incubated with 10μM Bcl2 Inhibitor for 1h followed by stimulation with 15 μg/ml Rv3416 for 24h. BMDCs were then co-cultured for 48h with T cells enriched from inguinal lymph nodes from naive and Rv3416 immunized Balb/c mice. Culture supernatants were analyzed for the levels of the cytokines by ELISA. Group 1 represents BMDCs, Group 2 represents BMDCs+naive T cells, Group 3 represents Bcl2 Inhibitor treated BMDCs+naive T cells, Group 4 represents Rv3416 stimulated BMDCs+naive T cells, Group 5 represents Rv3416+Bcl2 Inhibitor stimulated BMDCs+ naive T cells. Group 6 represents BCG stimulated BMDCs+naive T cells, Group 7 represents BCG+Bcl2 Inhibitor treated BMDCs+naive T cells, Group 8 represents Rv3416 stimulated BMDCs+Rv3416 immunized T cells, Group 9 represents Rv3416+ Bcl2 inhibitor stimulated BMDCs+Rv3416 immunized T cells, Group 10 represents BCG stimulated BCG stimulated BMDCs+BCG immunized T cells and Group 11 represents BCG+Bcl2 Inhibitor stimulated BMDCs+BCG immunized T cells for all the plotted cytokines. Data represents Mean ± SD of three independent experiments. Bar charts represent mean values for all performed experiments. For IFN-Y, P value between groups 8&9 is P<0.0001 and between groups 10 &11 is P<0.0001. For IL-10, P value between groups 8&9 is P<0.0001 and between groups 10 &11 is P<0.0001. For IL-6, P value between groups 8&9 is P<0.0001 and between groups 10 &11 is P<0.0001. For TGF-B, P value between groups 8&9 is P<0.0001 and between groups 10 &11 is P<0.0001. One way ANOVA was performed followed by Bonferroni's multiple comparison post-hoc test with 95% confidence interval.**** denotes statistical significance at P<0.0001.
In addition, we also monitored the activation levels of T cells following co-culture with BMDCs. As shown in Figure 8, T cells co-cultured with Rv3416 stimulated BMDCs had minimal expression of the activation marker CD69. However, T cells co-cultured with Bcl2 inhibited and Rv3416 stimulated BMDCs, showed significantly enhanced expression levels of CD69 as an activated phenotype. In addition, these T cells had lower expression of CCR7 and CD62L, indicating a shift from central memory to effector phenotype. Further, inhibiting Bcl2 in PBMCs also resulted in lowering the expression levels of CD62L and CCR7 on CD4+ T cells (Figure 9). Similar results were observed for CD8+T cells (Supplementary Figure 5) indicating an effector phenotype of these T cells. The increased activated phenotype of the interacting T cells could also result from decreased interactions of PD-1 on T cells with its ligand PD-L1 on BMDCs and PBMCs following Bcl2 inhibition.

Bcl2 inhibited Rv3416 stimulated BMDCs induces effector phenotype in T cells. BMDCs were incubated with 10 μM Bcl2 Inhibitor for 1h followed by stimulation with 15 μg/ml Rv3416 for 24h. BMDCs were then co-cultured for 48h with T cells enriched from inguinal lymph nodes from Rv3416 immunized Balb/c mice. Following co-culture T cells were enriched with MACS and stained for the markers either with PE conjugated (CD62L and CCR7) or FITC conjugated (CD69) specific monoclonal antibodies. Shaded histograms represent unstimulated cells, dotted line represents Rv3416 stimulated BMDCs while the thick line represents Bcl2 Inhibitor treated Rv3416 stimulated cells. Thick grey line represents Isotype matched controls. Data shows a representative image of three experiments. Bar charts below each histogram represent Mean Fluorescence Intensities (MFI) of the groups. Data represents Mean ± SD of three independent experiments. For Panel A, P value between groups Unstimulated and Rv3416 is P<0.05, between Rv3416 and RFv3416+Bcl2 Inhibitor is P<0.0001. For Panel B, P value between groups Unstimulated and Rv3416 is P<0.01 and between groups Rv3416 and Rv3416+Bcl2 Inhibitor is P<0.01. For Panel C, P value between groups Unstimulated and Rv3416 is P<0.05 and between Rv3416 and Rv3416+Bcl2 Inhibitor is P<0.01. One way ANOVA was performed followed by Bonferroni's multiple comparison post-hoc test with 95% confidence interval. * denotes statistical significance at P<0.05. ** denotes statistical significance at P<0.01 and **** denotes statistical significance at P<0.0001.
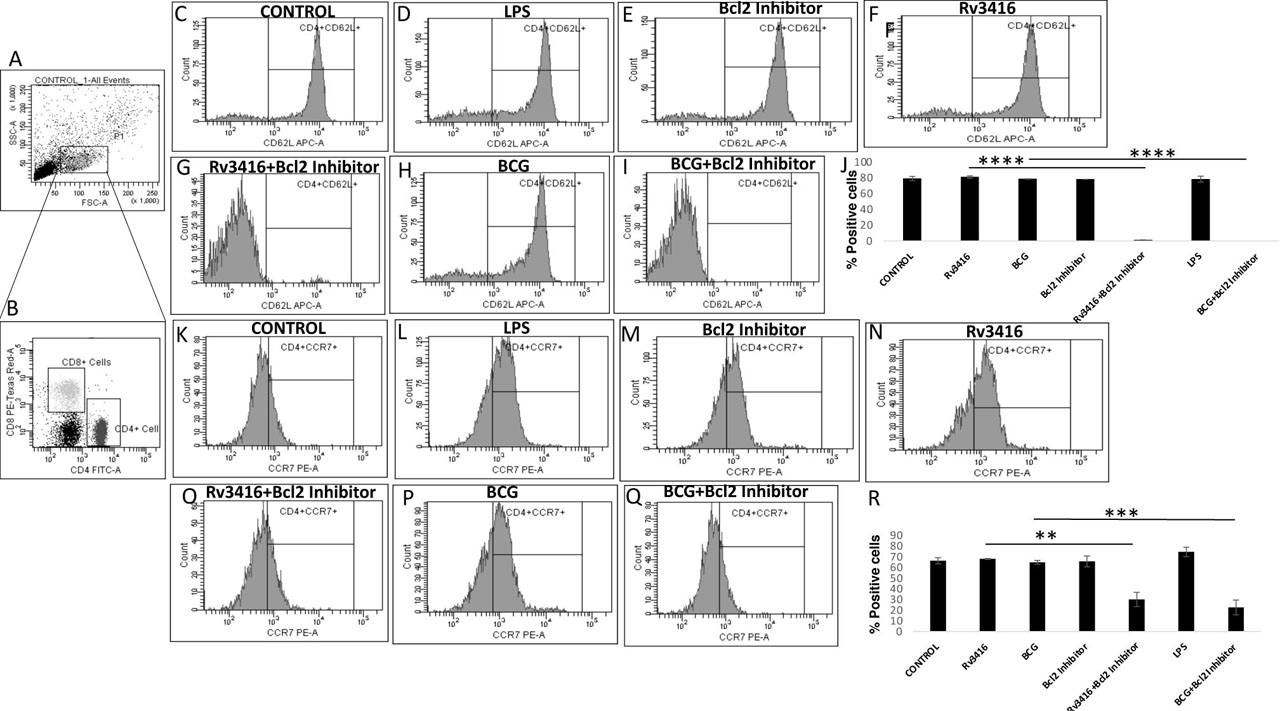
Bcl2 inhibited Rv3416 stimulated PBMCs induces effector phenotype in CD4+T cells. PBMCs enriched from blood of healthy volunteers were treated with 10μM Bcl2 inhibitor (Panels E,G,I,M,O,Q) or LPS (Panels D&L) for 1h followed by stimulation with 15 μg/ml Rv3416 (Panels F,G,N,O) or infection with BCG 2.5 MOI (Panels H,I,P&Q) for 48h. Cells were processed for flow cytometry on BD-FACS Aria III. Panel A shows the lymphocyte population gated on FSC and SSC. Panel B shows the CD4+ (FITC) and CD8+T (PE-Texas-Red) cells from the gated population in Panel A. CD4+T cells were stained either with APC conjugated CD62L (Panel C–I) and PE conjugated CCR7 specific monoclonal antibodies (Panel K-Q). The data were plotted and analyzed using BD-FACS Diva Software version 6.1.3 (BD Biosciences, USA). Y axis in Panels C to I and Panels K to Q represent counts as plotted by the flow cytometer. Y axis in Panels J&R represent percent positive cells within the marker in each histogram as calculated by the flow cytometer. Bar charts in Panels J&R represent Mean Fluorescence Intensities (MFI) of Panel C–I and Panel K-Q, respectively. Data shows a representative image of two experiments. Data represents Mean ± SD of two independent experiments. In Panel J, P value between groups Rv3416 and Rv3416+Bcl2 Inhibitor is P<0.0001 and between groups BCG and BCG+Bcl2 Inhibitor is P<0.0001. In Panel R, P value between groups Rv3416 and Rv3416+Bcl2 Inhibitor is P<0.01 and between groups BCG and BCG+Bcl2 Inhibitor is P<0.001. One way ANOVA was performed followed by Bonferroni's multiple comparison post-hoc test with 95% confidence interval. ** denotes statistical significance at P<0.01. *** denotes statistical significance at P<0.001. **** denotes statistical significance at P<0.0001.
We further extended these observations to investigate the effector functions of Bcl2 inhibited DC-activated T cells. To that end Bcl2 inhibited or siRNA knockdown BMDCs were infected with BCG and later co-cultured with T cells activated by BCG for 48 h. These T cells were enriched from the DC:T cell co-culture and later incubated with GFP-BCG infected J774 murine macrophages for 72 h. Bacterial burden was monitored by confocal microscopy. As shown in Figure 10, T cells primed with Bcl2 inhibited BMDCs effectively helped infected macrophages to significantly reduce BCG growth. These results clearly demonstrated the ability of Bcl2 to mediate T cell effector functions.

T cells activated by Bcl2 deficient BMDCs reduce bacterial burden in macrophages. BMDCs were treated or not with 10 μM Bcl2 Inhibitor (Panel B) or siBcl2 (Panel E) prior to infection with 2.5 MOI BCG for 24h. These BMDCs were co-cultured for 48h with BCG immunized T cells. T cells were then enriched from the BMDC:T cell co-culture by MACS and incubated with 10 MOI GFP-BCG infected J774 murine macrophages for 72h. Bacterial burden was monitored by confocal microscopy. Data shows a representative image of three experiments. Bar charts in Panel C&F represent the Mean Fluorescence Intensities (MFI) for two independent experiments (of 5 fields/experiment). Data represents Mean ± SD of two independent experiments. For Panel C, P value between groups GFP BCG and GFP BCG+Bcl2 Inhibitor. For Panel F, P value between groups si Control+GFP BCG and GFP BCG+siBcl2 is P <0.001. Student's t-test was performed. ** denotes statistical significance at P< 0.01, *** denotes statistical significance at P<0.001.
Discussion
The successful evolution of Mycobacterium tuberculosis (M. tb) the causal organism for tuberculosis coupled with the emergence of drug resistance in the pathogen needs a deeper understanding of immune responses. M. tb expresses several molecules and proteins to prevent its recognition and destruction by host immune cells. Bacillus Calmette Guerin or BCG is the only licensed vaccine against TB. While it is effective in providing protection in childhood, it shows high variability in efficacy against pulmonary TB in adults. Some of the current vaccine candidates under various stages of clinical trials include an attenuated strain of BCG, Modified Vaccinia Virus Ankara expressing M. tb 72 kDa protein (MVA72) [27], BCGδUreaseLLO+ that has the Urease gene deleted along with expression of Listeriolysin O antigen that ensures phagolysosome fusion and CD8+ T cell responses [28]. Due to the variable efficacy of BCG and the unavailability of a better vaccine as on date a better understanding of the innate, adaptive mechanisms of protection would facilitate the development of more effective vaccines. To that end work in our lab done so far has led to the identification of regulators and control switches in BMDCs and macrophages that dictate the nature of responses culminating in either effective clearance or exacerbation of the disease [15,17,20]. Here we have identified yet another control switch namely Bcl2 that might regulate these responses. We and others have previously reported that M. tb and its antigens alter the expression of apoptosis-regulating proteins that include Bcl2, Cytochrome C and Bax in macrophages. Another recent report showed high expression of Bcl2 in brain tuberculosis [29]. In this paper they reported that there is higher Bcl2 expression in astrocytes of infected brain tissues compared to control tissues, which promoted higher anti-apoptotic activity in astrocytes. Accordingly, we had posed a hypothesis that Bcl2 might play a more determinant role in regulating immune responses during mycobacterial infection in addition to regulating cell survival [15,30]. We, therefore, explored the role of Bcl2, beyond its classical function in regulating cell survival, in regulating protective responses to mycobacteria in BMDCs. Dendritic cells are the most potent professional antigen-presenting cells for priming naïve T cells and are highly efficient in inducing antimicrobial and anti-tumor immune responses [31]. On the other hand, macrophages are the preferred cell types for mycobacteria to establish long-term successful infection [32,33].
To begin with, we first investigated if inhibiting Bcl2 would have any effect on the ability of BMDCs to reduce growth of intracellular bacteria. Our data shows that inhibition of Bcl2 significantly attenuated bacterial burden in BMDCs. Several studies have shown that M. tb inhibits macrophage apoptosis as a strategy to increase the lifespan of the infected macrophages [34]. This allows the pathogen to survive for longer periods of time and thus establish long term persistent infections. We here show that increased expression of Bcl2 is another mechanism by which mycobacteria modulates the survival of infected cells.
It has been reported that mycobacteria inhibit several aspects of T cell functions to suppress productive T cell responses. These include modulating the surface densities of costimulatory molecules inhibition of IFN-γ and IL-12 expression from infected DC's or macrophages [35]; induction and activation of regulatory T cell subsets. Our data on the profiles of co-stimulatory molecules showed that inhibiting Bcl2 increased the maturation phenotype of BMDCs as reflected by an increase in the surface densities of key molecules like CD80, CD86, and CD40. All these molecules promote productive T cell responses. While CD80 and CD86 induce T cell proliferation by engaging with CD28 on T cells [36,37], CD40 regulates the quality of T cell responses by regulating the production of IL-12 from both BMDCs via engagement with CD40L on T cells (38). Interestingly, inhibiting Bcl2 very significantly brought down the levels of the T cell inhibitory molecule PD-L1. PD-L1 via its engagement with its ligand PD-1 on T cells induces T cell anergy and apoptosis of T cells [39,40]. This was true for both mouse BMDCs as well as human PBMCs. Many studies document the role of pathogens including mycobacteria in increasing the surface expression of PD-L1 on infected cells [21,41,42]. We also recently showed that Streptococcus pneumoniae antigen PSP-A increased the expression of PD-L1 on BMDCs. This increase in PD-L1 regulated the survival of the pathogen in BMDCs [14]. Inhibited Bcl2 also negatively affected PD-L1 expression on BMDCs as well as PBMCs upon Rv3416 or BCG infection. Inhibiting Bcl2 promoted the secretion of pro-inflammatory and T helper cell 1 (Th1) cytokine IFN-γ and effectively inhibited the production of anti-inflammatory cytokines IL-10 and TGF-β. It is established that the profile of cytokines from antigen-presenting cells drives the quality of subsequent T cell responses. Importantly, incubation of T cells activated by Bcl2 inhibited BMDCs in turn activated infected macrophages to effectively reduced bacterial burden. These results clearly point towards a long-lasting effect of Bcl2 inhibition in BMDCs and point towards a new role for Bcl2 in regulating protective responses.
Mycobacteria also inhibit several defense responses of the host. These include inhibition of oxidative burst, inhibition of Autophagy [20,25,43,44]. We have showed that inhibition of Bcl2 also decreased ROS levels, thus it contributed to immune suppression. Elevation of ROS is a potent defense mechanism of DCs and macrophages [45,46]. Over the years, our lab has shown that mycobacteria inhibit ROS that involves tweaking calcium homeostasis [12,20]. We showed that activation of voltage-gated calcium channels declined ROS in macrophages [20]. In addition, we also showed that the route of calcium homeostasis differentially regulates ROS levels during HIV-M. tb co-infection [12].
It is now established that autophagy is a potent anti-bacterial and anti-mycobacterial response [47,48]. We also showed earlier that Rv3416 inhibits autophagy responses in BMDCs [18]. Inhibition of Bcl2 also induced increased apoptosis and autophagy by Rv3416 as well as BCG infection. We and others have previously shown that M. tb and many of these antigens promote cell survival by decreasing apoptosis [12,49,50,51] and attenuating autophagy [18,19,20]. Inhibition of Bcl2 enhanced apoptosis as well as induced autophagy reducing the mycobacterial burden in BMDCs.
Our data on extended roles of Bcl2 in mediating inhibition of oxidative burst, inhibition of productive and effector T cell responses further provide insights to the role of Bcl2 beyond its classical reported functions. This agrees with the reported functions of many such molecules. An example is that of Suppressors of Cytokines Signaling (SOCS). SOCS were initially identified to regulate cytokines responses by binding to cytokines receptors and or the JAK or STAT signaling domains and in one of our literature we reported the binding of SOCS1 to DCSIGN-R1 on BMDCs [16]. However, several reports now show that SOCS molecules now bind to many other molecules [52,53,54]. Put together, in this report, we show that mycobacteria upregulate Bcl2 expression to not only enhance the survival of BMDCs and PBMCs, but also to downregulate protective responses mounted by the host.
Acknowledgements
The authors acknowledge DST-FIST facility at Dr. B R Ambedkar Center for Biomedical Research, University of Delhi for carrying out animal experiments. Authors also thank Dr. Jaya Tyagi AIIMS (New Delhi) for the kind gift of GFP expressing M. bovis BCG.
Funding information:
The study was funded by core grants to KN from the University of Delhi. AS is a recipient of Senior Research Scholarship from Lady Tata Memorial Trust, Ministry of Science and Technology, Government of India and VA is a recipient of Senior Research Fellowship from University Grants Commission, Government of India.
Author Contributions:
AS, VA and KN proposed the hypothesis and designed the experiments. AS, VA, SSS, AKR, UB, CV, AC performed the various experiments. AS, VA and KN analyzed the data. AS and KN wrote the manuscript. AS and VA contributed equally to the work.
Conflict of interest:
Authors state no conflict of interest
Data Availability Statement:
All data generated or analyzed during this study are included in this published article and its supplementary information files.
References
1 Smith I. Mycobacterium tuberculosis pathogenesis and molecular determinants of virulence. Clin Microbiol Rev. 2003 Jul;16(3):463–96.10.1128/CMR.16.3.463-496.2003Search in Google Scholar PubMed PubMed Central
2 Tascon RE, Soares CS, Ragno S, Stavropoulos E, Hirst EM, Colston MJ. Mycobacterium tuberculosis-activated dendritic Aayushi Singh et al: Bcl2 negatively regulates Protective Immune Responses During Mycobacterial Infection cells induce protective immunity in mice. Immunology. 2000 Mar;99(3):473–80.10.1046/j.1365-2567.2000.00963.xSearch in Google Scholar PubMed PubMed Central
3 Giacomini E, Iona E, Ferroni L, Miettinen M, Fattorini L, Orefici G, et al. Infection of human macrophages and dendritic cells with Mycobacterium tuberculosis induces a differential cytokine gene expression that modulates T cell response. J Immunol. 2001 Jun;166(12):7033–41.10.4049/jimmunol.166.12.7033Search in Google Scholar PubMed
4 Dulphy N, Herrmann JL, Nigou J, Réa D, Boissel N, Puzo G, et al. Intermediate maturation of Mycobacterium tuberculosis LAM-activated human dendritic cells. Cell Microbiol. 2007 Jun;9(6):1412–25.10.1111/j.1462-5822.2006.00881.xSearch in Google Scholar PubMed
5 Bodnar KA, Serbina NV, Flynn JL. Fate of Mycobacterium tuberculosis within murine dendritic cells. Infect Immun. 2001 Feb;69(2):800–9.10.1128/IAI.69.2.800-809.2001Search in Google Scholar PubMed PubMed Central
6 Hanekom WA, Mendillo M, Manca C, Haslett PA, Siddiqui MR, Barry C 3rd, et al. Mycobacterium tuberculosis inhibits maturation of human monocyte-derived dendritic cells in vitro. J Infect Dis. 2003 Jul;188(2):257–66.10.1086/376451Search in Google Scholar PubMed
7 Gonzalez-Juarrero M, Orme IM. Characterization of murine lung dendritic cells infected with Mycobacterium tuberculosis. Infect Immun. 2001 Feb;69(2):1127–33.10.1128/IAI.69.2.1127-1133.2001Search in Google Scholar PubMed PubMed Central
8 Latchumanan VK, Singh B, Sharma P, Natarajan K. Mycobacterium tuberculosis antigens induce the differentiation of dendritic cells from bone marrow. J Immunol. 2002 Dec;169(12):6856–64.10.4049/jimmunol.169.12.6856Search in Google Scholar PubMed
9 Balkhi MY, Sinha A, Natarajan K. Dominance of CD86, transforming growth factor-beta 1, and interleukin-10 in Mycobacterium tuberculosis secretory antigen-activated dendritic cells regulates T helper 1 responses to mycobacterial antigens. J Infect Dis. 2004 May;189(9):1598–609.10.1086/383328Search in Google Scholar PubMed
10 Sinha A, Singh A, Satchidanandam V, Natarajan K. Impaired generation of reactive oxygen species during differentiation of dendritic cells (DCs) by Mycobacterium tuberculosis secretory antigen (MTSA) and subsequent activation of MTSA-DCs by mycobacteria results in increased intracellular survival. J Immunol. 2006 Jul;177(1):468–78.10.4049/jimmunol.177.1.468Search in Google Scholar PubMed
11 Salam N, Gupta S, Sharma S, Pahujani S, Sinha A, Saxena RK, et al. Protective immunity to Mycobacterium tuberculosis infection by chemokine and cytokine conditioned CFP-10 differentiated dendritic cells. PLoS One. 2008 Aug;3(8):e2869.10.1371/journal.pone.0002869Search in Google Scholar PubMed PubMed Central
12 Mehto S, Antony C, Khan N, Arya R, Selvakumar A, Tiwari BK, et al. Mycobacterium tuberculosis and human immunodeficiency virus type 1 cooperatively modulate macrophage apoptosis via toll like receptor 2 and calcium homeostasis. PLoS One. 2015 Jul;10(7):e0131767.10.1371/journal.pone.0131767Search in Google Scholar PubMed PubMed Central
13 Chauhan S, Singh A, Tyagi JS. A single-nucleotide mutation in the -10 promoter region inactivates the narK2X promoter in Mycobacterium bovis and Mycobacterium bovis BCG and has an application in diagnosis. FEMS Microbiol Lett. 2010 Feb;303(2):190–6.10.1111/j.1574-6968.2009.01876.xSearch in Google Scholar PubMed
14 Vashishta M, Khan N, Mehto S, Sehgal D, Natarajan K. Pneumococal surface protein a (PspA) regulates programmed death ligand 1 expression on dendritic cells in a toll-like receptor 2 and calcium dependent manner. PLoS One. 2015 Jul;10(7):e0133601.10.1371/journal.pone.0133601Search in Google Scholar PubMed PubMed Central
15 Chadha A, Mehto S, Selvakumar A, Vashishta M, Kamble SS, Popli S, et al. Suppressive role of neddylation in dendritic cells during Mycobacterium tuberculosis infection. Tuberculosis (Edinb). 2015 Sep;95(5):599–607.10.1016/j.tube.2015.05.014Search in Google Scholar PubMed
16 Srivastava V, Manchanda M, Gupta S, Singla R, Behera D, Das G, et al. Toll-like receptor 2 and DC-SIGNR1 differentially regulate suppressors of cytokine signaling 1 in dendritic cells during Mycobacterium tuberculosis infection. J Biol Chem. 2009 Sep;284(38):25532–41.10.1074/jbc.M109.006221Search in Google Scholar PubMed PubMed Central
17 Gupta S, Salam N, Srivastava V, Singla R, Behera D, Khayyam KU, et al. Voltage gated calcium channels negatively regulate protective immunity to Mycobacterium tuberculosis. PLoS One. 2009;4(4):e5305.10.1371/journal.pone.0005305Search in Google Scholar PubMed PubMed Central
18 Singhal J, Agrawal N, Vashishta M, Priya NG, Tiwari BK, Singh Y, et al. Suppression of dendritic cell-mediated responses by genes in calcium and cysteine protease pathways during Mycobacterium tuberculosis infection. J Biol Chem. 2012 Mar;287(14):11108–21.10.1074/jbc.M111.300319Search in Google Scholar PubMed PubMed Central
19 Bandyopadhyay U, Chadha A, Gupta P, Tiwari B, Bhattacharyya K, Popli S, et al. Suppression of Toll-like receptor 2-mediated proinflammatory responses by Mycobacterium tuberculosis protein Rv3529c. J Leukoc Biol. 2017 Nov;102(5):1249–59.10.1189/jlb.4A0217-042RSearch in Google Scholar PubMed
20 Sharma D, Tiwari BK, Mehto S, Antony C, Kak G, Singh Y, et al. Suppression of protective responses upon activation of L-type voltage gated calcium channel in macrophages during Mycobacterium bovis BCG infection. PLoS One. 2016 Oct;11(10):e0163845.10.1371/journal.pone.0163845Search in Google Scholar PubMed PubMed Central
21 Singh A, Anang V, Kumar Rana A, Verma C, Surender Kumar Saraswati S, Kumari P, et al. Deciphering the role of calcium homeostasis in T cells functions during mycobacterial infection. Cell Immunol. 2020 Nov;357:104198.10.1016/j.cellimm.2020.104198Search in Google Scholar PubMed
22 Natarajan K, Latchumanan VK, Singh B, Singh S, Sharma P. Down-regulation of T helper 1 responses to mycobacterial antigens due to maturation of dendritic cells by 10-kDa mycobacterium tuberculosis secretory antigen. J Infect Dis. 2003 Mar;187(6):914–28.10.1086/368173Search in Google Scholar PubMed
23 Gupta D, Sharma S, Singhal J, Satsangi AT, Antony C, Natarajan K. Suppression of TLR2-induced IL-12, reactive oxygen species, and inducible nitric oxide synthase expression by Mycobacterium tuberculosis antigens expressed inside macrophages during the course of infection. J Immunol. 2010 May;184(10):5444–55.10.4049/jimmunol.0903283Search in Google Scholar PubMed
24 Kumar D, Nath L, Kamal MA, Varshney A, Jain A, Singh S, et al. Genome-wide analysis of the host intracellular network that regulates survival of Mycobacterium tuberculosis. Cell. 2010 Mar;140(5):731–43.10.1016/j.cell.2010.02.012Search in Google Scholar PubMed
25 Castillo EF, Dekonenko A, Arko-Mensah J, Mandell MA, Dupont N, Jiang S, et al. Autophagy protects against active tuberculosis by suppressing bacterial burden and inflammation. Proc Natl Acad Sci USA. 2012 Nov;109(46):E3168–76.10.1073/pnas.1210500109Search in Google Scholar PubMed PubMed Central
26 Mirzoeva OK, Hann B, Hom YK, Debnath J, Aftab D, Shokat K, et al. Autophagy suppression promotes apoptotic cell death in response to inhibition of the PI3K-mTOR pathway in pancreatic adenocarcinoma. J Mol Med (Berl). 2011 Sep;89(9):877–89.10.1007/s00109-011-0774-ySearch in Google Scholar PubMed
27 Nangpal P, Bahal RK, Tyagi AK. Boosting with recombinant MVA expressing M. tuberculosis α-crystallin antigen augments the protection imparted by BCG against tuberculosis in guinea pigs. Sci Rep. 2017 Dec;7(1):17286.10.1038/s41598-017-17587-5Search in Google Scholar PubMed PubMed Central
28 Lin W, Mathys V, Ang EL, Koh VH, Martínez Gómez JM, Ang ML, et al. Urease activity represents an alternative pathway for Mycobacterium tuberculosis nitrogen metabolism. Infect Immun. 2012 Aug;80(8):2771–9.10.1128/IAI.06195-11Search in Google Scholar PubMed PubMed Central
29 Othman FN, Muthuraju S, Noor SS, Abdullah S, Mohd Yusoff AA, Tharakan J, et al. Human tuberculosis brain promotes neuronal apoptosis but not in astrocytes with high expression of vascular endothelial growth factor. Tuberculosis (Edinb). 2018 Sep;112:45–51.10.1016/j.tube.2018.07.007Search in Google Scholar PubMed
30 Lee J, Hartman M, Kornfeld H. Macrophage apoptosis in tuberculosis. Yonsei Med J. 2009 Feb;50(1):1–11.10.3349/ymj.2009.50.1.1Search in Google Scholar PubMed PubMed Central
31 Reis e Sousa C, Hieny S, Scharton-Kersten T, Jankovic D, Charest H, Germain RN, et al. In vivo microbial stimulation induces rapid CD40 ligand-independent production of interleukin 12 by dendritic cells and their redistribution to T cell areas. J Exp Med. 1997 Dec;186(11):1819–29.10.1084/jem.186.11.1819Search in Google Scholar PubMed PubMed Central
32 Ganbat D, Seehase S, Richter E, Vollmer E, Reiling N, Fellenberg K, et al. Mycobacteria infect different cell types in the human lung and cause species dependent cellular changes in infected cells. BMC Pulm Med. 2016 Jan;16(1):19.10.1186/s12890-016-0185-5Search in Google Scholar PubMed PubMed Central
33 Queval CJ, Brosch R, Simeone R. The macrophage: A disputed fortress in the battle against Mycobacterium tuberculosis. Front Microbiol. 2017 Nov;8:2284.10.3389/fmicb.2017.02284Search in Google Scholar PubMed PubMed Central
34 Sia JK, Rengarajan J. Immunology of Mycobacterium tuberculosis Infections [Internet]. Microbiol Spectr. 2019 Jul;7(4): [cited 2021 May 30] Available from: http://www.asmscience.org/content/journal/microbiolspec/10.1128/microbiolspec.GPP3-0022-2018 https://doi.org/10.1128/microbiolspec.GPP3-0022-2018.10.1128/microbiolspec.GPP3-0022-2018Search in Google Scholar PubMed PubMed Central
35 Pai RK, Convery M, Hamilton TA, Boom WH, Harding CV. Inhibition of IFN-gamma-induced class II transactivator expression by a 19-kDa lipoprotein from Mycobacterium tuberculosis: a potential mechanism for immune evasion. J Immunol. 2003 Jul;171(1):175–84.10.4049/jimmunol.171.1.175Search in Google Scholar PubMed
36 Thiel M, Wolfs MJ, Bauer S, Wenning AS, Burckhart T, Schwarz EC, et al. Efficiency of T-cell costimulation by CD80 and CD86 cross-linking correlates with calcium entry. Immunology. 2010 Jan;129(1):28–40.10.1111/j.1365-2567.2009.03155.xSearch in Google Scholar PubMed PubMed Central
37 Pentcheva-Hoang T, Egen JG, Wojnoonski K, Allison JP. B7-1 and B7-2 selectively recruit CTLA-4 and CD28 to the immunological synapse. Immunity. 2004 Sep;21(3):401–13.10.1016/j.immuni.2004.06.017Search in Google Scholar PubMed
38 Ma DY, Clark EA. The role of CD40 and CD154/CD40L in dendritic cells. Semin Immunol. 2009 Oct;21(5):265–72.10.1016/j.smim.2009.05.010Search in Google Scholar PubMed PubMed Central
39 Shi L, Chen S, Yang L, Li Y. The role of PD-1 and PD-L1 in T-cell immune suppression in patients with hematological malignancies. J Hematol Oncol. 2013 Sep;6(1):74.10.1186/1756-8722-6-74Search in Google Scholar PubMed PubMed Central
40 Ostrand-Rosenberg S, Horn LA, Haile ST. The programmed death-1 immune-suppressive pathway: barrier to antitumor immunity. J Immunol. 2014 Oct;193(8):3835–41.10.4049/jimmunol.1401572Search in Google Scholar PubMed PubMed Central
41 Copland A, Sparrow A, Hart P, Diogo GR, Paul M, Azuma M, et al. Bacillus Calmette-Guérin Induces PD-L1 Expression on Antigen-Presenting Cells via Autocrine and Paracrine Interleukin-STAT3 Circuits. Sci Rep. 2019 Mar;9(1):3655.10.1038/s41598-019-40145-0Search in Google Scholar PubMed PubMed Central
42 Suarez GV, Melucci Ganzarain CD, Vecchione MB, Trifone CA, Marín Franco JL, Genoula M, et al. PD-1/PD-L1 Pathway Modulates Macrophage Susceptibility to Mycobacterium tuberculosis Specific CD8+ T cell Induced Death. Sci Rep. 2019 Jan;9(1):187.10.1038/s41598-018-36403-2Search in Google Scholar PubMed PubMed Central
43 Sinha A, Singh A, Satchidanandam V, Natarajan K. Impaired generation of reactive oxygen species during differentiation of dendritic cells (DCs) by Mycobacterium tuberculosis secretory antigen (MTSA) and subsequent activation of MTSA-DCs by mycobacteria results in increased intracellular survival. J Immunol. 2006 Jul;177(1):468–78.10.4049/jimmunol.177.1.468Search in Google Scholar PubMed
44 Bento CF, Empadinhas N, Mendes V. Autophagy in the fight against tuberculosis. DNA Cell Biol. 2015 Apr;34(4):228–42.10.1089/dna.2014.2745Search in Google Scholar PubMed PubMed Central
45 Matta SK, Kumar D. Hypoxia and classical activation limits Mycobacterium tuberculosis survival by Akt-dependent glycolytic shift in macrophages. Cell Death Discov. 2016 May;2(1):16022.10.1038/cddiscovery.2016.22Search in Google Scholar PubMed PubMed Central
46 Mittal M, Siddiqui MR, Tran K, Reddy SP, Malik AB. Reactive oxygen species in inflammation and tissue injury. Antioxid Redox Signal. 2014 Mar;20(7):1126–67.10.1089/ars.2012.5149Search in Google Scholar PubMed PubMed Central
47 Gutierrez MG, Master SS, Singh SB, Taylor GA, Colombo MI, Deretic V. Autophagy is a defense mechanism inhibiting BCG and Mycobacterium tuberculosis survival in infected macrophages. Cell. 2004 Dec;119(6):753–66.10.1016/j.cell.2004.11.038Search in Google Scholar PubMed
48 Jo EK. Autophagy as an innate defense against mycobacteria. Pathog Dis. 2013 Mar;67(2):108–18.10.1111/2049-632X.12023Search in Google Scholar PubMed
49 Abebe M, Kim L, Rook G, Aseffa A, Wassie L, Zewdie M, et al. Modulation of cell death by M. tuberculosis as a strategy for pathogen survival. Clin Dev Immunol. 2011;2011:678570.10.1155/2011/678570Search in Google Scholar PubMed PubMed Central
50 Lam A, Prabhu R, Gross CM, Riesenberg LA, Singh V, Aggarwal S. Role of apoptosis and autophagy in tuberculosis. Am J Physiol Lung Cell Mol Physiol. 2017 Aug;313(2):L218–29.10.1152/ajplung.00162.2017Search in Google Scholar PubMed PubMed Central
51 Srinivasan L, Ahlbrand S, Briken V. Interaction of Mycobacterium tuberculosis with host cell death pathways. Cold Spring Harb Perspect Med. 2014 Jun;4(8):a022459–022459.10.1101/cshperspect.a022459Search in Google Scholar PubMed PubMed Central
52 Zhou D, Chen L, Yang K, Jiang H, Xu W, Luan J. SOCS molecules: the growing players in macrophage polarization and function. Oncotarget. 2017 Aug;8(36):60710–22.10.18632/oncotarget.19940Search in Google Scholar PubMed PubMed Central
53 Fujimoto M, Naka T. Regulation of cytokine signaling by SOCS family molecules. Trends Immunol. 2003 Dec;24(12):659–66.10.1016/j.it.2003.10.008Search in Google Scholar PubMed
54 Yong YH, Wang P, Jia RM, Gooneratne R, Robert Wang HC, Liao M, et al. SOCS3 control the activity of NF-κB induced by HSP70 via degradation of MyD88-adapter-like protein (Mal) in IPEC-J2 cells. Int J Hyperthermia. 2019;36(1):151–9.10.1080/02656736.2018.1541484Search in Google Scholar PubMed
© 2021 Aayushi Singh et al., published by De Gruyter
This work is licensed under the Creative Commons Attribution 4.0 International License.
Articles in the same Issue
- In Our Image: The Ethics of CRISPR Genome Editing
- Doxorubicin loaded magnetism nanoparticles based on cyclodextrin dendritic-graphene oxide inhibited MCF-7 cell proliferation
- The Effects of Oral Liposomal Glutathione and In Vitro Everolimus in Altering the Immune Responses against Mycobacterium bovis BCG Strain in Individuals with Type 2 Diabetes
- Myosteatosis in NAFLD patients correlates with plasma Cathepsin D
- Polyphenols from Passiflora ligularis Regulate Inflammatory Markers and Weight Gain
- Everolimus-induced effector mechanism in macrophages and survivability of Erdman, CDC1551 and HN878 strains of Mycobacterium tuberculosis infection
- Pathophysiological Aspects of the Development of Abdominal Aortic Aneurysm with a Special Focus on Mitochondrial Dysfunction and Genetic Associations
- Size-based Degradation of Therapeutic Proteins - Mechanisms, Modelling and Control
- Incidence and characterisation of Bacillus cereus bacteriophages from Thua Nao, a Thai fermented soybean product
- Bcl2 negatively regulates Protective Immune Responses During Mycobacterial Infection
- Insulin resistance is positively associated with plasma cathepsin D activity in NAFLD patients
- 3D host cell and pathogen-based bioassay development for testing anti-tuberculosis (TB) drug response and modeling immunodeficiency
- Universal scanning-free initiation of eukaryote protein translation–a new normal
- Characterization of Differentially Expressed miRNAs by CXCL12/SDF-1 in Human Bone Marrow Stromal Cells
- Combination therapy using TGF-β1 and STI-571 can induce apoptosis in BCR-ABL oncogene-expressing cells
- SIT1 transporter as a potential novel target in treatment of COVID-19
- Primary Erlotinib Resistance in a Patient with Non-Small Cell Lung Cancer Carrying Simultaneous Compound EGFR L718A, Q849H, and L858R Mutations
- Plant growth-promoting properties of bacterial endophytes isolated from roots of Thymus vulgaris L. and investigate their role as biofertilizers to enhance the essential oil contents
- Implication of plant growth-promoting rhizobacteria of Bacillus spp. as biocontrol agents against wilt disease caused by Fusarium oxysporum Schlecht. in Vicia faba L.
- Antibodies targeting enzyme inhibition as potential tools for research and drug development
- Retraction Note
- Retraction of: Alzheimer's and Danish dementia peptides induce cataract and perturb retinal architecture in rats