Monetary Policy Transmission in Canada – A High Frequency Identification Approach
-
Matt Soosalu


Abstract
I study the effects of monetary policy shocks in Canada on economic and financial variables. With a narrow window around a policy announcement, I create a new set of intraday level, high-frequency monetary policy surprises using the three-month Canadian Bankers’ acceptance rate futures. I use this measure to identify monetary policy shocks as an external instrument in a monthly VAR. Following a 25 basis point contractionary policy shock, I find that the decline in output is more powerful and peaks earlier than previous empirical works show, with a peak decline of 0.5 % points after 18 months. Price level declines are similarly more powerful and earlier, reaching a decline of 0.3 % points after 24 months. In addition, increases in the credit and mortgage spreads indicate the presence of a domestic credit channel of monetary policy transmission for Canada. Finally, I show that the surprise measure is robust to information effects.
Appendix: Data Transformations
The following data was used in the paper with listed transformations:
GDP – Monthly data 1997: 1 – 2019: 12. Stats Canada 2012 chained dollars table: 3610043401 2012 = 100 index, log(x)*100 transformation. Seasonally adjusted.
CPI – Monthly data 1997: 1 – 2019: 12. Stats Canada, table 1810000401, log(x)*100 transformation. Not seasonally adjusted 2002 = 100.
Unemployment – Monthly data 1997: 1 – 2019: 12. FRED: LRUNTTTTCAM156S seasonally adjusted.
Credit Spread – Three-month corporate credit measure minus three-month treasury bill rate. For 2019, three-month bankers acceptance rate used instead of corporate credit rate. Stats Canada table 1010012201.
Mortgage Spread – Five year fixed mortgage rate minus five year government bond rate. Stats Canada table 3410014501 and 1010012201.
Excess Bond Premium – Monthly 1999: 1–2015: 6. From Leboeuf and Pinnington (2017).
BAX intraday – Stockwatch.com. 2004–2019 intraday data, quarterly contracts h,m,u,z. Accessed through the trader workstation. Permission given to share final data set.
BAX (generic measure) – Daily 2000–2020. Bloomberg (BA1) generic measure. Accessed using Bloomberg Terminal.
Exchange Rate – BiS narrow measure. Nominal exchange rate index, composite measure of weighted averages. log(x)*100 transformation. Increase represents appreciation of domestic currency.
One Year Treasury Bill – Daily rate, averaged to monthly. 1997–2019: 12. Stats Canada table 1010013901.
BAA Spread – Monthly data 1997: 1 – 2019: 12. FRED, BAA10YM. BAA minus 10 year bond.
Exports – Monthly data 1991: 1–2019: 12. Stats Canada, table 1210001101, 2012 = 100 own index. Seasonally adjusted, balance of payments, ln(x)*100 transformation.
Stock Price Index – Monthly data 1991–2019: 12. Stats Canada, table 1010012501, 2005 = 100 own index, ln(x)*100 transformation.
Credit Index – Monthly data. Credit liabilities chartered banks, non-mortgage loan. Deflated with CPI. Stats Canada table 3610064001. ln(x)*100 transformation.
Overnight daily rate – Daily rate 2000–2019. Stats Canada table 1010013901.
Economic Uncertainty – Canadian policy uncertainty from Baker, Bloom, and Davis (2016). For the Canadian data and details see their website.
A Figure
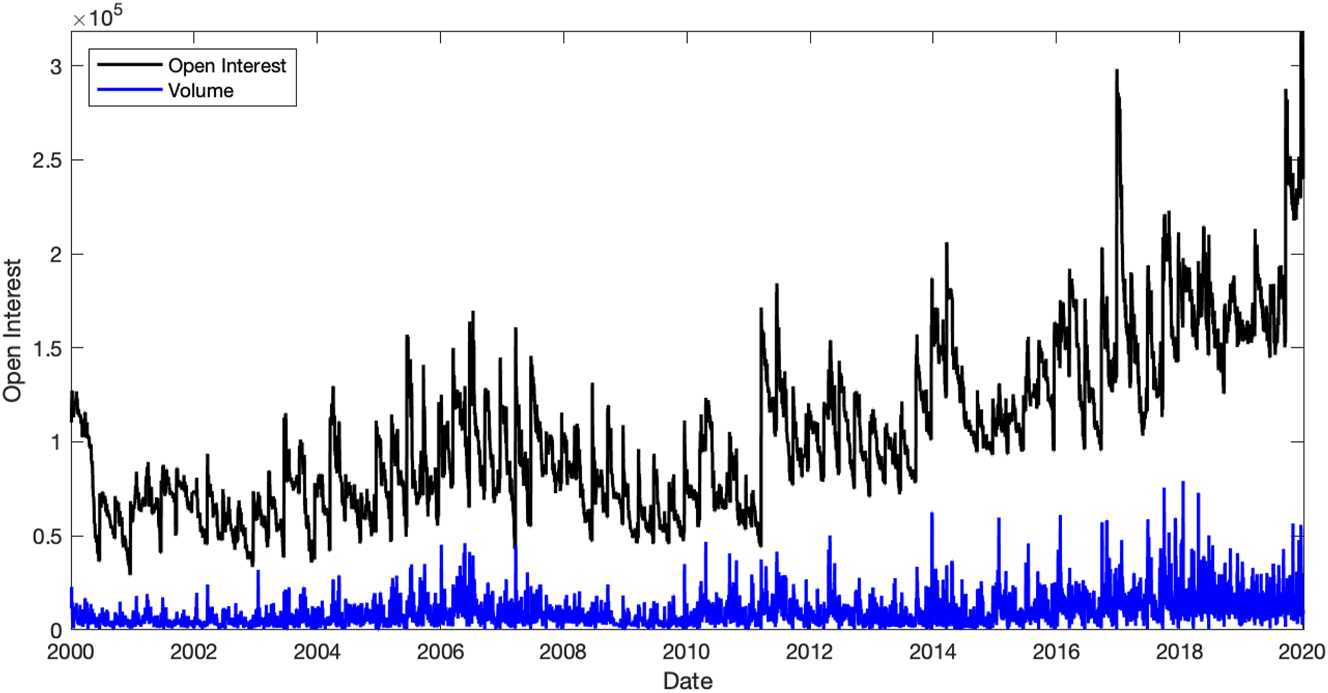
Daily open interest and volume traded of the three month bankers’ acceptance generic measure. Data from Bloomberg Terminal.
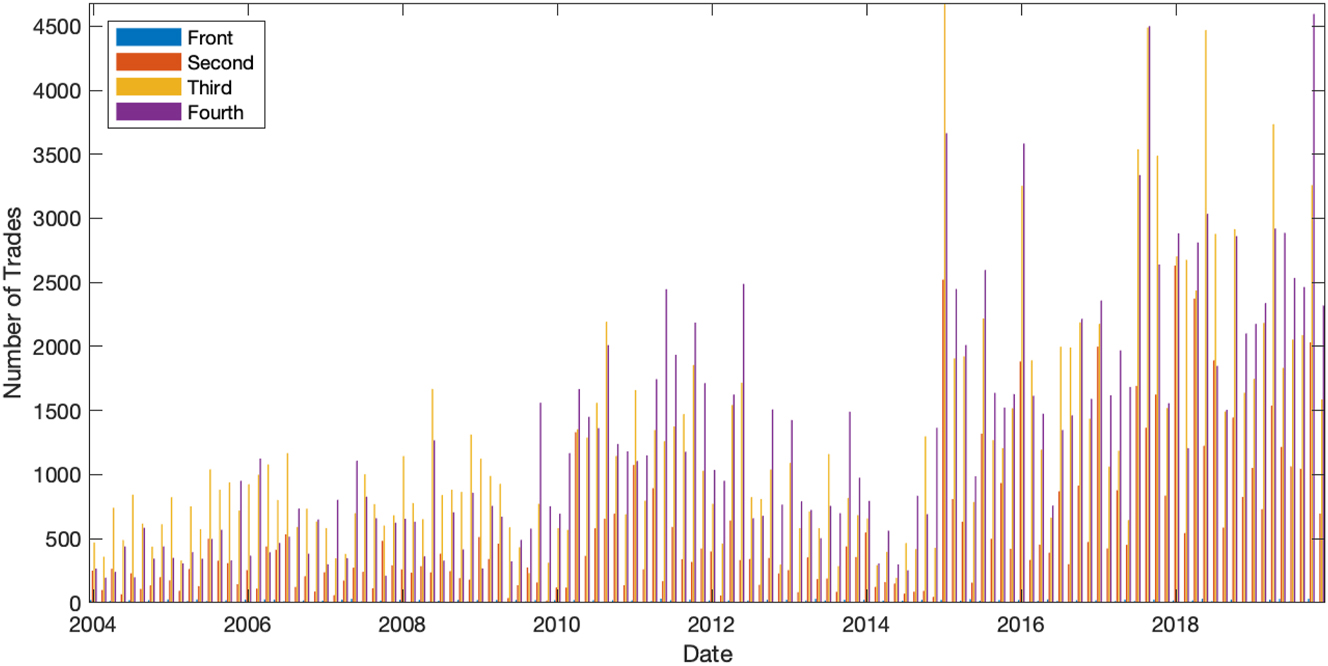
Number of trades per contract type on each policy announcement day.
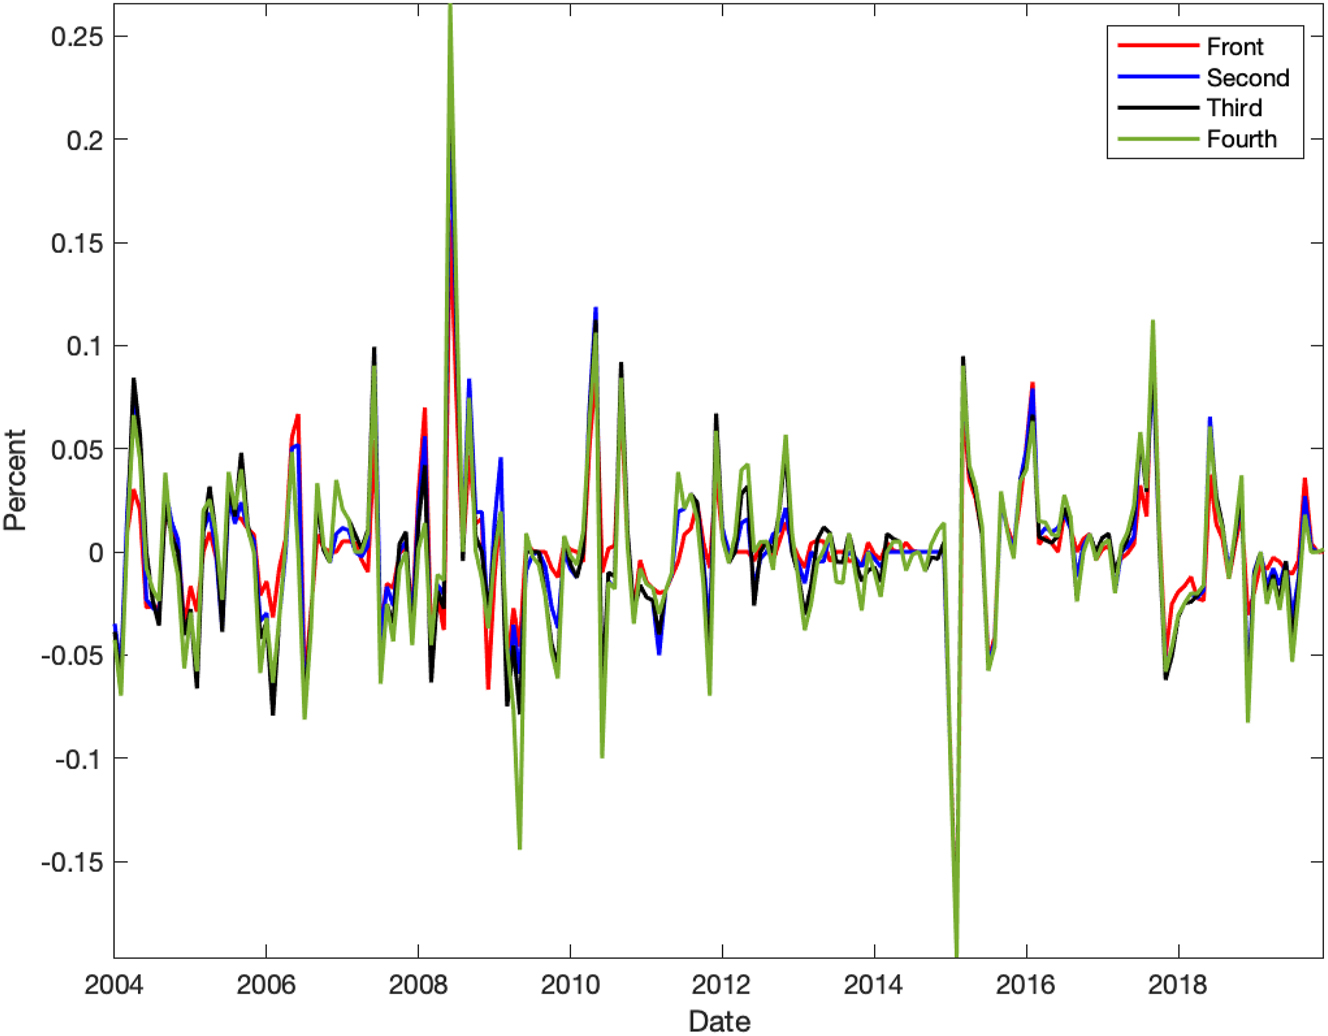
Monetary surprise measure. First contract represents closest to expiration, second the next closest, and so forth.
B Tables
Time-spread of contracts around policy announcements.
| Year | BAX1 | BAX2 | BAX3 | BAX4 |
|---|---|---|---|---|
| 2004 | 00:33:02 | 00:31:52 | 00:33:32 | 00:39:06 |
| (00:30:22, 00:36:30) | (00:30:12, 00:34:47) | (00:31:12, 00:36:22) | (00:30:45, 00:50:25) | |
| 2005 | 00:39:57 | 00:36:22 | 00:32:11 | 00:41:51 |
| (00:30:20, 01:23:41) | (00:30:20, 00:50:11) | (00:30:41, 00:36:28) | (00:30:22, 00:55:45) | |
| 2006 | 00:41:32 | 00:33:32 | 00:35:09 | 00:37:29 |
| (00:30:47, 00:58:28) | (00:30:17, 00:38:12) | (00:30:19, 00:44:44) | (00:30:19, 00:57:55) | |
| 2007 | 00:38:52 | 00:33:33 | 00:35:14 | 00:40:50 |
| (00:31:09, 01:03:22) | (00:30:54, 00:36:50) | (00:30:47, 00:43:37) | (00:31:18, 01:02:10) | |
| 2008 | 00:34:12 | 00:33:26 | 00:33:11 | 00:42:08 |
| (00:31:51, 00:38:49) | (00:30:02, 00:42:26) | (00:30:31, 00:37:20) | (00:32:05, 00:56:13) | |
| 2009 | 01:09:20 | 00:33:28 | 00:37:17 | 00:44:53 |
| (00:31:23, 02:27:32) | (00:30:03, 00:40:17) | (00:30:28, 00:49:10) | (00:30:54, 01:25:18) | |
| 2010 | 00:47:42 | 00:32:49 | 00:32:48 | 00:35:02 |
| (00:33:32, 01:42:07) | (00:30:50, 00:35:29) | (00:30:40, 00:36:58) | (00:30:12, 00:52:56) | |
| 2011 | 00:37:35 | 00:34:51 | 00:32:00 | 00:33:15 |
| (00:30:28, 00:51:05) | (00:30:25, 00:38:17) | (00:30 :40, 00:35:13) | (00:30:26, 00:42:07) | |
| 2012 | 00:49:43 | 00:41:28 | 00:37:41 | 00:36:41 |
| (00:30:39, 02:01:52) | (00:30:30, 01:00:32) | (00:30:52, 00:51:26) | (00:30:10, 00:53:00) | |
| 2013 | 01:02:29 | 00:37:08 | 00:41:16 | 00:39:42 |
| (00:30:59, 03:27:56) | (00:31:29, 00:46:32) | (00:31:38, 01:11:43) | (00:31:36, 00:50:43) | |
| 2014 | 01:03:38 | 00:36:07 | 00:37:33 | 00:35:18 |
| (00:33:11, 01:28:16) | (00:30:10, 00:49:03) | (00:30:12, 00:59:46) | (00:31:48, 00:40:01) | |
| 2015 | 00:48:34 | 00:34:40 | 00:32:51 | 00:33:30 |
| (00:30:24, 02:11:15) | (00:30:07, 00:46:15) | (00:30:08, 00:39:50) | (00:30:33, 00:36:51) | |
| 2016 | 00:38:25 | 00:32:55 | 00:36:40 | 00:36:20 |
| (00:30:03, 00:52:15) | (00:30:18, 00:49:01) | (00:30:14, 00:45:18) | (00:31:38, 00:45:35) | |
| 2017 | 00:35:59 | 00:32:36 | 00:32:17 | 00:36:00 |
| (00:30:31, 00:45:00) | (00:30:12, 00:39:00) | (00:30:30, 00:35:17) | (00:30:29, 00:48:36) | |
| 2018 | 00:35:29 | 00:32:00 | 00:33:33 | 00:33:13 |
| (00:30:37, 00:44:43) | (00:30:06, 00:38:01) | (00:30:22, 00:38:17) | (00:30:52, 00:37:40) | |
| 2019 | 00:35:59 | 00:32:05 | 00:35:18 | 00:32:41 |
| (00:31:17, 00:43:17) | (00:30:34, 00:35:43) | (00:30:28, 00:45:39) | (00:31:25, 00:33:37) |
-
Average time spread listed across each contract and each year. Minimum and maximum window size within each year for each contract is reported as well.
References
Akıncı, Ö. 2013. “Global Financial Conditions, Country Spreads and Macroeconomic Fluctuations in Emerging Countries.” Journal of International Economics 91 (2): 358–71. https://doi.org/10.1016/j.jinteco.2013.07.005.Search in Google Scholar
Baker, S. R., N. Bloom, and S. J. Davis. 2016. “Measuring Economic Policy Uncertainty.” The Quarterly Journal of Economics 131 (4): 1593–636. https://doi.org/10.1093/qje/qjw024.Search in Google Scholar
Bauer, M. D., and E. T. Swanson. 2023a. “An Alternative Explanation for the “Fed Information Effect”.” American Economic Review 113 (3): 664–700. https://doi.org/10.1257/aer.20201220.Search in Google Scholar
Bauer, M. D., and E. T. Swanson. 2023b. “A Reassessment of Monetary Policy Surprises and High-Frequency Identification.” NBER Macroeconomics Annual 37 (1): 87–155. https://doi.org/10.1086/723574.Search in Google Scholar
Bernanke, B. S., and M. Gertler. 1995. “Inside the Black Box: The Credit Channel of Monetary Policy Transmission.” Journal of Economic Perspectives 9 (4): 27–48. https://doi.org/10.1257/jep.9.4.27.Search in Google Scholar
Bernanke, B. S., M. Gertler, and S. Gilchrist. 1999. “The Financial Accelerator in a Quantitative Business Cycle Framework.” Handbook of Macroeconomics 1: 1341–93.10.1016/S1574-0048(99)10034-XSearch in Google Scholar
Bhuiyan, R. 2008. The Effects of Monetary Policy Shocks in a Small Open Economy: A Structural VAR Approach. Kingston: Queen’s University.Search in Google Scholar
Boivin, J., M. P. Giannoni, and D. Stevanovic. 2010. “Monetary Transmission in a Small Open Economy: More Data, Fewer Puzzles.” Manuscript, HEC Montreal, Erişim tarihi 17: 2015.10.2139/ssrn.1684250Search in Google Scholar
Brennan, C. M., M. Jacobson, C. Matthes, and T. B. Walker. 2024. “Monetary Policy Shocks: Data or Methods?” FEDS Working Paper (2024-11).10.17016/feds.2024.011Search in Google Scholar
Brüggemann, R., C. Jentsch, and C. Trenkler. 2016. “Inference in VARs with Conditional Heteroskedasticity of Unknown Form.” Journal of Econometrics 191 (1): 69–85. https://doi.org/10.1016/j.jeconom.2015.10.004.Search in Google Scholar
Cesa-Bianchi, A., G. Thwaites, and A. Vicondoa. 2020. “Monetary Policy Transmission in the United Kingdom: A High Frequency Identification Approach.” European Economic Review 123: 103375. https://doi.org/10.1016/j.euroecorev.2020.103375.Search in Google Scholar
Champagne, J., and R. Sekkel. 2018. “Changes in Monetary Regimes and the Identification of Monetary Policy Shocks: Narrative Evidence from Canada.” Journal of Monetary Economics 99: 72–87. https://doi.org/10.1016/j.jmoneco.2018.06.002.Search in Google Scholar
Feunou, B., J.-S. Fontaine, and I. Krohn. 2022. Real Exchange Rate Decompositions, Staff Discussion Paper 2022-6. Ottawa: Bank of Canada.Search in Google Scholar
Feunou, B., C. Garriott, J. Kyeong, and R. Leiderman. 2017. The Impacts of Monetary Policy Statements, Staff Analytical Note 2017-22. Ottawa: Bank of Canada.Search in Google Scholar
Gerko, E., and H. Rey. 2017. “Monetary Policy in the Capitals of Capital.” Journal of the European Economic Association 15 (4): 721–45. https://doi.org/10.1093/jeea/jvx022.Search in Google Scholar
Gertler, M., and P. Karadi. 2015. “Monetary Policy Surprises, Credit Costs, and Economic Activity.” American Economic Journal: Macroeconomics 7 (1): 44–76. https://doi.org/10.1257/mac.20130329.Search in Google Scholar
Gilchrist, S., and E. Zakrajšek. 2012. “Credit Spreads and Business Cycle Fluctuations.” American Economic Review 102 (4): 1692–720. https://doi.org/10.1257/aer.102.4.1692.Search in Google Scholar
Gospodinov, N., and I. Jamali. 2011. “Risk Premiums and Predictive Ability of BAX Futures.” Journal of Futures Markets 31 (6): 534–61. https://doi.org/10.1002/fut.20482.Search in Google Scholar
Gürkaynak, R. S., B. P. Sack, and E. T. Swansonc. 2005. “Do Actions Speak Louder Than Words? The Response of Asset Prices to Monetary Policy Actions and Statements.” International Journal of Central Banking 1 (1): 55–93.10.2139/ssrn.633281Search in Google Scholar
Ha, J. 2021. “Financial Market Spillovers of US Monetary Policy Shocks.” Review of International Economics 29 (5): 1221–74. https://doi.org/10.1111/roie.12542.Search in Google Scholar
Ha, J., and I. So. 2023. “Which Monetary Shocks Matter in Small Open Economies? Evidence from Canada.” International Journal of Central Banking 19 (2): 389–472.Search in Google Scholar
Hamilton, J. D. 2020. Time Series Analysis. Princeton, New Jersey: Princeton University Press.Search in Google Scholar
Jarociński, M., and P. Karadi. 2020. “Deconstructing Monetary Policy Surprises – The Role of Information Shocks.” American Economic Journal: Macroeconomics 12 (2): 1–43. https://doi.org/10.1257/mac.20180090.Search in Google Scholar
Jentsch, C., and K. G. Lunsford. 2016. “Proxy SVARs: Asymptotic Theory, Bootstrap Inference, and the Effects of Income Tax Changes in the United States.” Federal Reserve Bank of Cleveland Working Paper No. 1619.10.26509/frbc-wp-201619Search in Google Scholar
Jentsch, C., and K. G. Lunsford. 2019. “The Dynamic Effects of Personal and Corporate Income Tax Changes in the United States: Comment.” American Economic Review 109 (7): 2655–78. https://doi.org/10.1257/aer.20162011.Search in Google Scholar
Jentsch, C., and K. G. Lunsford. 2021. “Asymptotically Valid Bootstrap Inference for Proxy SVARs.” Journal of Business & Economic Statistics 40: 1–16, https://doi.org/10.1080/07350015.2021.1990770.Search in Google Scholar
Kearns, J., and P. Manners. 2006. “The Impact of Monetary Policy on the Exchange Rate: A Study Using Intraday Data.” International Journal of Central Banking 2: 157–83.Search in Google Scholar
Kim, M. J., and J. Witmer. 2020. Corporate Investment and Monetary Policy Transmission in Canada, Staff Analytical Note 2020-26. Ottawa: Bank of Canada.Search in Google Scholar
Koeppl, T. V., J. M. Kronick, and J. McNeil. 2024. Using Functional Shocks to Assess Conventional and Unconventional Monetary Policy in Canada. Canadian Journal of Economics, Accepted.10.1111/caje.12741Search in Google Scholar
Krueger, J. T., and K. N. Kuttner. 1996. “The Fed Funds Futures Rate as a Predictor of Federal Reserve Policy.” Journal of Futures Markets 16 (8): 865–79, https://doi.org/10.1002/(sici)1096-9934(199612)16:8<865::aid-fut2>3.0.co;2-k.10.1002/(SICI)1096-9934(199612)16:8<865::AID-FUT2>3.0.CO;2-KSearch in Google Scholar
Kuttner, K. N. 2001. “Monetary Policy Surprises and Interest Rates: Evidence from the Fed Funds Futures Market.” Journal of Monetary Economics 47 (3): 523–44. https://doi.org/10.1016/s0304-3932(01)00055-1.Search in Google Scholar
Laséen, S. 2020. “Monetary Policy Surprises, Central Bank Information Shocks, and Economic Activity in a Small Open Economy.” Working Paper 396, Sveriges Riksbank.Search in Google Scholar
Leboeuf, M., and J. Pinnington. 2017. What Explains the Recent Increase in Canadian Corporate Bond Spreads, Staff Analytical Note 2017-2. Ottawa: Bank of Canada.Search in Google Scholar
Lee, D. S., J. McCrary, M. J. Moreira, and J. Porter. 2022. “Valid t-Ratio Inference for IV.” American Economic Review 112 (10): 3260–90. https://doi.org/10.1257/aer.20211063.Search in Google Scholar
Li, Y. D., T. B. İşcan, and K. Xu. 2010. “The Impact of Monetary Policy Shocks on Stock Prices: Evidence from Canada and the United States.” Journal of International Money and Finance 29 (5): 876–96. https://doi.org/10.1016/j.jimonfin.2010.03.008.Search in Google Scholar
McNeil, J. 2017. Monetary Policy in a Small Open Economy: New Measures of Canadian Monetary Policy Shocks and Their Effects’, Technical Report, Unpublished Working Paper.Search in Google Scholar
McRae, K., and D. Auger. 2018. A Primer on the Canadian Bankers’ Acceptance Market, Staff Discussion Paper 2018-6. Ottawa: Bank of Canada.Search in Google Scholar
Mertens, K., and M. O. Ravn. 2013. “The Dynamic Effects of Personal and Corporate Income Tax Changes in the United States.” American Economic Review 103 (4): 1212–47. https://doi.org/10.1257/aer.103.4.1212.Search in Google Scholar
Mertens, K., and M. O. Ravn. 2019. “The Dynamic Effects of Personal and Corporate Income Tax Changes in the United States: Reply.” American Economic Review 109 (7): 2679–91. https://doi.org/10.1257/aer.20180707.Search in Google Scholar
Miranda-Agrippino, S., and G. Ricco. 2021. “The Transmission of Monetary Policy Shocks.” American Economic Journal: Macroeconomics 13 (3): 74–107. https://doi.org/10.1257/mac.20180124.Search in Google Scholar
Montiel Olea, J. L., J. H. Stock, and M. W. Watson. 2021. “Inference in Structural Vector Autoregressions Identified with an External Instrument.” Journal of Econometrics 225 (1): 74–87. https://doi.org/10.1016/j.jeconom.2020.05.014.Search in Google Scholar
Nakamura, E., and J. Steinsson. 2018. “High-Frequency Identification of Monetary Non-Neutrality: The Information Effect.” The Quarterly Journal of Economics 133 (3): 1283–330. https://doi.org/10.1093/qje/qjy004.Search in Google Scholar
Olea, J. L. M., and C. Pflueger. 2013. “A Robust Test for Weak Instruments.” Journal of Business & Economic Statistics 31 (3): 358–69. https://doi.org/10.1080/00401706.2013.806694.Search in Google Scholar
Piazzesi, M., and E. T. Swanson. 2008. “Futures Prices as Risk-Adjusted Forecasts of Monetary Policy.” Journal of Monetary Economics 55 (4): 677–91. https://doi.org/10.1016/j.jmoneco.2008.04.003.Search in Google Scholar
Romer, C. D., and D. H. Romer. 2004. “A New Measure of Monetary Shocks: Derivation and Implications.” American Economic Review 94 (4): 1055–84. https://doi.org/10.1257/0002828042002651.Search in Google Scholar
Sims, C. A., J. H. Stock, and M. W. Watson. 1990. “Inference in Linear Time Series Models with Some Unit Roots.” Econometrica: Journal of the Econometric Society: 113–44. https://doi.org/10.2307/2938337.Search in Google Scholar
Stock, J. H., and M. W. Watson. 2012. Disentangling the Channels of the 2007–2009 Recession, NBER Working Paper 18094. NBER: National Bureau of Economic Research.10.3386/w18094Search in Google Scholar
Stock, J. H., and M. Yogo. 2002. Testing for Weak Instruments in Linear IV Regression, NBER Working Paper 0284. NBER.10.3386/t0284Search in Google Scholar
Zettelmeyer, J. 2004. “The Impact of Monetary Policy on the Exchange Rate: Evidence from Three Small Open Economies.” Journal of Monetary Economics 51 (3): 635–52. https://doi.org/10.1016/j.jmoneco.2003.06.004.Search in Google Scholar
Supplementary Material
This article contains supplementary material (https://doi.org/10.1515/bejm-2023-0212).
© 2024 Walter de Gruyter GmbH, Berlin/Boston
Articles in the same Issue
- Frontmatter
- Advances
- Corporate Tax Rates, Allocative Efficiency, and Aggregate Productivity
- Contributions
- Endogenous Financial Friction and Growth
- Decomposing Structural Change
- Industry Impacts of US Unconventional Monetary Policy
- Monetary Policy Transmission in Canada – A High Frequency Identification Approach
- Child Labor, Corruption, and Development
- Inflation Uncertainty from Firms’ Perspective, Overconfidence and Credibility of Monetary Policy
- Does Nominal Wage Stickiness Affect Fiscal Multiplier in a Two-Agent New Keynesian Model?
- To Create or to Redistribute? That is the Question
- Estimating Expected Asset Returns with the Present Value Model of Consumption and Fed Forecasts