Coordinated Minimum Wage Policies: Impacts on EU-Level Income Inequality
-
Stefano Filauro

 ,
Klaus Grünberger
and
Edlira Narazani
,
Klaus Grünberger
and
Edlira Narazani

Abstract
Several studies have shown that minimum wage policies have the potential to mitigate income inequality. Both EU-level and national policies have sparked discussions regarding the adequacy of minimum wages and their impact on income inequality at the country level. However, the impact on EU-level income inequality of coordinated minimum wage policies remain uncertain. While upward convergence in minimum-wage settings across countries may reduce inequality within countries, it could also exacerbate disparities between them. This study assesses the EU-wide impact of minimum wage policies beyond national effects. Using a microsimulation model and assuming negligible employment effects, our results suggest that implementing a hypothetical minimum wage set at 60 % of the national median wage in EU countries would result in a limited yet significant reduction in EU-level income inequality (by 0.6 % in 2019, as measured by the Gini index). This reduction stems from a relative decrease in both within-country and between-country inequality, although the absolute reduction in Gini points is more pronounced for within-country inequality. Notably, the percentage reduction in inequality is broadly similar for both market and disposable incomes. However, the withdrawal of social benefits due to higher minimum wages appears to offset part of this reduction in market inequality.
1 Introduction
The debate on minimum wages in Europe has regained momentum after the adoption of the EU Directive on the adequacy of minimum wages in the EU in October 2022.[1] The Directive sets a framework and proposes a combination of policy measures to improve the adequacy and coverage of minimum wages. The recent debate on adequacy of minimum wages has largely focused on Kaitz indices, which express a relationship between minimum wage and median wages. Minimum wages should guarantee the satisfaction of the needs of workers and their households in the light of national economic and social conditions. Several studies have analysed the impact of coordinated hypothetical minimum wage scenarios on a vast array of social outcomes at the national level, including wage and income inequality (Fernandez-Macias and Vacas-Soriano 2016; Grünberger et al. 2022; Haapanala, Marx, and Parolin 2023). The main evidence points to decreasing income inequality for minimum wage increases in the range of 50 %–60 % of national median wages. The cross-country effects of hypothetical minimum wage increases vary significantly under these scenarios of minimum wage floors commonly set in relation to national wage benchmarks. For example, an increase of minimum wages to 60 % of the median wage would lead to a reduction of at least 10 % in wage inequality in only 12 Member States, while in others the inequality reduction is lower or negligible.
This improvement in the income distribution is mostly due to a compression of the wage distribution at the bottom, considering that the estimated effects on employment and labour supply of such minimum wage increases are limited. In particular, the magnitude of the wage-inequality reduction depends on the share of workers affected and the increase in the minimum wage level. In turn, family composition and the interaction of the tax-benefit system with new levels of minimum wage are crucial for determining the final impact on the income distribution.
Therefore, if minimum wage policies have an impact on national income distributions across EU countries, they also have the potential to influence the distribution of income between all EU households. In this sense, it is desirable that minimum wage floors set across EU countries with common principles (relatively to the general level of wages in each Member State) contribute to reducing EU-level inequality.[2]
Despite a range of studies documenting the impact of commonly set minimum wage floors on country-level inequality, their inequality-reducing impact at the EU level cannot be predicted a priori. Inequality between EU households goes beyond the sum of country-level inequalities since it results from both within- and between-country components of inequality. Not only do rising minimum wages influence within-country income distributions, they may reshuffle inequality between countries. As they affect differently the national bottom income distributions, they may influence and change the relative national positions in the EU distribution. For instance, in a scenario where increasing minimum wages benefitted relatively more high-income EU countries, the final effect at the EU level could, in theory, be dis-equalising because these minimum wage earners are in the middle upper part of the EU-level distribution. Conversely, if minimum wage earners who benefit more from the increase are located in relatively poorer EU countries, such an increase would result in a more equal EU distribution as these earners are in the bottom end of the EU distribution.
Against this background, this study aims to analyse the potential for coordinated increases of statutory minimum wages to reduce EU-level income inequality. The contribution is twofold. First, we expand the country-specific analyses of the impact of hypothetical minimum wages on inequality in a supranational, EU-level dimension. Second, we use the EU-wide microsimulation tool, EUROMOD, to study in a coherent and comparable way the impact of EU-promoted policies, such as hypothetical minimum wage rises, on the distribution of income at the EU level, accounting for the complexities of tax-benefit systems in the EU. To the best of our knowledge, this is the first study that uses EUROMOD for analysing the impact of policies on EU-level inequality indices.
In particular, we simulate the impact on EU-level inequality of minimum wage increases corresponding to 50 %, 55 % and 60 % of the national median wages, representing realistic minimum wage thresholds across EU countries.[3] Afterwards, we separate the change in EU-level inequality into two components: within and between countries. Assuming negligible employment effects, the inequality reduction is the highest for the most ambitious levels of minimum wage increase. Simulation results indicate that increasing statutory minimum wages to 60 % of national median wages reduces the EU-level Gini coefficient for disposable incomes by around 0.6 %. The overall reduction in inequality reflects small but detectable declines in both within-country and between-country inequality. We also extend the analysis to other income concepts such as market income and gross income and find that the most ambitious minimum wage increase results in a small but significant reduction in market income inequality by 0.6 %. In turn, the percentage reduction in gross income inequality is the least pronounced among the three income concepts, at around 0.5 %, likely due to the withdrawal of benefits following the minimum wage increase. For both market and gross incomes, the reduction in inequality is driven to a similar extent by within-country and between-country components. However, since within-country inequality constitutes the lions’ share of EU-level inequality, the absolute reduction in Gini points is larger for within-country inequality, aligning with expectations and prior research.
Two main caveats must be considered when interpreting these results: the analysis does not account for employment effects or spillover effects. Especially regarding employment effects, research indicates that even significant increases in hypothetical minimum wages generally result in modest employment impacts, with minimal effects on labor supply. Studies on Eastern European countries suggest these nations may have greater flexibility to raise minimum wages without significant employment impacts while mixed findings might be observed in larger economies like Germany. Thus, while employment effects cannot be dismissed, their magnitude is likely to be relatively limited (Dube 2019). To maintain simplicity and avoid the complexities of modeling behavioral responses or broader inequality impacts, this analysis adopts a straightforward simulation approach and does not model employment and spillover effects. Thus, the simulation results provide a best-case scenario and should be interpreted as such.
Although this exercise adopts a framework similar to that of Grünberger et al. (2022), the focus is notably different. Our study examines the effects of hypothetical minimum wage floors on EU-wide income inequality, whereas Grünberger et al. investigated various socio-economic outcomes, including wage inequality, but limited their analysis to the country level without adopting a supranational perspective. Our emphasis on income inequality – as a broader measure of societal disparities beyond labour market-driven wage inequalities – on EU-level outcomes, rather than national ones, is motivated by both policy considerations and the normative framework discussed in Section 2.1.
The remainder of the paper is structured as follows. Section 2 surveys the empirical studies related to EU-level inequality analyses and the impact of minimum wage policies on income inequality. Section 3 illustrates the hypothetical minimum wage scenarios and the methodological approach adopted to simulate their impact on EU-level inequality. Section 4 discusses the results and its policy implications while Section 5 concludes.
2 Literature Review
2.1 Income Inequality at the EU Level
Most research on income inequality in the EU area is limited to country-level analysis, essentially because tax-benefit systems, which represent the primary policy tool to counter inequality, are in the remit of Member States (European Commission 2021). Moreover, reforms of tax-benefit systems take place mainly at the national level as they generally reflect national preferences.
However, as the mobility of the EU population has risen over the last decade (European Commission 2020a), it is reasonable to assume that EU citizens consider their income levels in comparison to EU-level incomes. In this context, the perception of inequality may go beyond national considerations. Likewise, an integrated European economic space requires that policies should aim, at least in the medium run, at pushing inequality in the Union down. Especially EU policies that might have different effects on income inequality across EU countries are also likely to affect overall EU-level inequality. In this regard, Salverda (2021) delineates a broad range of both national and EU policies with the perspective of a reduction of EU-wide inequality.
This is why some studies have recently estimated EU-level income inequality, following a research strand pioneered by Atkinson (1998). From an empirical viewpoint, these estimates have been carried out with harmonised survey data or with administrative income data. For the former, many studies have documented pan-European inequality trends since the early 2000 (Benczúr, Cseres-Gergeley, and Harasztosi 2017; Brandolini 2007; Darvas 2016; Dauderstädt and Keltek 2014; Eurofound 2017; Heidenreich 2016). More recently, Filauro and Parolin (2019) also evaluated pan-European inequality in market incomes and in disposable incomes to discuss the redistributive role of the EU welfare states and compare it with that in the US. In turn, Brandolini and Rosolia (2021) estimated EU-level income inequality and discussed the macroregional trends (across EU areas) driving the overall patterns, while Filauro, Parolin, and Valetto (2025) analyzed the within-country and between-country dynamics in market income behind the overall reduction in EU inequality observed between 2007 and 2019. For the latter, Blanchet, Chancel, and Gethin (2020) have carried out an admirable reconciliation of survey and administrative income data with national account statistics within the Distributional National Accounts (DINA) framework to discuss EU market income distribution and the EU tax-benefit redistributive power in comparison to the US.
Three main points can be highlighted from a broad overview of these studies. First, disposable incomes in the EU are as unequal as in the most unequal countries of the EU. Secondly, 20–30 % of income inequality is explained by inequality between EU countries, as opposed to the US where the overwhelming source of inequality is within US States – around 99 % as estimated by Filauro and Parolin (2019). Third, in the process shaping inequality, capital and labour incomes determine a very unequal market income distribution in the EU. However, the overall mitigation of tax-benefit systems on market income inequality is over 20 % at the EU level, as computed with EU-SILC data (Filauro and Fischer 2021). The reduction in inequality when moving from market to disposable income is due to the high degree of progressivity of tax-benefit systems in countries where the EU highest market incomes are concentrated, i.e. Nordic countries, Germany and France.
Moreover, EU-level income inequality can be considered as an indicator relevant in itself as its levels may influence trust in the EU institutions and intra-EU mobility decisions. Indeed, one of the predominant economic motives to trigger mobility decisions is presumed to be the level of wage inequality across countries, in particular the wage premium for the same job performed in a different country. Although more focused on the degree of convergence in average income levels, a measure of between-country inequality may indirectly indicate diverging income levels and a higher propensity of cross-country mobility.
2.2 The Impact of Minimum Wage Policies on Income Inequality
There is a consolidated line of research on the impact of minimum wages on income-related outcomes, such as poverty or inequality, at the national level. The three factors that determine minimum wage (MW) increases to reduce income inequality, in the absence of employment effects, are: (1) the level of compliance, (2) the level at which the minimum wage is increased, and (3) the household characteristics of MW earners. Hypothesising full compliance, previous empirical studies have assessed the inequality impact of minimum wages at the national level, mainly with microsimulation techniques. There are some studies that contend that minimum wage policies are not the optimal policy tool to reduce poverty and counter wage inequality (Burkhauser 2015). However, an empirical relation between the introduction or the increase of minimum wage levels and a subsequent wage inequality reduction has been documented in a number of studies. For example, with regard to wage inequality, Keese (1998) and Lucifora, McKnight, and Salverda (2005) show that minimum wages reduce wage inequalities in Europe. More recently, Garnero, Kampelmann, and Rycx (2015) find that the presence of a statutory minimum wage reduces wage inequality significantly, as measured by the Gini coefficient and with a Theil decomposition in a sample of 18 European countries.
Similarly, other studies find that the erosion of minimum wages is correlated with considerable increases in overall inequality (Beramendi and Rueda 2014; Checchi and Garcia-Peñalosa 2008). Jaumotte and Osorio Buitron (2015) estimate a 2.4 % increase in the Gini coefficient of disposable incomes in the Netherlands due to a decrease of 16.5 % in the minimum wage level over the period 1980–2010. In Romania, Militaru et al. (2019) using 2013 survey data, find that household disposable incomes become less unequal when the minimum wage increases. In Ireland, Redmond, Doorley, and McGuinness (2021) found that although wage inequality is reduced by minimum wage increases, the effect on household income distribution is limited because minimum wage workers are spread throughout the income distribution of households. Dustmann et al. 2022 find that minimum wages introduced in Germany in 2015 improved the wages of low-wage workers without significantly lowering their employment prospects. The ILO Global Wage Report (2021), through a microsimulation exercise, assesses the inequality-reducing impact of expanding both the coverage and level of the minimum wage.[4] The findings indicate that, regardless of the inequality index used, increasing the minimum wage reduces income inequality across all EU countries analysed.
Finally, Grünberger et al. (2022) find that an increase in the minimum wage is expected to reduce wage inequality, depending on the share of workers affected and the amount of wage increase (Tables 1 and 2). They find that countries such as Czechia, Germany, Spain, Luxembourg, Poland, Slovakia and Estonia would record the highest reduction in wage inequality – around 20 % for a minimum wage rise equal to 60 % of the median wage. The degree to which this increase translates into a reduction in income inequality at the country level is mediated by household composition and tax-benefit interaction.
Share of workers affected by hypothetical minimum wage scenarios.
| HMW as a % of the national median wage | |||
|---|---|---|---|
| 50 % | 55 % | 60 % | |
| Austriaa | 3.80 % | 6 % | 8.50 % |
| Belgium | 1.00 % | 2.80 % | |
| Bulgaria | |||
| Cyprusa | 11.20 % | 15.10 % | 21.10 % |
| Czechia | 5.30 % | 9.00 % | 11.40 % |
| Germany | 10.30 % | 14.00 % | 18.20 % |
| Denmarka | 5.50 % | 7.10 % | 10.30 % |
| Estonia | 13.10 % | 16.50 % | 20.60 % |
| Greece | 19.80 % | 27.50 % | 34.40 % |
| Spain | 24.90 % | ||
| Finlanda | 0.90 % | 1.60 % | 3.40 % |
| France | 9.00 % | ||
| Croatia | 7.20 % | 11.60 % | 17.10 % |
| Hungary | 7.70 % | 14.40 % | |
| Ireland | 13.30 % | 19.20 % | 25.00 % |
| Italya | 3.10 % | 5.10 % | 7.20 % |
| Lithuania | 4.10 % | 8.80 % | |
| Luxembourg | 14.90 % | 20.40 % | |
| Latvia | 7.10 % | 12.10 % | 16.30 % |
| Malta | 4.50 % | 8.00 % | 11.60 % |
| Netherlands | 3.40 % | 6.10 % | 9.00 % |
| Poland | 20.90 % | 26.60 % | |
| Portugal | |||
| Romania | 22.50 % | ||
| Swedena | 6.80 % | 8.70 % | 11.10 % |
| Slovenia | 7.00 % | ||
| Slovakia | 12.70 % | 18.00 % | |
-
aCountries without a statutory minimum wage in 2019. Note: Calculations based on EUROMOD input data from 2019. EUROMOD data have been processed as outlined in Section 4.1. Cases in which hypothetical minimum wages are smaller than actual statutory minimum wages are marked in grey.
Reduction in EU-wide inequality (%) simulated for different hypothetical minimum wages. Disposable income, 2019.
| Minimum wage level | Population | Gini (%) reduction | s.e | t-test | Low (*100) | High (*100) |
|---|---|---|---|---|---|---|
| HMW = 50 % median wage | All EU households | 0.25 % | 3.31E-05 | 24.66 | 0.00075 | 0.00088 |
| HMW = 55 % median wage | 0.40 % | 4.16E-05 | 31.20 | 0.00122 | 0.00138 | |
| HMW = 60 % median wage | 0.63 % | 5.42E-05 | 38.24 | 0.00197 | 0.00218 | |
| HMW = 50 % median wage | EU households with at least an employee | 0.28 % | 3.60E-05 | 25.33 | 0.00084 | 0.00098 |
| HMW = 55 % median wage | 0.45 % | 4.56E-05 | 32.31 | 0.00138 | 0.00156 | |
| HMW = 60 % median wage | 0.73 % | 5.94E-05 | 39.92 | 0.00225 | 0.00249 | |
| HMW = 50 % median wage | EU households with at least a MW earner | 0.74 % | 1.14E-04 | 22.31 | 0.00231 | 0.00276 |
| HMW = 55 % median wage | 0.91 % | 1.08E-04 | 28.53 | 0.00288 | 0.00330 | |
| HMW = 60 % median wage | 1.25 % | 1.17E-04 | 35.94 | 0.00399 | 0.00445 |
-
Note: EUROMOD simulations. The baseline reflects the distribution of EU disposable incomes in 2019, with the observed minimum wages. Standard errors, t-test and confidence intervals refer to the difference between the Gini of the simulated distribution after the HMW and the baseline one.
However, at the EU level, the impact of minimum wage rises on overall inequality depends on how much it triggers an upward shift of EU low-income households in the EU distribution. In other words, households which may be low-income in the national distribution and can benefit from a minimum wage increase, may well not be low-income households in the EU distribution. For example, households with minimum-wage earners in Luxembourg may be in the bottom of the national distribution but they are much higher up in the EU-level income distribution. Thus, the final impact of national increases of minimum wages on EU-level income distribution depends on the combination of within- and between-country inequality.
To date, no study has adopted microsimulation techniques to evaluate the impact of EU policies on the income distribution at the EU level. Thus, we contribute to this strand of research by using EUROMOD, a unique microsimulation model widely used for cross-country analysis of the impact of fiscal reforms on inequality, in a supranational framework to study the impact of EU-promoted policies, such as minimum wage policies, on EU-level inequality.
3 Data and Methodology
3.1 Adjusting Gross Wages
We use information on individual wages and incomes from the EU Survey on Income and Living Conditions (EU-SILC). We analyse three hypothetical minimum wage (HMW) scenarios which are calculated as ratios of country-specific median gross wages. HMW levels are calculated as 50 %, 55 % and 60 % ratios of median gross wages, following the general suggestion in the EU Directive on Minimum wages and the recent debate on potential MW thresholds in national debates (Eurofound 2023a, Chapter 3). We use median wage statistics of year 2019 from Eurostat (for more details, see Grünberger et al. 2022). We choose 2019 to insulate our analysis from the pandemic-related labour market turbulence occurred in 2020 and 2021.
Of the 27 EU Member States, 21 had a statutory minimum wage established by legislation in 2019 (see Table A1). Cyprus has adopted a statutory minimum wage in 2023. In the remaining five countries (Austria, Denmark, Finland, Italy, and Sweden), minimum wage protection is still governed by collective agreements. This analysis considers the impact of hypothetical increases in national minimum wages across all countries, regardless of whether minimum wages are statutory or determined by collective bargaining. The rationale is that such hypothetical increases could be implemented either through regulatory changes or by promoting more adequate minimum wage levels via agreements between social partners, in line with European regulations.[5]
Table A1 shows the levels of statutory minimum wages and HMWs in EUR. For each individual whose observed wage lies below the HMW, we increase the gross wage to the HMW. In case of part-time workers, the respective share of HMW is imputed, depending on the reported working time. The imputation of hypothetical minimum wages is done based on the hourly wage rate. For that, we convert both the observed wages (expressed in yearly terms in EU-SILC data) and the HMW levels (expressed in monthly terms) to hourly levels. A reliable calculation of hourly wages requires reliable data on both earnings and working time. Grünberger et al. (2022) show that particularly information on working time in EU-SILC data is prone to measurement errors. Working time in SILC is reported as the number of months worked during the year and the usual weekly working hours. The number of months worked is further categorized into months worked part-time and months worked full-time. A complication arises because the number of months worked pertains to the income year (the calendar year preceding the survey), whereas the usual weekly working hours refer to the survey year. This discrepancy creates challenges in accurately recording working time, particularly for individuals whose work patterns change over time.
The noise in the assessment of working time introduces a measurement error into hourly wage data. When the working time reported in SILC exceeds the real time worked by the employee, this leads to an underestimation of the hourly wage. On the other hand, we overestimate hourly wages, if the recorded working time is lower than the real time in employment. This measurement error leads to an increase in the variance of hourly wages as it inflates the ratio of observations with an estimated hourly wage below the minimum wage. Thus, we adopt a set of correction methods to account for potential measurement errors in the calculation of hourly wages.
First, hourly wages identified as negative outliers, using the method outlined in Grünberger et al. (2022), are excluded from upward adjustments to HMW levels. Second, wages of employees who report other income sources, such as self-employment or pension income, are not adjusted. Third, in line with Eurofound (2024), we exclude wage adjustments for workers with less than one year of tenure, those alternating between part-time and full-time contracts between the income and survey years, individuals whose usual weekly working hours contradict their employment status for the income year, and workers under 20 or over 65 years of age.
For eligible workers not falling under the above restrictions, we assign HMW hourly wages and recalculate annual earnings. Notably, we assume full compliance with hypothetical minimum wage legislation for this group. However, wages remain unchanged in countries where the statutory minimum wage exceeds the HMW (see grey cells in Table 1).
Table 1 shows the shares of workers affected by each hypothetical minimum wage increase. In Cyprus, Estonia, Greece, Spain, Ireland, Luxemburg, Poland and Romania more than 20 % of workers would be affected if the minimum wage is set to 60 % of the median wage. In Czechia, Denmark, Germany, Croatia, Hungary, Latvia, Malta, Slovakia and Sweden the share of those affected would be between 10 % and 20 %. In Austria, Belgium, Finland, France, Italy, Netherlands and Slovenia less than 10 % would be affected. As already mentioned above, in Bulgaria and Portugal there would be no effect, as the statutory wage is already higher than 60 % of the median wage.
To illustrate visually how an increase in minimum wage levels might determine a reduction in disposable income inequality, we respectively plot the EU-level distributions of wage and disposable income. We plot these distributions first for the sample of workers only and then for the overall population before and after the most ambitious HMW increase, i.e. 60 % of the median wage. Moreover, we focus on the country position of the HMW earners in the EU-level distribution.
All the distributions presented in this section are representative of the EU population as they are obtained by using cross-sectional EU-SILC weights. To make the wage and income values comparable across countries, we apply purchasing power parity (ppp) rates.[6] The average monthly gross wage is obtained by dividing yearly employment gross earnings by 12. Given the high heterogeneity in wage setting across countries, we expect EU wages to follow a multimodal distribution. In addition to wage differences between countries, levels of average monthly gross wages depend on working time and vary accordingly. The distribution of average monthly gross wages in the EU after assigning a HMW corresponding to 60 % of the national median income has several distinctive peaks in comparison to the distribution of observed survey data (Figure 1a).[7] These peaks correspond to distinctive EU areas where workers receiving the HMW increase are located as illustrated in Figure 1b.

Gross wage distribution of EU workers before and after the HMW rise (panel a); gross wage distribution of HMW earners by region (panel b). Note: The distributions are based on kernel density estimates, probability density functions. The EU-wide distribution was corrected with purchasing power parities.
The first peak, at around 800 ppp-adjusted EUR, corresponds to the HMW earned by workers living in Central and Eastern European (CEE) countries. The other peaks correspond to the HMW increase earned by workers living in Mediterranean (MED) as well as in Northern and Western European (NWE) countries.[8] More specifically, 7.8 million workers in NWE countries would receive the HMW increase, followed by 5.7 million workers in CEE countries and 5.3 million workers in MED countries. The ppp-adjusted wages of MW earners in CEE countries are similar to those in MED ones, although the former are much more concentrated around 800 ppp-adjusted EUR per month due to a low incidence of part-time work in CEE countries.
3.2 Calculating Disposable Income
We analyse the impact of HMW scenarios on EU-level inequality for different income concepts. The first income concept analysed is disposable income as a proxy for household living conditions. Next, we analyse market income, comprising only capital and labour income sources, and gross income, comprising also social benefits. In this way, we can assess the redistributive role of EU tax-benefit systems in conjunction with the impact of HMW levels. The different income concepts of interest are described in Table B1.
For calculating changes in taxes and benefits related to each HMW scenario, we use the static microsimulation model EUROMOD. This model provides a comparative framework for EU countries that enables researchers to conduct cross-country analysis.[9] EUROMOD takes into account the interaction between gross wage and taxes and benefits in each EU Member State. After increasing wages according to the HMW scenario, at the new level of earnings, EUROMOD calculates taxes, social insurance contributions and benefits, and consequently the disposable income of workers and their household members. For the simulations presented in this study we have used EUROMOD version I2.0+, which refers to the tax-transfer system as of 30 June 2019. This version is based on microdata coming from EU-SILC surveys from 2017. Given that the income reference period of EU-SILC 2017 data is the year 2016, uprating factors are used to bring the income values from the income reference period to 2019. We use 2019 income values to insulate our analysis from the pandemic-related labour market turbulences that affected the income distribution in 2020 and 2021 (Eurofound 2023b).
The model provides only static results and does not account for behavioral reactions of the labour market that may occur in response to policy changes. For example, minimum wage increases may trigger job losses or induce workers to change their labour supply, which in turn would affect individuals’ incomes. However, Grünberger et al. (2022) predict little impact of the minimum wage increase on employment and labour supply.
When moving from gross wages to disposable incomes, applying tax-benefits rules in force, the EU workers’ distribution appears more compressed (Figure 2a).[10] The baseline distribution appears to have more workers with a disposable income below 600 ppp-EUR than the distribution of the HMW scenario. Instead, the HMW scenario distribution has more observations around 800 ppp26-EUR and 1,500 ppp-EUR than the baseline distribution. Figure 2b helps to identify the geographical location of workers that experience an increase in disposable income as a result of the HMW rise as it includes only workers affected by the HMW increase.
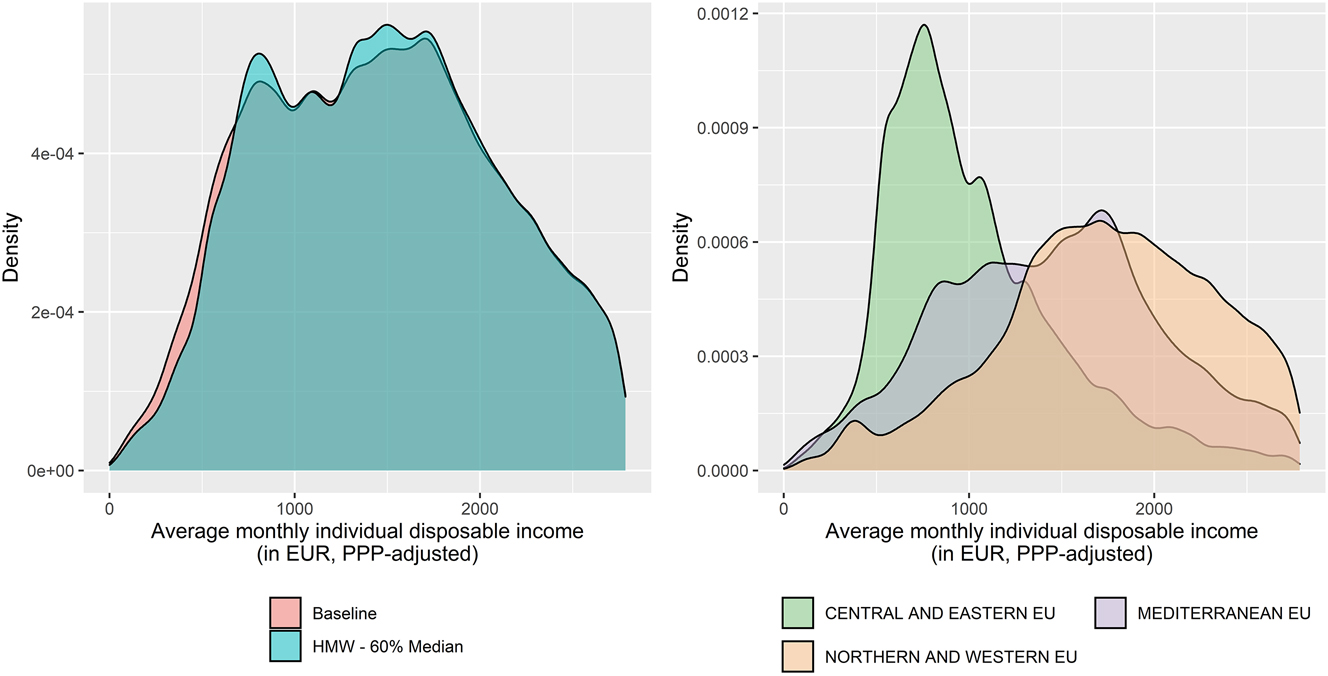
Disposable income distribution of EU workers before and after the HMW increase (panel a); disposable income distribution of HMW earners by region (panel b). Note: The distributions are based on kernel density estimates, probability density functions. The EU-level distribution was corrected with purchasing power parities.
Two findings emerge from the comparison of the distribution of disposable income with the distribution of gross wages, as in Figure 1b. First, while disposable income of MW workers is higher in MED than in CEE countries (Figure 2b), gross wages were, all in all, of a similar level (Figure 1b). Secondly, the peak observed in the distribution of gross wages for the MW earners in NWE countries almost fades out in the distribution of disposable income. Both findings suggest that in MED and NWE countries, minimum wage earners are benefitting to a larger extent from the tax-benefit system than in CEE countries.[11] Indeed, prior research documents that tax-transfer systems are generally more redistributive for low-wage workers in MED and NWE countries than in CEE ones (European Commission 2020b).
Finally, we look at the distribution of equivalised household disposable income in the EU calculated as the total household income divided by the modified-OECD equivalence.[12] Furthermore, to better identify the impact of HMWs on the working-age population in comparison to the full population, we consider three types of households: (1) households with at least one person earning the hypothetical minimum wage; (2) households with at least one employee; and (3) all households, irrespective of the occupational status of its members (Figure 3).

Disposable income of EU households. Three subpopulations. Note: The distributions are based on kernel density estimates, probability density functions. The EU-level distribution was corrected with purchasing power parities.
Compared to the shift of the distribution of individual disposable income for workers-only after the HMW rise (Figure 2a), the shift in the equivalent household disposable income for households with at least one employee is visibly less pronounced (Figure 3b). This is because HMW earners are disseminated among households and their income is pooled with the income of other household members. The increase in the HMW appears to have a more visible impact on equalized disposable household income for households with at least one MW earner (Figure 3a). The impact of a HMW increase becomes less visible when considering the full-population income distribution due to the inclusion of pensioner households in the sample (Figure 3c). In fact, although the increase of the HMW to 60 % of the median wage would affect about 19 million workers, its impact on the household income distribution of the whole EU population seems relatively small. In Section 4 we estimate the impact of HWM increases on inequality measures for these different populations to complement the graphical evaluation.
3.3 Measures of Inequality
The primary measure of inequality used in this study is the Gini coefficient. First, the reduction in EU-level income inequality after the HMW rise is measured using the Gini coefficient, although generalised entropy (GE) indices are computed for sensitivity analysis. Second, we compute the relative contribution of within-country and between-country inequality by exploiting the property of decomposition in non-overlapping groups respected by GE indices. As such, the Mean Logarithmic Deviation (GE0) and the Theil index (GE1) are computed at the EU level and are decomposed as follows:
where:
where v
m
is country m’s share of the total income;
Tests of statistical significance are carried out to evaluate the differences between the post and pre-reforms inequality indices.[14] Negative and zero income values, which are negligible for disposable income and do not exceed 4.5 % for gross income and 9.5 % for market income, are not considered in this testing procedure.
Some caveats should be considered when interpreting this simulation exercise. First and foremost, a limitation refers to the assumption of no employment effects and, secondly, to the assumption of no spillover effects. About the first caveat, there is a large number of studies that have recently documented empirically the employment effects consequential to minimum wage increases in many advanced economies. In general, research on the employment effects of minimum wages has not determined a consensual view as the variation of estimated employment effects across studies is very large (Neumark and Munguía Corella 2021). Thus, we are confident that employment effects due to rises in minimum wage floors, as hypothesised in this study, should not be exaggerated. Grünberger et al. (2022) have analysed possible negative employment effects using “own-wage elasticity” applied to wage increases for minimum wage earners and labor supply effects at the intensive margin using labor supply elasticities for similar HMW increases. Overall, they find relatively small impacts of simulated MW increases on employment and labor supply, never substantially exceeding 0.5 % of total employment even for the largest HMW increase and with much lower increases on labour supply at the intensive margins (% hours offered max +0.2 %). A large-scale and influential review of studies documenting the employment effects of minimum wage increases finds that the weight of the evidence indicates overall modest employment effects (Dube 2019).
We acknowledge the potential risk of employment effects resulting from minimum wage increases, particularly in countries where raising the minimum wage to 60 % of the median would represent a substantial adjustment. Countries with the lowest current minimum wages compared to our most generous scenario include Estonia, Malta, Ireland, Czechia, Latvia, the Netherlands, Croatia, Greece, Belgium, and Slovakia. However, prior research, such as Christl, Köppl-Turyna, and Kucsera (2018), suggests that Eastern European countries, including Czechia, Croatia, and Slovakia, where minimum wage are among the most distant from the most ambitious hypothetical levels, may have more room to raise minimum wages without significantly affecting employment, particularly among young workers. In turn, Germany, due to its size and economic influence, stands out as a country where employment effects from minimum wage increases could have EU-wide implications. In 2021, Germany’s Kaitz ratio was 51 %, and with the October 2022 minimum wage increase to 12 euros per hour, this ratio rose significantly. Nonetheless, a systematic review by Dutsch, Ohlert, and Baumann (2024) documenting the effects of minimum wages in Germany reports mixed findings: while employment reductions were observed following the 2017 minimum wage increase, no significant employment effects were noted for the increases in 2019 and 2020 among firms employing minimum wage workers. Thus, while an increase in the hypothetical minimum wage could potentially trigger employment effects, these studies highlight that the magnitude of such effects remains uncertain and should not be overstated even in countries where the proposed increase would be substantial, as it may depend on factors such as labour market conditions, the scale of the wage adjustment, and workers’ behavioral responses.
In turn, spillover effects may arise subsequently to a MW rise. It may be plausible that wages close to the new MW are affected by spillovers due to efficiency wage and/or reservation wage effects. However, these effects are empirically hard to quantify with household data, as surveyed by Autor, Manning, and Smith (2016) for the case of the US. Spillover effects are expected to be most significant in precisely those countries and scenarios where the direct effects of minimum wage increases are already substantial (see the case of Spain analysed by de Paz-Báñez, Sánchez-López, and Asensio-Coto (2024). Therefore, a consideration of these effects would likely not alter the conclusions of our study but would probably amplify them – both within and between countries.
In light of this uncertainty, this paper opts for a straightforward simulation approach, excluding employment effects and spillover effects while acknowledging the limitations this approach entails. By avoiding the assumption-heavy exercise of predicting employment impacts across EU countries and the subsequent second-round simulations on EU-wide inequality, we remain focus on a simplified, day-after simulation of minimum wage increases without incorporating behavioral responses. These complexities are beyond the scope of this paper and are left for future research.
4 Results
4.1 Inequality-Reducing Effect of Rising Hypothetical Minimum Wages (HMWs)
Inequality in equivalised disposable household income in the EU as measured by the Gini coefficient is around 33 % in 2019.[15] Increases in the HMW reduce EU-level inequality under all HMW scenarios. As expected, the higher the increase in the HMW, the larger the reduction in disposable income inequality (Figure 4). In detail, minimum wage floors, correspondent to 50 %, 55 % and 60 % of the national median wage, would reduce the EU-wide Gini coefficient of disposable income relative to the baseline by, respectively, 0.25 %, 0.4 % and 0.63 %.[16]

EU-wide income inequality. Gini coefficient, disposable incomes 2019. Note: EUROMOD simulations. The “current” baseline reflects minimum wages in 2019. Simulations respectively for hypothetical minimum wages equal to 50 %, 55 % and 60 % of the national median wage.
Albeit of little magnitude, these inequality changes after the HWM increase are statistically significant (Table 2). It is consequential that for the distribution of working-age EU households, the HMW has a more pronounced beneficial effect in reducing inequality. Zooming in on the two subpopulations of EU households with a minimum wage earner or households with at least one employee, the reduction in disposable income inequality is a bit more pronounced after the HMW increase, for the former more than for the latter distribution. For instance, hypothetical minimum wages set at least at 60 % of the median wage in all EU countries would reduce EU-level inequality by 1.25 % and 0.73 % in the distribution of respectively households with at least one minimum wage earner and households with at least one employee. This reflects the visual intuitions of Figure 3 and, unsurprisingly, highlights that a potential increase in minimum wage levels exerts larger inequality-reducing effect on the population of households more attached to the labour market.
To understand the dynamics behind this reduction in EU-level inequality it is useful to look at the two components of within- and between-country inequality, which are computed from the inequality decomposition. Previous studies show that within-country inequality is responsible for around 75 % of EU inequality while between-country inequality explains the remaining 25 % (Blanchet, Chancel, and Gethin 2020; Filauro and Parolin 2019).
The inequality reduction after the HMW increase depends first on the change in inequality in each country, which affects the within-country inequality. Second, changes in country-specific average incomes affect between-country inequality.
On the one hand, we expect within-country inequality to decrease because higher minimum wage floors have been shown to reduce gross wage inequality, or at least keep it constant, in all countries (Grünberger et al. 2022). Thus, lower wage inequality should normally result in a lower inequality of equivalised disposable household income. This implies that within-country inequality of equivalised disposable household income in the EU, i.e. the population-weighted average of country-level inequality indices, is also expected to decline as the HMW increases.
On the other hand, the impact of the HMW increase on between-country inequality is less clear-cut. The potential of a HMW increase to reduce between-country inequality depends on the country-specific position of HMW earners and the magnitude of their HMW increase, along the EU distribution. For example, low-pay households in countries such as Germany and Luxembourg, whose income conditions would improve significantly due to higher HMW, might be located in the middle-upper part of the EU income distribution. In other words, if a higher HMW increases the average national income of richer countries more than the average income of poorer EU countries, this might place the latter countries in a worse situation and in this way magnify between-country inequality.
As expected, the reduction in within-country inequalities is significant and increases as the HMW is set at higher levels (Figure 5). Thus, more generous HMWs have the potential to reduce within-country income inequality, triggering in this way a reduction in EU-level inequality.[17] Between-country inequality also declines under all three HMW scenarios. While the absolute reduction is smaller compared to within-country inequality, the relative reduction is of a similar magnitude (Figure 5 and Table A3).

EU-level inequality reduction, decomposition by country, disposable income, 2019. Note: EUROMOD simulations. The baseline reflects the distribution of EU disposable incomes in 2019, with the observed minimum wages. Relative reduction in EU-level inequality (%) is simulated for different hypothetical minimum wages. Mean logarithmic deviation (MLD) and Theil indices.
The indicators of between-country inequality measure the income differences between individuals based on the average income in each country. Therefore, a decline in between-country inequality implies some degree of convergence in average incomes across EU countries when the hypothetical minimum wage increases.[18] Although inequality-reducing, the general impact of a HMW increase on average incomes is small across countries. This effect is in the range of [−20; +20] ppp EUR in terms of average annual disposable income in the most ambitious scenario of HMW equal to 60 % of national median wage, as documented in Table A2. In a simulation exercise applied only to Member States with statutory minimum wages, the reduction in between-country inequality would be lower (Figure C1). In all cases, concerns that a coordinated rise in the minimum wage would significantly alter average incomes across countries are exaggerated.
4.2 Tax-Benefit Interaction with Minimum Wages and Impact on EU-Level Income Inequality
The redistributive effect of tax-benefit systems in the EU, as measured by the inequality reduction from the distribution of market to disposable income, is generally high. Recent estimates from EU-SILC show that the inequality reduction in passing from market incomes, including public pensions, to disposable incomes amounts to slightly over 20 % – a redistributive effect similar to that in France or Germany (Filauro and Fischer 2021). Blanchet, Chancel, and Gethin (2020) assess the redistributive power of tax-benefit systems in Europe with their integrated DINA dataset and find it similar, although they argue that this effect is overestimated with survey data.[19]
In all cases, the relatively high reduction in inequality attributable to tax-benefit systems is partly a result of the relative position of different EU countries in the EU distribution. Indeed, the largest market incomes in the EU distribution are those recorded in Nordic or high-income countries such as France or Germany. These market incomes are also those more subject to a substantial reduction after taxes due to the progressivity of their national tax systems. This is not the case for the largest market incomes observed in some Eastern European countries that are not at the top of the EU distribution. In fact, the slight progressivity of nearly flat-tax regimes in some Eastern European countries should not impair the overall redistributive effect at play in the EU distribution. Therefore, the compression of EU-level income distribution after taxes and transfers is partly due to national dynamics in the richer EU countries.
Our simulations indicate that an increase in HMW would reduce inequality also in EU-level market incomes by around 0.6 %. The overall percentage reduction in market income inequality is similar to that observed for disposable income, although the reduction in Gini points for market income inequality is greater. In turn, this inequality reduction is greater than that recorded for gross incomes (Table A4), due to the withdrawal of benefits after household market incomes rise due to higher HMW. These findings are robust across different inequality indices. Unsurprisingly the inequality reduction is larger for the population of EU households with a stronger attachment to the labour market (Table A5). As in the case of disposable income, the reduction in the Gini coefficient for market and gross incomes increases as the HMW is set at a higher level (Figure 6).

EU-wide income inequality. Gini coefficient, market (left) and gross income (right), 2019. Note: EUROMOD simulations. The “current” baseline reflects minimum wages in 2019. Simulations respectively for hypothetical minimum wages equal to 50 %, 55 % and 60 % of the national median wage.
The dynamics for the inequality reduction in market and gross incomes follows the same explanation as for disposable incomes (Figure 7). A HMW increase is very likely to bring about a reduction in within-country market inequality. In many EU countries, the increase in market income for low-pay workers is actually higher than after the interaction of taxes and benefits (Grünberger et al. 2022) because benefits can be withdrawn and income taxes may rise after a HMW increase. Therefore, a reduction in market incomes inequality is expected due to a reduction in within-country inequality.

EU-level inequality reduction, decomposition by country, market (left) and gross income (right), 2019. Note: EUROMOD simulations. The baseline reflects the distribution of EU disposable incomes in 2019, with the observed minimum wages. Relative reduction in EU inequality (%) is simulated for different hypothetical minimum wages. Mean logarithmic deviation (MLD) and Theil indices.
The percentage changes in between-country inequality are generally modest but more noticeable for market income than for disposable income. For both inequality indices analysed, but more clearly for the mean logarithmic deviation, a percentage reduction in between-country inequality is detectable and is of similar magnitude to the percentage change in within-country inequality for the most ambitious Kaitz ratio of 0.6 (Figure 7). This is likely due to the greater potential for increases in lower market incomes in relatively poorer member states with lower minimum wages.[20]
For gross incomes the impact of a HMW on between-country inequality is ambiguous in principle. This is because the withdrawal of transfers for HMW earners can be more noticeable in Eastern European countries rather than in more redistributive countries such as Germany or Belgium, potentially increasing the differences in average gross incomes across EU countries.[21]
Similar to market income, the reduction in EU-level inequality for gross incomes can be ascribed to both inequality components with a broadly similar dynamics (compare the right and left panels in Figure 7). There is a small but observable reduction in within-country inequality, reaching an almost 1 % reduction for the Theil index in the most ambitious HMW scenario. Our simulations show that between-country EU inequality also slightly decreases, at least in relative terms, as the HMW increases (Figure 7). In the most generous scenario of Kaitz ration of 0.6 the overall increase in average annual market incomes and gross incomes, after benefits, for all EU countries is contained within the range [−1; +27] ppp EUR (Table A2). Thus, the impact of HMW increases on the between-country inequality in both absolute and relative terms is of relatively moderate intensity. Still, the between-country inequality reduction seems to dominate the within-country reduction in both indices, especially for more ambitious floors of HMW. This is likely due to the composition effect of lower gross-income countries, which stand to gain the most from an increase to the most ambitious scenario, even net of potential social benefit withdrawals.
5 Conclusions
In the light of the renewed policy action at the EU level on minimum wages, there is a large debate on whether minimum wage policies reduce inequality. Skeptics of minimum wage policies argue that there are other labour policy tools to address inequality and relative poverty. Although it is documented that there are policies more effective than minimum wages to address market inequalities, nonetheless minimum wage policies may have positive effects on inequality reduction that should be correctly acknowledged.
Therefore, we simulate the impact on EU-level inequality of coordinated minimum wage increases correspondent to 50 %, 55 % and 60 % of the national median wage in the EU countries. To gauge the different impact between working-age population and the full population, we consider three types of households: (1) households with at least one person earning the hypothetical minimum wage or (2) households with at least one employee; and finally (3) all households.
The impact on EU-level inequality is then further decomposed into within- and between-country components for three income concepts: market, gross and disposable incomes. While the first income concept helps measure the effect of minimum wage policies on market income inequality irrespective of tax-benefit systems, the two subsequent concepts account for the complexities of tax-benefit systems by using a microsimulation model. To this end, we use the EU-wide microsimulation tool EUROMOD, which is unique in assessing the impact of EU-promoted policies in a coherent and comparable way.
Our findings indicate that, under the assumption of no employment or spillover effects, which suggests that the simulation results should be interpreted as a best-case scenario, higher minimum wages have the potential to make the distribution of income between EU households slightly more equal. This effect is small but significant across all income concepts, albeit to varying degrees. Unsurprisingly, the inequality reduction is larger for the subpopulation of EU households with greater labour market attachment, especially for EU households with at least one minimum wage earner.
Therefore, it is worth considering minimum wage policies in the policy toolkit to address EU-level income inequality, in conjunction with more effective instruments as proposed by Salverda (2021), especially given the dominant role that labour income convergence has played in equalizing incomes across the EU (Filauro, Parolin, and Valetto 2025). Albeit indirectly, this evidence addresses the concern that sluggish wage convergence, or even divergence and increasing between-country inequality, triggers workers to move from poorer to more affluent EU countries. Our results indicate that greater harmonisation in the minimum-wage setting mechanism across EU countries (similar Kaitz ratios) does not alter significantly inequality between countries, if anything, it improves it due to the larger room for increase in most less affluent EU countries. This result holds also for the most ambitious minimum wage rises and for the specific subpopulation of EU households with a minimum wage earner. Thus, this simulation exercise plays down the objection that coordinated, common principles for setting minimum wages at EU-level may result in larger cross-country mobility flows for minimum wage earners.
Finally, despite its limitations, this study may serve as a benchmark for those interested in examining the effect of EU policies on EU-level income distribution. As stated in the introduction, all policy reforms promoted by the EU, that have a heterogeneous impact on national income distributions, are likely to have an impact on EU-level distribution. If the concerns for greater income convergence across countries and trust in supranational institutions are to be taken seriously, future assessments of EU policies may well extend the national analysis of their income effects to the supranational dimension with EUROMOD.
Appendix A: Descriptive Statistics and Additional Analyses
Figure A1a shows the EU-wide distribution of average monthly gross wages, before and after assigning a minimum wage of 60 % of median wages. The average monthly gross wage is obtained by dividing yearly employment gross earnings by 12. Given the high heterogeneity in wage setting across countries, more than one peak is expected to appear in the distribution of wages. In fact, the wage distribution after assigning the HMW is trimodal, with peaks around 600 EUR, 2,000 EUR and 2,250 EUR. In addition to wage differences between countries, levels of average monthly gross wages depend on the working time and vary accordingly. As a consequence, observations are not concentrated at the country-specific HMW levels of Table 1. Instead, the level of average monthly wages can be close to zero if the yearly working time is low. Further, the average monthly wage can be higher than the HMW if the working time is more than the regular full-time working hours in the coutries (with a ceiling of 48 h). For that reasion we observe minimum wage earners with wages from 0 to almost 2,800 EUR.

EU-wide gross wage distribution of all workers: before and after applying HMW (panel a); gross wage distribution of HMW earners by region (panel b). Note: The distributions are based on kernel density estimates, probability density functions.
Statutory minimum wages and hypothetical minimum wages.
| Countries | Statutory | Median | Ratio: SMW/ | HMW as % of the | ||
|---|---|---|---|---|---|---|
| MW | median wages | wage | national median wage | |||
| 50 % | 55 % | 60 % | ||||
| Austria | NA | 2,910 | NA | 1,455 | 1,600 | 1,746 |
| Belgium | 1,594 | 3,167 | 50.3 % | 1,584 | 1,742 | 1,900 |
| Bulgaria | 286 | 477 | 60.0 % | 239 | 262 | 286 |
| Cyprus | NA | 1,582 | NA | 791 | 870 | 949 |
| Czechia | 519 | 1,159 | 44.7 % | 580 | 638 | 695 |
| Germany | 1,557 | 3,360 | 46.3 % | 1,680 | 1,848 | 2,016 |
| Estonia | 540 | 1,272 | 42.5 % | 636 | 699 | 763 |
| Denmark | NA | 4,602 | NA | 2,301 | 2,531 | 2,761 |
| Greece | 758 | 1,523 | 49.8 % | 761 | 837 | 914 |
| Spain | 1,050 | 1,903 | 55.1 % | 952 | 1,047 | 1,142 |
| Finland | NA | 3,082 | NA | 1,541 | 1,695 | 1,849 |
| France | 1,521 | 2,577 | 59.0 % | 1,288 | 1,417 | 1,546 |
| Croatia | 506 | 1,019 | 49.6 % | 510 | 561 | 611 |
| Hungary | 464 | 902 | 51.4 % | 451 | 496 | 541 |
| Ireland | 1,656 | 3,772 | 43.9 % | 1,886 | 2,074 | 2,263 |
| Italy | NA | 2,266 | NA | 1,133 | 1,246 | 1,359 |
| Lithuania | 555 | 1,075 | 51.6 % | 538 | 591 | 645 |
| Luxembourg | 2,071 | 3,837 | 54.0 % | 1,919 | 2,110 | 2,302 |
| Latvia | 430 | 941 | 45.7 % | 470 | 517 | 564 |
| Malta | 762 | 1,742 | 43.7 % | 871 | 958 | 1,045 |
| Netherlands | 1,616 | 3,324 | 48.6 % | 1,662 | 1,828 | 1,994 |
| Poland | 523 | 1,009 | 51.8 % | 505 | 555 | 606 |
| Portugal | 700 | 999 | 70.1 % | 499 | 549 | 599 |
| Romania | 446 | 805 | 55.5 % | 402 | 443 | 483 |
| Sweden | NA | 3,248 | NA | 1,624 | 1,786 | 1,949 |
| Slovenia | 887 | 1,542 | 57.5 % | 771 | 848 | 925 |
| Slovakia | 520 | 1,029 | 50.5 % | 515 | 566 | 618 |
-
Note: Statutory minimum wages from Eurofound (2021). Hypothetical minimum wages are derived from Eurostat data on median and wages. Hypothetical minimum wages which are smaller than actual statutory minimum wages are marked in grey.
Monthly average income (ppp EUR) before and after simulating a minimum wage equivalent to 60 % of the national median income. Various income concepts, 2019.
| Average income | Absolute increase (ppp EUR) from | |||||
|---|---|---|---|---|---|---|
| (ppp EUR) | baseline to 60 % of the median wage | |||||
| Baseline, disposable income | Baseline, market income | Baseline, gross income | Disposable income | Market income | Gross income | |
| AT | 2,123.1 | 2,139.6 | 2,358.3 | 3.2 | 5.1 | 4.6 |
| BE | 1,789.1 | 1,895.0 | 2,070.9 | 0.5 | 0.8 | 0.8 |
| BG | 896.2 | 874.2 | 922.9 | 2.8 | 3.8 | 3.7 |
| CY | 1,671.7 | 1,451.8 | 1,606.3 | 12.2 | 17.2 | 14.0 |
| CZ | 1,262.5 | 1,237.5 | 1,296.4 | 5.6 | 7.0 | 6.8 |
| DE | 2,041.5 | 2,250.3 | 2,406.1 | 12.0 | 22.4 | 21.0 |
| DK | 1,962.7 | 2,498.0 | 2,754.1 | 1.3 | 2.4 | 2.3 |
| EE | 1,278.6 | 1,172.4 | 1,305.9 | 17.4 | 21.9 | 21.6 |
| EL | 907.0 | 868.6 | 912.1 | 14.1 | 19.0 | 18.0 |
| ES | 1,421.9 | 1,308.8 | 1,421.1 | 13.7 | 14.3 | 13.6 |
| FI | 1,796.0 | 1,780.2 | 2,013.5 | 0.4 | 0.7 | 0.6 |
| FR | 1,971.0 | 1,853.7 | 2,040.9 | 3.8 | 5.4 | 5.2 |
| HR | 926.7 | 930.6 | 969.7 | 5.6 | 7.2 | 7.1 |
| HU | 800.0 | 880.2 | 920.3 | 8.4 | 3.8 | 4.3 |
| IE | 1,687.0 | 1,827.8 | 2,037.0 | 16.7 | 27.8 | 24.1 |
| IT | 1,554.3 | 1,483.0 | 1,605.4 | 2.1 | 3.0 | 2.9 |
| LT | 1,157.6 | 1,361.9 | 1,455.9 | 1.4 | 2.5 | 2.5 |
| LU | 2,661.3 | 2,509.9 | 2,766.7 | 13.4 | 24.1 | 18.5 |
| LV | 979.5 | 1,026.5 | 1,103.1 | 5.6 | 8.0 | 8.0 |
| MT | 1,730.9 | 1,750.9 | 1,827.0 | 5.6 | 7.6 | 7.2 |
| NL | 1,948.5 | 2,366.9 | 2,616.5 | −12.7 | 2.7 | 2.3 |
| PL | 1,068.9 | 1,074.8 | 1,167.2 | 8.8 | 13.7 | 13.1 |
| PT | 1,138.0 | 1,070.6 | 1,121.2 | 1.8 | 2.3 | 2.2 |
| RO | 623.0 | 718.6 | 760.7 | 6.4 | 11.9 | 11.8 |
| SE | 1,883.7 | 1,936.8 | 2,147.9 | 3.5 | 5.2 | 4.9 |
| SI | 1,359.7 | 1,382.9 | 1,534.2 | −2.6 | 2.0 | −1.8 |
| SK | 874.8 | 874.3 | 926.2 | 6.0 | 9.0 | 8.8 |
-
Source: EUROMOD simulations. Note: The baseline scenario reflects the distribution of EU disposable incomes in 2019, with the observed minimum wages. All EU households.
Inequality in the EU. Observed and simulated inequality indices for different hypothetical minimum wages, 2019 disposable incomes.
| Minimum wage level | Gini (%) | MLD × 100 | Theil × 100 | Within-country inequality, MLD | Between-country inequality, MLD | Within-country inequality, Theil | Between-country inequality, Theil | |
|---|---|---|---|---|---|---|---|---|
| Current level (baseline) | 32.94 | 20.19 | 19.24 | 15.28 | 4.91 | 14.91 | 4.33 | Disposable |
| 50 % of the median wage | 32.87 | 20.08 | 19.15 | 15.18 | 4.89 | 14.84 | 4.31 | |
| 55 % of the median wage | 32.82 | 20.02 | 19.10 | 15.14 | 4.88 | 14.80 | 4.30 | |
| 60 % of the median wage | 32.74 | 19.93 | 19.02 | 15.08 | 4.85 | 14.74 | 4.28 | |
| Current level (baseline) | 47.88 | 69.27 | 41.69 | 65.01 | 4.26 | 37.67 | 4.02 | Market |
| 50 % of the median wage | 47.78 | 69.06 | 41.53 | 64.81 | 4.25 | 37.52 | 4.01 | |
| 55 % of the median wage | 47.70 | 68.92 | 41.40 | 64.68 | 4.24 | 37.40 | 4.00 | |
| 60 % of the median wage | 47.58 | 68.72 | 41.20 | 64.51 | 4.21 | 37.22 | 3.98 | |
| Current level (baseline) | 46.40 | 61.25 | 39.05 | 56.23 | 5.02 | 34.38 | 4.67 | Gross |
| 50 % of the median wage | 46.34 | 61.15 | 38.95 | 56.14 | 5.01 | 34.28 | 4.67 | |
| 55 % of the median wage | 46.28 | 61.07 | 38.85 | 56.07 | 4.99 | 34.20 | 4.66 | |
| 60 % of the median wage | 46.18 | 60.95 | 38.71 | 55.99 | 4.96 | 34.08 | 4.63 |
-
Source: EUROMOD simulations. Note: Inequality decomposition by country. Reduction in EU-level inequality (%) simulated for different HMWs. The baseline reflects the distribution of EU disposable incomes in 2019, with the observed minimum wages. All EU households.
EU-level inequality reduction (%) simulated for different hypothetical minimum wages. Various inequality indices and income concepts, 2019.
| Minimum wage level | Gini | MLD | Theil | |
|---|---|---|---|---|
| 50 % of the median wage | −0.25 % | −0.55 % | −0.45 % | Disposable |
| 55 % of the median wage | −0.40 % | −0.83 % | −0.72 % | |
| 60 % of the median wage | −0.63 % | −1.27 % | −1.15 % | |
| 50 % of the median wage | −0.20 % | −0.30 % | −0.38 % | Market |
| 55 % of the median wage | −0.37 % | −0.50 % | −0.69 % | |
| 60 % of the median wage | −0.63 % | −0.79 % | −1.17 % | |
| 50 % of the median wage | −0.15 % | −0.17 % | −0.27 % | Gross |
| 55 % of the median wage | −0.28 % | −0.30 % | −0.51 % | |
| 60 % of the median wage | −0.49 % | −0.49 % | −0.89 % |
-
Source: EUROMOD simulations. Note: The baseline reflects the distribution of EU disposable incomes in 2019, with the observed minimum wages. All EU households.
EU-level inequality reduction simulated for different hypothetical minimum wages. Various income concepts and reference populations, 2019.
| Income concept | Difference from the baseline (gini points × 100) | Standard error | t | Confidence interval – low | Confidence interval – high | Household type | |
|---|---|---|---|---|---|---|---|
| Hypothetical | Disposable income | 0.207 | 0.0000541793443734 | 38.24 | 0.00197 | 0.00218 | All EU households |
| minimum | Market income | 0.304 | 0.0000731702735394 | 41.61 | 0.00290 | 0.00319 | |
| wage = 60 % | Gross income | 0.226 | 0.0000554677915347 | 40.83 | 0.00216 | 0.00237 | |
| median wage | Disposable income | 0.237 | 0.0000593995782545 | 39.92 | 0.00225 | 0.00249 | EU households with at least an employee |
| Market income | 0.340 | 0.0000795269404576 | 42.81 | 0.00325 | 0.00356 | ||
| Gross income | 0.261 | 0.0000612968016517 | 42.57 | 0.00249 | 0.00273 | ||
| Disposable income | 0.422 | 0.0001174318041553 | 35.94 | 0.00399 | 0.00445 | EU households with at least a MW earner | |
| Market income | 0.716 | 0.0001623311112534 | 44.09 | 0.00684 | 0.00747 | ||
| Gross income | 0.519 | 0.000123079488747 | 42.18 | 0.00495 | 0.00543 | ||
| Hypothetical | Disposable income | 0.130 | 0.0000416381095871 | 31.20 | 0.00122 | 0.00138 | All EU households |
| minimum | Market income | 0.177 | 0.0000525738140589 | 33.70 | 0.00167 | 0.00187 | |
| wage = 55 % | Gross income | 0.129 | 0.0000396400538205 | 32.55 | 0.00121 | 0.00137 | |
| median wage | Disposable income | 0.147 | 0.0000455693360779 | 32.31 | 0.00138 | 0.00156 | EU households with at least an employee |
| Market income | 0.198 | 0.000057374048605 | 34.46 | 0.00186 | 0.00209 | ||
| Gross income | 0.148 | 0.0000438751866705 | 33.74 | 0.00139 | 0.00157 | ||
| Disposable income | 0.309 | 0.0001082198899281 | 28.53 | 0.00288 | 0.00330 | EU households with at least a MW earner | |
| Market income | 0.515 | 0.0001461833138856 | 35.21 | 0.00486 | 0.00543 | ||
| Gross income | 0.362 | 0.0001089238606421 | 33.26 | 0.00341 | 0.00384 | ||
| Hypothetical | Disposable income | 0.082 | 0.0000330588433478 | 24.66 | 0.00075 | 0.00088 | All EU households |
| minimum | Market income | 0.097 | 0.0000361967494194 | 26.71 | 0.00090 | 0.00104 | |
| wage = 50 % | Gross income | 0.069 | 0.0000278467370555 | 24.65 | 0.00063 | 0.00074 | |
| median wage | Disposable income | 0.091 | 0.0000359807788496 | 25.33 | 0.00084 | 0.00098 | EU households with at least an employee |
| Market income | 0.108 | 0.0000395889032263 | 27.20 | 0.00100 | 0.00115 | ||
| Gross income | 0.078 | 0.0000306972667513 | 25.47 | 0.00072 | 0.00084 | ||
| Disposable income | 0.254 | 0.0001137388613094 | 22.31 | 0.00231 | 0.00276 | EU households with at least a MW earner | |
| Market income | 0.411 | 0.0001473822801714 | 27.87 | 0.00382 | 0.00440 | ||
| Gross income | 0.279 | 0.0001092511929536 | 25.53 | 0.00257 | 0.00300 |
-
Source: EUROMOD simulations. Note: The baseline reflects the distribution of EU disposable incomes in 2019, with the observed minimum wages. Standard errors, t-test and confidence intervals refer to the difference between the Gini of simulated distribution after the HMW and the baseline distribution.
Figure A1b shows the distribution of average gross wages for the sample of individuals receiving the HMW by geographical area: (1) Central and Eastern EU (5.7 Mio. workers), (2) Mediterranean EU (5.3 Mio. workers), and (3) Northern and Western EU (7.8 Mio. workers). The first peak in the distribution of gross wages of around 600 EUR is mainly due to the contribution of CEE countries like Poland, Slovakia, Croatia and Czechia. The second mode of around 2,000 EUR is driven by NWE countries like Germany and Belgium. Most of HMW workers earn around 1,000 EUR in the Mediteranean EU countries. A third peak of around 500 EUR is observed in Mediterranean countries as well as in Northern and Western EU countries, mainly driven by part-time workers.
In 2019, statutory minimum wages vary considerable across EU countries not only in absolute terms but also in relation to median and average wages. With 286 EUR, Bulgaria has the lowest monthly statutory minimum wage, while in Luxemburg the highest minimum wage of 2,071 EUR is paid. The ratios of the statutory minimum wage to median wages ranges from 42 % in Estonia to 60 % and 70 % respectively in Bulgaria and Portugal. Consequently, in Bulgaria and Portugal none of the scenarios analysed in this study would increase the statutory MW. On the contrary, in Czechia, Germany, Estonia, Greece, Croatia, Ireland, Latvia, Malta and the Netherlands all HMWs are higher than the statutory minimum wage. Given the wage differences within the EU, the level of HMW varies considerably across countries too. While HMWs in Romania are below 500 EUR, the HMW in Luxemburg goes up to 2,302 EUR per month.
Appendix B: Concepts
Income concepts.
| Market income | Gross income | Disposable income |
|---|---|---|
| + Gross employee cash or near cash income | + Gross employee cash or near cash income | + Gross employee cash or near cash income |
| + Company car | + Company car | + Company car |
| + Gross cash benefits or losses from self-employment | +Gross cash benefits or losses from self-employment | + Gross cash benefits or losses from self-employment |
| + Income from rental of a property or land | + Income from rental of a property or land | + Income from rental of a property or land |
| + Regular inter-household cash transfers received | + Regular inter-household cash transfers received | + Regular inter-household cash transfers received |
| + Interests, dividends, profit from capital investments | + Interests, dividends, profit from capital investments | + Interests, dividends, profit from capital investments |
| + Income received by people aged under 16 | + Income received by people aged under 16 | + Income received by people aged under 16 |
| + Pensions received from individual private plans | + Pensions received from individual private plans | + Pensions received from individual private plans |
| + Old-age benefits | + Old-age benefits | |
| + Survivor’ benefits | + Survivor’ benefits | |
| + Unemployment benefits | + Unemployment benefits | |
| + Sickness benefits | + Sickness benefits | |
| + Disability benefits | + Disability benefits | |
| + Education-related allowances | + Education-related allowances | |
| + Family/children related allowances | + Family/children related allowances | |
| + Social exclusion not elsewhere classified | + Social exclusion not elsewhere classified | |
| + Housing allowances | + Housing allowances | |
| − Regular taxes on wealth | ||
| − Regular inter-household cash transfer paid | ||
| − Tax on income and social insurance contributions |
Appendix C: Sensitivity Analyses Excluding Hypothetical Minimum Wage Increases in Countries Without Statutory Minimum Wages and Adopting an Alternative Approach to Identify Minimum-Wage Earners

EU-level inequality reduction, decomposition by country, disposable income, 2019. Note: EUROMOD simulations. The baseline reflects the distribution of EU disposable incomes in 2019, with the observed minimum wages. Relative reduction in EU-level inequality (%) is simulated for different hypothetical minimum wages. Mean logarithmic deviation (MLD) and Theil indices. HMW not applied in countries with actual minimum wages above the hypothetical scenarios.

EU-level inequality reduction, decomposition by country, market (left) and gross income (right), 2019. Note: EUROMOD simulations. The baseline reflects the distribution of EU disposable incomes in 2019, with the observed minimum wages. Relative reduction in EU inequality (%) is simulated for different hypothetical minimum wages. Mean logarithmic deviation (MLD) and Theil indices. HMW not applied in countries with actual minimum wages above the hypothetical scenarios.
This section presents the simulation results of a hypothetical minimum wage increase on EU-wide income inequality, following adjustments similar to those outlined by Grünberger et al. (2022).
Specifically, we exclude hypothetical minimum wage increases in countries without statutory minimum wages (Austria, Cyprus, Denmark, Finland, Italy, and Sweden). Additionally, we identify a larger number of workers as minimum wage earners compared to the analysis presented in the main text.
References
Atkinson, A. B. 1998. Poverty in Europe. Oxford: Blackwell Publishers.Search in Google Scholar
Autor, David H., Alan Manning, and Christopher L. Smith. 2016. “The Contribution of the Minimum Wage to US Wage Inequality Over Three Decades: A Reassessment.” American Economic Journal: Applied Economics 8 (1): 58–99. https://doi.org/10.1257/app.20140073.Search in Google Scholar
Benczúr, P., Z. Cseres-Gergeley, and P. Harasztosi. 2017. “EU-Wide Income Inequality in the Era of the Great Recession.” JRC Working Papers in Economics and Finance. 2017/14.Search in Google Scholar
Beramendi, P., and D. Rueda. 2014. “Inequality and Institutions: The Case of Economic Coordination.” Annual Review of Political Science 17: 251–71. https://doi.org/10.1146/annurev-polisci-032211-210535.Search in Google Scholar
Blanchet, T., L. Chancel, and A. Gethin. 2020. “Why is Europe More Equal than the United States?” WID.world Working Paper. 2020/19.Search in Google Scholar
Brandolini, A. 2007. “Measurement of Income Distribution in Supranational Entities: The Case of the European Union.” In Inequality and Poverty Re-examined, edited by Stephen P. Jenkins, and John Micklewright, 62–83. Oxford: Oxford University Press.10.1093/oso/9780199218110.003.0003Search in Google Scholar
Brandolini, A., and A. Rosolia. 2021. “The Distribution of Well-Being Among Europeans.” In Europe’s Income, Wealth, Consumption, and Inequality, edited by G. Fischer, and R. Strauss. New York: Oxford University Press.10.1093/oso/9780197545706.003.0002Search in Google Scholar
Burkhauser, R. V. 2015. “The Minimum Wage Versus the Earned Income Tax Credit for Reducing Poverty.” IZA World of Labor 153.Search in Google Scholar
Checchi, D., and C. García-Peñalosa. 2008. “Labour Market Institutions and Income Inequality.” Economic Policy 23 (56): 602–49. https://doi.org/10.1111/j.1468-0327.2008.00209.x.Search in Google Scholar
Christl, M., M. Köppl-Turyna, and D. Kucsera. 2018. “Revisiting the Employment Effects of Minimum Wages in Europe.” German Economic Review 19 (4): 426–65. https://doi.org/10.1111/geer.12135.Search in Google Scholar
Collado, D., N. Framarin, K. Gasior, H. X. Jara Tamayo, C. Leventi, K. Manios, D. Popova, and I. V. Tasseva. 2021. “Baseline Results from the EU28 EUROMOD: 2017–2020.” EUROMOD Working Paper Series. No. EM1/21.Search in Google Scholar
Darvas, Z. 2016. “Some are More Equal than Others: New Estimates of Global and Regional Inequality.” Bruegel 8.Search in Google Scholar
Dauderstädt, M., and C. Keltek. 2014. “Crisis, Austerity and Cohesion. Europe’s Stagnating Inequality.” International Journal of Health Services 45 (1): 4. https://doi.org/10.2190/HS.45.1.c.Search in Google Scholar
de Paz-Báñez, M. A., C. Sánchez-López, and M. J. Asensio-Coto. 2024. “Effects of the Minimum Wage (MW) on Income Inequality. Systematic Review and Analysis of the Spanish Case.” Economies 12: 223. https://doi.org/10.3390/economies12090223.Search in Google Scholar
Dube, A. 2019. “Impacts of Minimum Wages: Review of the International Evidence.” Independent Report. UK Government Publication, 268, 304.10.1257/app.20170085Search in Google Scholar
Dustmann, C., A. Lindner, U. Schönberg, M. Umkehrer, and P. Vom Berge. 2022. “Reallocation Effects of the Minimum Wage.” Quarterly Journal of Economics 137 (1): 267–328, https://doi.org/10.1093/qje/qjab028.Search in Google Scholar
Dütsch, M., C. Ohlert, and A. Baumann. 2024. “The Minimum Wage in Germany: Institutional Setting and a Systematic Review of Key Findings.” Jahrbücher für Nationalökonomie und Statistik 245 (1–2): 113–151, https://doi.org/10.1515/jbnst-2023-0038.Search in Google Scholar
Eurofound. 2017. “Income Inequalities and Employment Patterns in Europe Before and After the Great Recession.” Publications Office of the European Union.Search in Google Scholar
Eurofound. 2021. Monitoring Convergence in the European Union: Looking Backwards to Move Forward – Upward Convergence Through Crises, Challenges and Prospects in the EU Series. Luxembourg: Publications Office of the European Union.Search in Google Scholar
Eurofound. 2023a. Minimum Wages in 2023: Annual Review. Minimum Wages in the EU Series. Luxembourg: Publications Office of the European Union.Search in Google Scholar
Eurofound. 2023b. “Economic and Social Inequalities in Europe in the Aftermath of the COVID-19 Pandemic.” Luxembourg: Publications Office of the European Union.Search in Google Scholar
Eurofound. 2024. Minimum Wages: Non-Compliance and Enforcement Across EU Member States – Comparative Report. Luxembourg: Publications Office of the European Union.Search in Google Scholar
European Commission. 2020a. Annual Report on Intra-EU Labour Mobility 2020. Brussels: Directorate-General for Employment, Social Affairs and Inclusion (DG EMPL).Search in Google Scholar
European Commission. 2020b. Employment and Social Developments in Europe (ESDE) 2020. Brussels: Directorate-General for Employment, Social Affairs and Inclusion (DG EMPL).Search in Google Scholar
European Commission. 2021. Employment and Social Developments in Europe (ESDE) 2021. Brussels: Directorate-General for Employment, Social Affairs and Inclusion (DG EMPL).Search in Google Scholar
Fernandez-Macias, E., and C. Vacas-Soriano. 2016. “A Coordinated European Union Minimum Wage Policy?” European Journal of Industrial Relations 22 (2): 97–113. https://doi.org/10.1177/0959680115610725.Search in Google Scholar
Filauro, S., and G. Fischer, 2021. “Inequality in the EU: General Trends and Policy Implications.” VoxEU article.Search in Google Scholar
Filauro, S., and Z. Parolin. 2019. “Unequal Unions? A Comparative Decomposition of Income Inequality in the European Union and United States.” Journal of European Social Policy 29 (4): 545–63. https://doi.org/10.1177/0958928718807332.Search in Google Scholar
Filauro, S., Z. Parolin, and P. Valetto. 2025. “What Explains Recent Trends in Income Inequality in the European Union?” The Journal of Economic Inequality. https://doi.org/10.1007/s10888-024-09651-8.Search in Google Scholar
Garnero, A., S. Kampelmann, and F. Rycx. 2015. “Minimum Wage Systems and Earnings Inequalities: Does Institutional Diversity Matter?” European Journal of Industrial Relations 21 (2): 115–30. https://doi.org/10.1177/0959680114527034.Search in Google Scholar
Goedemé, T., K. Van den Bosch, L. Salanauskaite, and G. Verbist. 2013. “Testing the Statistical Significance of Microsimulation Results: A Plea.” International Journal of Microsimulation 6 (3): 50–77. https://doi.org/10.34196/IJM.00088.Search in Google Scholar
Grünberger, K., E. Narazani, S. Filauro, and Á. Kiss. 2022. “Social and Fiscal Impacts of Statutory Minimum Wages in EU Countries: A Microsimulation Analysis with EUROMOD.” IZA Journal of Labor Policy 12 (1). https://doi.org/10.2478/izajolp-2022-0009.Search in Google Scholar
Haapanala, H., I. Marx, and Z. Parolin. 2023. “Decent Wage Floors in Europe: Does the Minimum Wage Directive Get it Right?” Journal of European Social Policy 33 (4): 421–35. https://doi.org/10.1177/09589287231176977.Search in Google Scholar
Heidenreich, M. 2016. “The Europeanization of Income Inequality Before and During the Eurozone Crisis: Inter-, Supra- and Transnational Perspectives.” In Exploring Inequality in Europe: Diverging Income and Employment Opportunities in the Crisis, edited by M. Heidenreich, 22–45. Cheltenham: Edward Elgar Publishing.10.4337/9781783476664.00006Search in Google Scholar
International Labour Organisation (ILO). 2021. Global Wage Report 2020-21: Wages and Minimum Wages in the Time of COVID-19. Geneva: ILO.Search in Google Scholar
Jaumotte, F., and C. Osorio Buitron. 2015. “Power from the People: The Decline in Unionization in Recent Decades has Fed the Rise in Incomes at the Top.” Finance & Development 52 (1).Search in Google Scholar
Jenkins, S. P., and P. Van Kerm. 2012. “The Measurement of Economic Inequality.” In The Oxford Handbook on Economic Inequality, edited by W. Salverda, B. Nolan, and T. Smeeding, et al., 40–67. New York: Oxford University Press.Search in Google Scholar
Keese, M. 1998. “Are Statutory Minimum Wages an Endangered Species.” In Policies for Low Wage Employment and Social Exclusion, edited by Claudio Lucifora, 49–61. Milan: Franco Angeli.Search in Google Scholar
Lucifora, C., A. McKnight, and W. Salverda. 2005. “Low-Wage Employment in Europe: A Review of the Evidence.” Socio-Economic Review 3 (2): 259–92, https://doi.org/10.1093/ser/mwi011.Search in Google Scholar
Militaru, E., M. Emilia Popescu, A. Cristescu, and M. D. Vasilescu. 2019. “Assessing Minimum Wage Policy Implications Upon Income Inequalities: The Case of Romania.” Sustainability 11 (9): 2542, https://doi.org/10.3390/su11092542.Search in Google Scholar
Neumark, D., and L. F. Munguía Corella. 2021. “Do Minimum Wages Reduce Employment in Developing Countries? A Survey and Exploration of Conflicting Evidence.” World Development 137: 105165, https://doi.org/10.1016/j.worlddev.2020.105165.Search in Google Scholar
Redmond, P., K. Doorley, and S. McGuinness. 2021. “The Impact of a Minimum Wage Change on the Distribution of Wages and Household Income.” Oxford Economic Papers 73 (3): 1034–56, https://doi.org/10.1093/oep/gpaa048.Search in Google Scholar
Salverda, W. 2021. “Can the European Union Contain and Improve Income Inequality?” In Europe’s Income, Wealth, Consumption, and Inequality, edited by Georg Fischer, and Robert Strauss. Oxford: Oxford University Press.10.1093/oso/9780197545706.003.0015Search in Google Scholar
Sutherland, H. 2001. “EUROMOD: An Integrated European Benefit-Tax Model.” EUROMOD Working Paper No. EM9/01.Search in Google Scholar
Sutherland, H., and F. Figari. 2013. “EUROMOD: The European Union Tax-Benefit Microsimulation Model.” International Journal of Microsimulation 6 (1): 4–26, https://doi.org/10.34196/ijm.00075.Search in Google Scholar
© 2025 the author(s), published by De Gruyter, Berlin/Boston
This work is licensed under the Creative Commons Attribution 4.0 International License.
Articles in the same Issue
- Frontmatter
- Research Articles
- FRAND Licensing of Standard-Essential Patents: Comparing Realistic Ex-Ante and Ex-Post Contracts
- To Commit or Not to Commit in Product-Innovation Timing Games
- Coordinated Minimum Wage Policies: Impacts on EU-Level Income Inequality
- Regulatory Contestability and Cost Pass-Through
- Explaining the Economic Characteristics of Different International Peacekeeping Institutions
- Setting Reserve Prices in Repeated Procurement Auctions
- Public and Private School Grade Inflation Patterns in Secondary Education
- Estimating Labor Supply Elasticities in Korea: The Role of Limited Commitment Between Spouses
- Strategic Brand Proliferation: Monopoly versus Duopoly
- Letter
- Parental Investments During Labor Shocks: Evidence from Vietnam’s Marine Disaster