Pricing Personalised Drugs: Comparing Indication Value Based Prices with Performance Based Schemes
-
Laura Levaggi


Abstract
Price strategies are essential to balance timely access to drugs with expenditure containment. This is especially true for personalised drugs, whose effectiveness is heterogeneous across patients. For these drugs, some authors suggest to use Indication Based Price schemes (IBPs), while others argue that Performance-Based managed entry Agreements (PBAs) are more appropriate. We develop a theoretical model to compare the welfare properties of IBPs and PBAs in an environment where effectiveness is uncertain. The manufacturer observes heterogeneity in patients responses, but this information may be non verifiable. By contrast, the regulator can only observe data presented for listing purposes. We show that IBPs may allow to treat the efficient number of patients only if the social value of the drug is entirely appropriated by the manufacturer. PBAs may allow a fairer distribution of the social value, but their success depends on the contract rules and on the degree of uncertainty.
1 Introduction
On average, pharmaceuticals account for about a sixth of health expenditure across OECD countries (OECD 2020) and are one of the main drivers for the increase in the health care bill. In Europe, where care is mostly financed by public providers (OECD 2017), the price dynamics has put budgetary pressure on Governments, that are responding with more stringent regulations (Carone, Schwierz, and Xavier 2012; Eichler et al. 2011). Pricing new drugs is at the heart of this discussion, especially as concerns personalised medicine, which is characterised by heterogeneity in patients responses both across and within patients groups (Haslam, Kim, and Prasad 2022). For example, in 2018, of all targeted treatments in oncology, 75 % were used for multiple indications, some of them for over ten (Aitken et al. 2018; Michaeli, Mills, and Kanavos 2022; Mills et al. 2023; Vokinger and Kesselheim 2021). Immunotherapy, which is used against several cancer types, has a wide range of indications and its effectiveness is heterogeneous across them. Large differences in cost-effectiveness for the same active principle may thus emerge not only in oncology (see for instance the examples in Coyle, Buxton, and O’Brien 2003; Mestre-Ferrandiz et al. 2018). For these drugs the literature is increasingly suggesting the use of Indication value Based Price (IBP) schemes where the drug is sold under a price range that reflects the different levels of effectiveness across patients groups (Campillo-Artero et al. 2020; Chandra and Garthwaite 2017; Danzon, Towse, and Mestre-Ferrandiz 2015; Kaltenboeck and Bach 2018; Lakdawalla 2018; Mestre-Ferrandiz et al. 2015; Mestre-Ferrandiz et al. 2018; Vokinger and Kesselheim 2021).
Some authors, concerned with the sustainability of health care expenditure and the uncertainty in effectiveness for some drugs, propose instead to use Performance-Based managed entry Agreements (PBAs). Managed Entry Agreements (MEAs), combine several elements: (a) Cost-Effectiveness (C/E) thresholds set by the regulator; (b) a price, which is set either by the pharmaceutical company or by the regulator; (c) a rebate that depends on some budget indicators (financial agreements) or on the ex-post response to treatment (in performance based ones). Manufacturers and healthcare payers agree on a nominal price which is set to comply with the cost-effectiveness threshold, and sign confidential contracts either for price reduction (e.g. discounts, price/volume deals) or for performance based payment (e.g. patient-level payment-by-result or treatment continuation conditional to effectiveness) (Adamski et al. 2010; Garrison et al. 2013; Kim et al. 2020; Wenzl and Chapman 2019; Yu et al. 2017). For PBAs the price is uniform across patients that use the drug, but the agreement has a risk sharing component: if the effectiveness falls short of the contracted level, the pharmaceutical industry has to pay a rebate. Thus, there might be a difference between the price set ex-ante (at the listing stage) and the one that is actually paid ex-post (after observing patients responses). In this respect, PBAs allow to link price to value and to get differentiation, although through a very different process compared to IBPs.
In this article, we compare IBPs and PBAs in a context where effectiveness is uncertain and heterogeneous across patients groups. We show that a trade-off emerges between efficiency (treating the optimal number of patients) and equity (a price that allows to split the social value of the drug between consumers and the pharmaceutical industry). IBPs allow to treat the efficient number of patients (those for whom the marginal benefit is at least equal to the marginal cost) only if society allows the industry to get all the social value of the drug, while for PBAs efficiency depends on how the price and the threshold for paying the rebate are set.
2 IBPs Versus MEAs
IBPs and MEAs are suitable to price innovative drugs in the presence of heterogeneity in patients responses. Under IBPs in their pure form, the drug is marketed under an indication-specific price, which reflects the expected effectiveness of the drug. Effectiveness can be verified by the regulator through the results of the clinical trials presented by the manufacturer. Bach (2014) and Kaltenboeck and Bach (2018) propose to use this scheme to increase value for money of new drugs, since a uniform price would not reflect the differences in effectiveness across patients groups. Several authors agree that this pricing strategy accelerates patients’ access to new treatments, incentivates research and encourages the development of drugs also for indications of lower value for the firm, provided that the benefits still exceed costs (for a comprehensive discussion see e.g. the reviews by Campillo-Artero et al. 2020; Preckler and Espín 2022 and references therein). Chandra and Garthwaite (2017) are instead rather less optimistic on the effects of these schemes, which may increase price and reduce appropriateness. Finally, some of the literature argues that price differentiation does not seem to be essential when patients’ responses are heterogeneous (Hlávka et al. 2021; Lakdawalla 2018). Currently, the use of differentiated prices is limited to some European countries (see Preckler and Espín 2022 for a recent review) where some drugs (mostly used in oncology) are marketed at a single price followed by a confidential net price per indication.[1]
IBPs may be used only when patients are correctly stratified across groups, (i.e. the industry at the listing stage is able to provide some objective evidence that the drug effectiveness is different across patients groups), which often implies higher costs for the industry (Jobjörnsson et al. 2016) and a possible delay in listing. In some cases the only verifiable information at the listing stage is represented by aggregate statistical measures of patient-relevant endpoints (e.g. because of difficulties in stratification) or evaluation of outcomes based on surrogate endpoints (Toumi et al. 2017). In this case, the industry may still observe systematic differences across patients groups, or it may foresee how the surrogate endpoints will be transformed into effectiveness. Due to uncertainty in the real effectiveness, the manufacturer and the payer may hold different views about the potential value of the new drug. The industry may ask for a higher price than what the regulator, concerned about the risk of paying for a product that might not be cost-effective, thinks is reasonable. In this context, PBAs may be useful for the regulator to provide quicker access to new medicines, to share observed, but unverified information and to reduce the risk of making a poor coverage decision. From the industry point of view, the complexity, length, and burden of evaluating effectiveness (especially in terms of patient-relevant endpoints) in clinical trials are common issues that justify the use of PBAs.[2] For oncological drugs the literature considers PBAs an option, given the heterogeneity in patients’ responses and, in some cases, the lack of comparators (Bach 2014; Mailankody and Prasad 2015; Shu and Rizvi 2016). According to Wenzl and Chapman (2019) financial MEAs are used in at least two-thirds of OECD countries and EU member states, while performance-based ones are less common, but rapidly growing in number (Dabbous et al. 2020; Gamba, Pertile, and Vogler 2020; Lakdawalla 2018; Pauwels et al. 2017). They are frequently applied to oncological treatments and therapies for rare diseases.
Hlávka et al. (2021) argue that IBPs may be a valid alternative when heterogeneity in patients responses mainly derives from observable patients characteristics. The menu of prices is set by the industry, but it must satisfy the C/E threshold set by the regulator. The regulator bears all the risk if the ex-post effectiveness is below what paid for, but the manufacturer has to disclose the effectiveness differential among patients when listing for several indications and this information should be verifiable. PBAs require less information during trials, but rely on the ex-post verification of effectiveness, which may reduce the range of their practical implementation (Dabbous et al. 2020; Pauwels et al. 2017; Wenzl and Chapman 2019).
Most of the literature is concerned with the discussion about the theoretical rationale for the use of the two schemes, the review of their use in practice and the analysis of their economic impact in some case studies. From a more conceptual point of view, for risk-sharing agreements theoretical models have been built to study the strategic interactions among agents and the effects of their application on social welfare (for a review see Antonanzas et al. 2019). However, theoretical models that allow to formally examine and compare the two pricing schemes are still rather scant. As per the price, Levaggi and Pertile (2020a) show that, in a context where information on drug effectiveness is symmetric, the price for IBP is equal to an average value based price, but higher than a marginal value based price. In Gamba, Pertile, and Vogler (2020) an interesting framework is presented, where several types of MEAs are modelled, in an environment where the benefit of the drug is uncertain. The authors show that MEAs may contribute to increase rather than curb the price of new drugs if the manufacturer anticipates risk sharing. Their empirical analysis estimates the price increase to be about 5.9 %.
This work assesses the relative merits of IBPs and PBAs, in an environment where patients response to treatment is heterogeneous within and across groups. By building a common theoretical model for the two pricing schemes, it provides a unified framework where their relative merits may be assessed and their welfare properties, both in terms of social welfare and its distribution between consumers and the firm may be compared. Our analysis enables to suggest some rules that the regulator could use in order to balance equity and efficiency in a second best framework, where not all the relevant variables may be observed. It thus contributes to the present debate under different perspectives: (a) it compares pricing schemes whose use is deemed to increase in a more systematic way and it allows to spell out which are the differences both from the point of view of the industry, of the regulator, of the information that is available to both players; (b) from a policy point of view, it allows to compare these pricing schemes in terms of other indicators, such as patients treated and welfare properties, an issue that has to date received little attention in the literature. For PBAs we show the role that price setting has in defining value for money. In this environment where the information for the regulator is uncertain, it could be better to set a nominal price outside the MEA agreement instead of letting the industry propose one. Finally our model provides support for the evidence that rebates in PBAs are usually not able to sensibly reduce the price (Kaltenboeck and Bach 2018; Strohbehn et al. 2022).
3 The Model
3.1 The Environment
We consider a society where drugs are supplied for free to patients, either by a public provider or by a private insurance. A number of individuals, normalised to one for simplicity, is the target for a new drug that is about to be marketed. As in Hlávka et al. (2021), effectiveness e (measured, for example, by the expected gain in quality-adjusted life years – QALYs), varies across patients for two reasons:[3]
type of beneficiary/indication: with the advent of personalised medicine, drugs are increasingly tailored to specific groups of patients and effectiveness depends on how well their characteristics match the profile of the target patient;
individual patients characteristics that may influence effectiveness within each group.
Groups may be defined by type/indication and may be arranged according to their expected effectiveness in decreasing order. The identification of such groups is a complex process. It may originate from prior expectations about the existence of an effectiveness differential among patients with specific characteristics, which will lead the industry to test such prior with an appropriate choice of the randomised sample for the clinical trial. Or it may result from the clinical trial outcomes where patients may appear to cluster in groups whose effectiveness is more homogeneous. To simplify notation, the total number of groups is normalised to 1 and the variable x ∈ [0, 1] is used to identify the group of patients of type x. In each of them effectiveness e varies in a range that depends on x between a lower bound a(x) ≥ 0 and upper bound
Formally, we assume that the joint probability distribution of (x, e) has a (continuous) density function g(x, e). Then the marginal probability density function of x is:
while the conditional probability density function of e given x is:
Groups are arranged by expected effectiveness in decreasing order, therefore the value
which can be interpreted as the (expected) marginal effectiveness for group x, is strictly decreasing in x. Group-dependent expected effectiveness can be privately observed by the manufacturer, which can always order patients into groups, but it cannot observe the actual level for each single patient. Depending on the design of the randomised clinical trials, the information on group effectiveness may also be disclosed to the regulator and made verifiable.[4]
The money equivalent gain from health care is denoted by λ and translates (in money terms) the additional income society may gain from an extra unit of effectiveness. Consequently, it also represents the maximum amount of money society should pay for an extra unit of expected effectiveness. Suppose that access to the drug is provided to any patient in the groups x ∈ [0, n], i.e. to the fraction n of the patients groups with the largest marginal effectiveness. In our notation treating them with the new drug produces the following expected benefit:
R&D costs are sunk at this stage; we denote by c the marginal cost to produce the drug. We define the difference between the (money equivalent) health benefits and the costs as the social value of the drug:
The social value of the drug is split between consumers and the pharmaceutical industry through the price. In fact, while patients usually do not pay the drug at the point of use, expenditure has to be financed either through a tax or some other form of payment. Depending on the scheme, the price can vary with x or be constant and may depend on the treatment outcome; E[p](x) denotes the expected price in the general case. If we abstract from any distributional consideration, the consumer surplus, i.e. the part of the social value that accrues to consumer utility, is defined as the difference between the expected benefit and expenditure (Hlávka et al. 2021; Levaggi and Pertile 2020b) and is written as:
The profit, which is the part of the social value that is exploited by the manufacturer is:
3.2 The Rules of the Game
The industry proposes to list an innovative drug to the regulator for a price (or for a set of prices depending on the price scheme) and for a number of patients groups. Drugs are listed if the price proposed implies a cost per unit of effectiveness below a specific threshold (Jena and Philipson 2008; Jena and Philipson 2013), which can be determined in several ways (Levaggi and Levaggi 2021). In this article we use a scalar of the benefit to society which is equal to β ≤ λ. The choice of β < λ is justified as a measure to reduce the increase in prices for new drugs (see Capri and Antonanzas 2020 for a discussion).
Depending on availability and quality of information, different price setting schemes can be implemented. In this paper, along with an ideal (First Best) situation that serves as a benchmark for comparison, we are going to consider two different scenarios: in the first one, heterogeneity is verifiable and a scheme with differentiated value based prices for each group (IBPs) may be taken into consideration. In the second one, it is assumed that only the overall heterogeneity in patients responses is verifiable at the listing phase. The manufacturer is still able to estimate group dependent effectiveness (using non verifiable evidence collected throughout the randomised clinical trials, or through surrogate endpoints); this knowledge may still be used in price determination if the regulator allows to do so through a MEA. However, uncertainty in such an environment means that the social value of the drug is uncertain and the price has to be set carefully.
4 Results
In this section we compare the differences in terms of access to the treatment and price of pure IBPs and PBAs. To start with, we present an ideal situation where information is perfect. This solution represents the First Best outcome in terms of social value and is used as a benchmark to compare the properties of the analysed schemes.
4.1 First Best
First Best is represented by an ideal situation where both parties can observe the distribution g. Following the existing literature (Gamba, Pertile, and Vogler 2020; Hlávka et al. 2021; Levaggi 2014; Levaggi and Levaggi 2021), we assume that the price of new drugs is set through a Nash bargaining process between the national regulator and the drug company. Assuming that the objective of the regulator is to maximise consumer surplus, while the manufacturer maximises profit, denoting with α ∈ [0, 1] the bargaining power of the regulator and setting to zero the disagreement point, the solution solves the optimisation problem:
The Nash bargaining solution, in terms of drug price and number of groups treated (see Appendix B), yields the following result:
Proposition 1
If λM(1) < c < λM(0) the optimal number n FB solves the equation:
and the optimal price is:
If c ≤ λM(1) then n FB = 1, i.e. it is optimal to have complete coverage and the equitable price is as in (8).
For c ≥ λM(0) it is n FB = 0, i.e. the treatment is not cost-effective and no patient should receive it.
The optimal number n FB is such that the expected marginal benefit of the drug is equal the unit cost, as expected. If c ≤ λM(1) the marginal cost is low enough to make universal access optimal. If instead c ≥ λM(0) the marginal cost to produce the drug is so high that it is not cost effective even for the group with the highest expected effectiveness. The price is a weighted average (with the bargaining power being the weight) of the unit cost and the expected unit benefit. The price p FB distributes the social value as follows:
(for quantity X it is E[X]
FB
= E[X](n
FB
, p
FB
)). For α = 1, the regulator has the highest bargaining power and sets p to the lowest level p = c; for α = 0 the profit is maximised by setting the price to the highest level, hence consumer surplus is zero. When the two actors have some bargaining power, the price lies between these two extremes and the social value is distributed accordingly. The welfare properties of this solution are sketched for a simple case in Figure 1.[5] The marginal benefit for the new drug, represented by the blue curve, depends on the fraction of patients groups receiving the drug; the area below this curve is the total expected benefit (E[B] from Equation (2)). For some groups, the marginal benefit is lower than the marginal cost and it is optimal to treat up to n
FB
groups, those for which the marginal expected benefit is equal to the marginal cost. The shaded area (c − T − R) represents the social value of the drug in Equation (3), which is split between consumers and the pharmaceutical company. For example, for
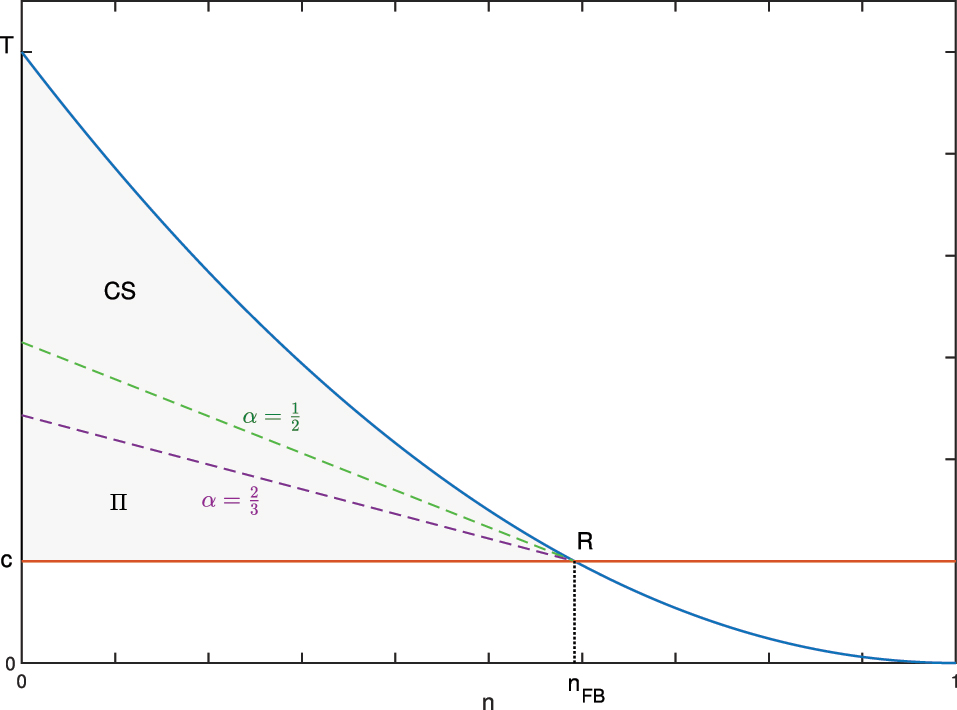
First Best solution: the optimal n FB is found through the intersection between the marginal benefit (blue curve) and the marginal cost (red line). The corresponding social value (grey area) is split between consumer surplus (CS) and profit (Π) according to the weight α.
The First Best may not be attainable because of uncertainty and asymmetry of information (Hlávka et al. 2021; Levaggi and Pertile 2020a; Levaggi and Pertile 2020b), but it can be used to evaluate the welfare properties of the pricing schemes that we are going to examine. When asymmetry of information prevails, the regulator has less control on the value for money, especially ex-ante. C/E thresholds are one of the instruments that the regulator may use; they make the listing process more transparent (Coyle, Buxton, and O’Brien 2003; Jena and Philipson 2008; Levaggi and Levaggi 2021), but they are not sufficient to improve value for money because pharmaceutical companies list for the highest price the regulator is open to accept (Hawkins and Scott 2011; Jena and Philipson 2008; Jena and Philipson 2013). Furthermore, when effectiveness is heterogeneous both within and across patients groups, the regulator needs to find pricing schemes that combine value for money with the need to grant sufficient incentives to invest into personalised drugs (Levaggi and Pertile 2020b). New pricing schemes that combine C/E with other incentives may be necessary. In what follows, we model pure Indication value-Based Prices (IBPs), and Performance-Based (Managed Entry) Agreements (PBAs).
4.2 Indication Value-Based Prices
Indication value Based Prices (IBPs) have been proposed as a relevant alternative in the presence of heterogeneous patients responses (Bach 2014; Campillo-Artero et al. 2020; Chandra and Garthwaite 2017; Hlávka et al. 2021; Kaltenboeck and Bach 2018; Mestre-Ferrandiz et al. 2015; Mestre-Ferrandiz et al. 2018) to make industries disclose information about and research into the differential in effectiveness across patients groups. The aim is to define a set of prices which are closer to society’s (monetary) evaluation of health for each group and at the same time to reduce uncertainty. In fact, this scheme requires that the information on the distribution of effectiveness is known to the manufacturer at the time of listing and that it is verifiable. Its disclosure allows the drug to be marketed under different prices, according to the expected effectiveness for each indication/group.
The timing of the game can be described as follows: the regulator sets the C/E threshold β ≤ λ for accepting listing, i.e. for each indication the ratio between price and average effectiveness has to be less than or equal to β. With this information in mind, the industry presents data on effectiveness and asks listing for the groups/indications x ∈ [0, n] at a proposed price for each of them. If the C/E constraint is satisfied the regulator lists the drug. The regulator bears all the risk if the ex-post effectiveness is below what paid for, but the manufacturer has to make the effectiveness differential among patient groups verifiable. The maximum acceptable unit price for each x, compatible with the threshold β is:
The manufacturer asks for p(x) = p IB (x) and sets the number n IB in order to maximise its profit. From (5) the problem can be written as:
In Appendix C the following result is proven:
Proposition 2
The optimization problem (9) admits an internal solution under the condition βM(1) < c < βM(0) and the optimal number of patients n IB satisfies the following condition:
The expected unit price is:
which is equal to the maximum price the regulator is willing to pay.
If c ≤ βM(1) then n IB = 1, i.e. the drug is made available to all patients and the formula for the expected price is the one in (11).
For c ≥ βM(0) it is n IB = 0, i.e. the drug is not marketed.
The results in Propositions 1 and 2, show that IBP reproduces the FB solution in terms of optimal number n if and only if β = λ, i.e. only if the regulator is open to pay the societal value for each unit of effectiveness. For β < λ the range of values for c for which an internal solution exists shrinks and shifts to the left with respect to the FB case. When an internal solution exists, from Equation (10) and since M is decreasing, if β < λ an inefficiently low number of patients are treated i.e. some patients for which the treatment would be cost-effective (the marginal cost is lower than the societal value) do not receive it in the IBP regime.
By comparing (8) and (11) we note that the average price for β = λ is equal to p FB with α = 0. In other words, in this case IBP allows to exploit the full social value of the drug. However, since
consumer surplus is equal to zero and all the social value is transformed into profit for the industry, as discussed in the literature (Campillo-Artero et al. 2020; Chandra and Garthwaite 2017; Claxton 2007). A part of the social value of the drug can be transformed into consumer surplus only when β < λ, but at the cost of a limitation in the access to the drug, since the number of patients treated is lower than in First Best.
4.3 PBAs
If the degree of uncertainty in the distribution of effectiveness among patients groups does not allow the implementation of IBPs, the manufacturer can either list using the verifiable information (the overall expected effectiveness) or it may invest in more R&D to make heterogeneity verifiable. In the first case, listing would be possible only for all the groups and an agreement based on cost-effectiveness would result in universal access (n = 1) at the lowest value based price. This solution may not be optimal both for the industry (profit could be higher if the drug were sold only to groups with higher effectiveness) and to society (unless universal access is optimal). Generating the additional evidence for listing under IBP has drawbacks both for the industry and the regulator. For the industry, it means an increase in costs and a postponement in the realisation of revenues from innovations; for the regulator it delays patients’ access to new drugs, thus reducing potential health benefits (Garrison et al. 2013; Jobjörnsson et al. 2016). An alternative are PBAs, which allow to speed up the availability – and marketing – of new drugs to patients. However, these agreements are made in an asymmetry of information framework, where the industry discloses unverifiable information on patients heterogeneity and the regulator has to decide how strong this evidence is.
In this section we analyse patient-level pay-for-performance agreements, where actual payment for the drug is linked to the attainment of a specific clinical metric, under different assumptions on the mechanism chosen for setting the price. In both cases, the manufacturer and the regulator agree on the target of patients groups n and the unit price p; the full price will be paid only for treatments whose ex-post effectiveness is above a specified threshold and a rebate is foreseen for therapies not reaching the response target (Adamski et al. 2010; Campillo-Artero et al. 2020; Cook, Vernon, and Mannin 2008; Gamba, Pertile, and Vogler 2020; Garattini, Curto, and van de Vooren 2015; Garrison et al. 2013; Kim et al. 2020; Lakdawalla 2018; Yeung, Li, and Carlson 2017; Yu et al. 2017; Zaric and O’Brien 2005; Zaric and Xie 2009; Zhang, Huang, and Yan 2022). In order to account for the variety of pricing mechanisms, we consider two different settings for the PBA: a first one where the regulator sets a threshold in terms of C/E for listing and the company asks for a value-based price that depends on n and a second one where the regulator sets a threshold in terms of price so that the latter is independent of n. In the first case, the manufacturer proposes listing for those indications that allow asking for a comparatively high price. In the second case, a different pricing mechanism is considered to allow to model frameworks such as external reference price schemes (Dickson and Redwood 1998; Holtorf et al. 2019; WHO 2020) or a choice of a threshold entirely made by the regulator. In both cases, due to the uncertainty in effectiveness, a risk sharing agreement may be envisaged and we study its effect on the access to the drug and its social value.
4.3.1 C/E Based Price
Information on the distribution g is available to the manufacturer, but at the time of listing is not verifiable, and thus not accessible to the regulator. The manufacturer proposes listing for n groups for an average expected effectiveness
In this case, the firm maximises the profit under the constraint
The manufacturer can observe the expected marginal effectiveness, but may be uncertain about whether the regulator will impose a risk sharing. Suppose that the manufacturer believes that a risk sharing contract will be offered with probability π. The expected profit for the manufacturer is:
where N(n, d) is the expected number of patients for which a rebate will be paid, i.e.
Thus, the optimisation problem for the manufacturer is:
The existence of an optimal couple (n in , p in ) can be proved under conditions similar to the ones in Proposition 4 (see Appendix D.1).
Proposition 3
For d such that
be the probability that for patients in group x effectiveness is lower than d and set:
If the function M is differentiable at zero, the following equation
is necessary for the optimisation problem in (13). If βM(0)(1 − π rφ(0, d)) > c and the function φ(x, d) is increasing in the first argument for all d, then f(n, d) is positive, a non zero solution n in of (15) exists whose corresponding price is:
Note that f the manufacturer thinks that the regulator will not impose risk sharing, i.e. π = 0, Equation (15) turns into (10), i.e. the condition for the existence of an internal solution, the groups treated and the price are the same as in IBP. The same is also true if d is such that N(n IB , d) = 0. In the latter case the manufacturer expects not to pay the rebate by choosing groups appropriately. However, if π > 0 and d is such that for n = n IB the probability of paying the rebate is non zero, the optimal n in is lower than n IB when f(n, d) is positive, because the rhs of (15) is greater than c and M decreases with n. Also, the corresponding price is higher. The condition on the monotonicity of φ(⋅, d) means that for patients belonging to group x the probability that the effectiveness is lower than d increases with x. This hypothesis is sufficient to grant that the term f(n, d) is positive. The optimal number of treatments is obtained only if β = λ and π f(n IB , d) = 0; ex-post the consumer surplus can be positive with a risk sharing agreement when the actual value of N(n IB , d) is positive. In all other cases, access to the drug is more restricted than what would be optimal, but consumer surplus is positive.
4.3.2 Price Cap
In the same information setting of Section 4.3.1, we now model a listing procedure where the selection of p does not depend on n: the regulator sets a threshold
where N(n, d) is the expected number of patients for which a rebate will be paid, as written in (12). As shown in Appendix D.2 the following holds:
Proposition 4
Let φ(x, d), the probability that for patients in group x effectiveness is lower than d, as defined in (14), be increasing in the first argument for all d. Let also
The manufacturer sets
In this case, the optimal number n
ex
is increasing in
If
The monotonicity condition on φ(⋅, d) guarantees existence in both Propositions 3 and 4 and means that for patients belonging to group x the probability that the effectiveness is lower than d increases with x. For a discussion on this property see Appendix D.3.
4.4 Comparing Access to the Drug
For IBP, the number of patients treated depends on the benefit compared with its cost and on the willingness to pay for each extra unit of effectiveness. For PBAs, also the ability of the manufacturer to correctly foresee risk sharing and the choice of d for reimbursement influence the results. In what follows we present an analysis and graphical representation of the roles of the parameters on access to the drug in the various schemes.
In Figure 2 the variation with respect to d of n in is compared against FB and IBP schemes for different choices of β and πr. When the price is set using a C/E threshold, PBAs may lead to the same number of patients treated under IBP either when the rebate is not envisaged when setting the price or if d is sufficiently low. If the regulator sets the C/E threshold equal to λ, the number of patients treated is the same as in FB, otherwise it is inefficiently low. If the risk of paying a rebate is too high, the industry proposes listing only for fewer groups to secure a higher net price and profit. Both the parameters πr and d have an influence on the outcomes, though the effect of an increase in d is higher than that of the term πr.
![Figure 2:
Access and social value comparison wrt to FB of IBP and PBA with C/E based price for g
c
(e∣x) = Beta(5, 3)(e) on [a(x), A(x)] with a(x) = (1 − x)2, A(x) = 3(1 − x)2 and effectiveness level range
d
∈
[
0
,
E
(
1
)
]
$d\in \left[0,\mathcal{E}\left(1\right)\right]$
.](/document/doi/10.1515/bejeap-2023-0150/asset/graphic/j_bejeap-2023-0150_fig_002.jpg)
Access and social value comparison wrt to FB of IBP and PBA with C/E based price for g
c
(e∣x) = Beta(5, 3)(e) on [a(x), A(x)] with a(x) = (1 − x)2, A(x) = 3(1 − x)2 and effectiveness level range
As for n
ex
, a graphical example of how it varies with
![Figure 3:
Access and social value comparison wrt to FB of PBAs with different prices thresholds for πr = 1 and g
c
(e∣x) = Beta(5, 3)(e) on [a(x), A(x)] with a(x) = (1 − x)2, A(x) = 3(1 − x)2 and effectiveness level range
d
∈
[
0
,
E
(
1
)
]
$d\in \left[0,\mathcal{E}\left(1\right)\right]$
.](/document/doi/10.1515/bejeap-2023-0150/asset/graphic/j_bejeap-2023-0150_fig_003.jpg)
Access and social value comparison wrt to FB of PBAs with different prices thresholds for πr = 1 and g
c
(e∣x) = Beta(5, 3)(e) on [a(x), A(x)] with a(x) = (1 − x)2, A(x) = 3(1 − x)2 and effectiveness level range
In Figure 4 access is compared for the two PBA schemes under different heterogeneity conditions on effectiveness. The red curves describe how n in depends on d for a PBA with C/E based price, the other curves pertain to PBAs with alternative price ceilings set by the regulator: p 2 corresponds to the highest price of the FB solution, p 1 and p 3 are respectively higher and lower than p 2. The left plot shows that when d is low n in = n IB = n FB . This result holds if the value of a(0), the lower bound of effectiveness for x = 0, is positive. If a(x) = 0, i.e. in any subgroup of patients unresponsiveness may happen, even for small values of d access is reduced. In both cases, as d increases, the number of groups that the manufacturer is open to list for steadily decreases and the number of patients for which a rebate will be paid increases, as expected.
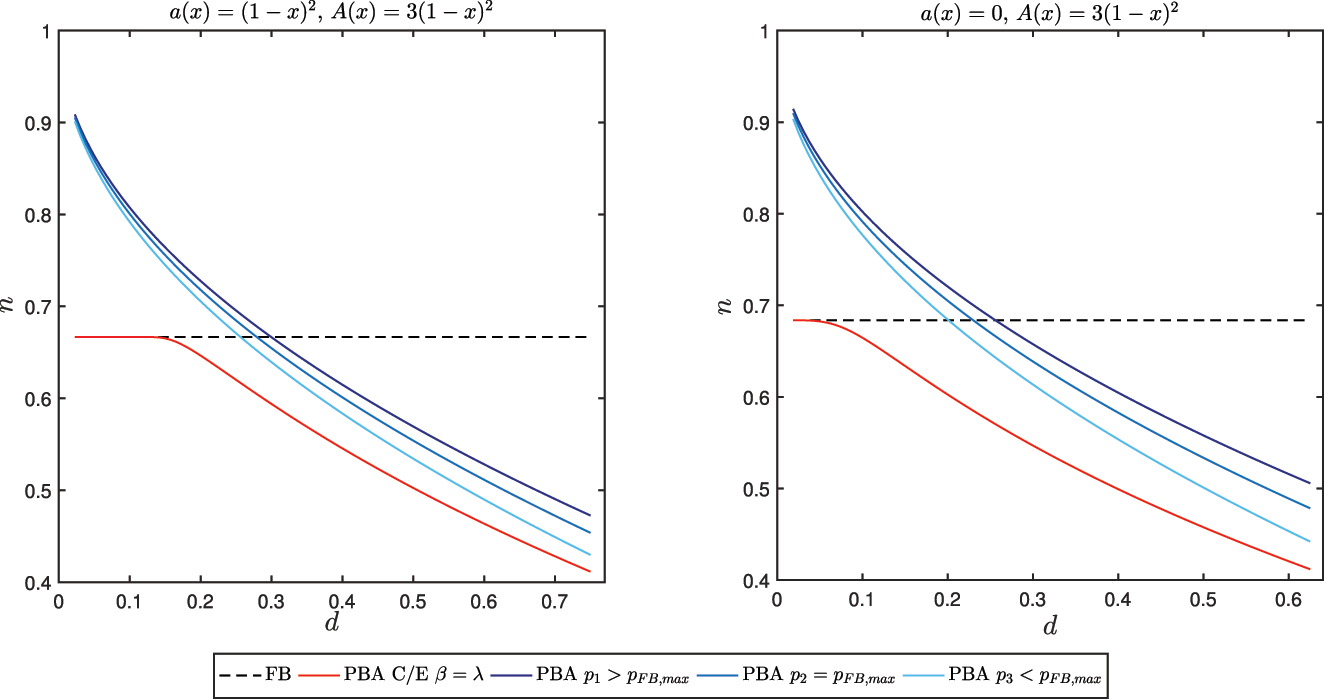
Effect of heterogeneity on access for PBAs.
4.5 Comparing the Effect on Prices
As discussed in Section 4.2, in IBP the optimal number of treatments is reached only when the social value is entirely allocated as profit.
For PBAs, the price is equal to the highest level, compatible either with the C/E threshold or the price ceiling set by the regulator. If the C/E threshold equals λ and the expected cost of the rebate is low, the proposed price is equal to the maximum of the FB case. Ex-post, for r > 0, the actual expenditure may be lower because of the rebate. As the risk sharing component becomes more significant for the industry, the number of groups for which the industry lists becomes lower than Fist Best. From Equation (16) the corresponding price is instead higher than both FB and IBP, since from the hypotheses on g the average expected effectiveness
![Figure 5:
Price and expenditure comparison wrt to FB of IBP and PBA with C/E based price for g
c
(e∣x) = Beta(5, 3)(e) on [a(x), A(x)] with a(x) = (1 − x)2, A(x) = 3(1 − x)2 and effectiveness level range
d
∈
[
0
,
E
(
1
)
]
$d\in \left[0,\mathcal{E}\left(1\right)\right]$
.](/document/doi/10.1515/bejeap-2023-0150/asset/graphic/j_bejeap-2023-0150_fig_005.jpg)
Price and expenditure comparison wrt to FB of IBP and PBA with C/E based price for g
c
(e∣x) = Beta(5, 3)(e) on [a(x), A(x)] with a(x) = (1 − x)2, A(x) = 3(1 − x)2 and effectiveness level range
For PBAs with a price ceiling set by the regulator, a sensible choice of d allows to avoid significant limitations in the access to the drug, while giving the regulator more control on total expenditure. As shown in Figure 6, through a reduction in the price threshold
![Figure 6:
Expenditure comparison wrt to FB of PBAs for different prices p with πr = 1 and g
c
(e∣x) = Beta(5, 3)(e) on [a(x), A(x)] with a(x) = (1 − x)2, A(x) = 3(1 − x)2 and effectiveness level range
d
∈
[
0
,
E
(
1
)
]
$d\in \left[0,\mathcal{E}\left(1\right)\right]$
.](/document/doi/10.1515/bejeap-2023-0150/asset/graphic/j_bejeap-2023-0150_fig_006.jpg)
Expenditure comparison wrt to FB of PBAs for different prices p with πr = 1 and g
c
(e∣x) = Beta(5, 3)(e) on [a(x), A(x)] with a(x) = (1 − x)2, A(x) = 3(1 − x)2 and effectiveness level range
5 Welfare Analysis
The number of patient groups treated and the price are not the only dimensions on which to evaluate drug price schemes. In this section we compare the expected social value (3), consumer surplus (4), and the ratio between consumer surplus and social value in the different settings, assuming that the regulator is open to pay λ for an extra unit of effectiveness. In general, the superiority of a scheme depends on the characteristics of the active principle (heterogeneity in effectiveness and its distribution across patients), on the rebate rate r and the effectiveness threshold d, on the price threshold
In what follows, we present some numerical examples that allow to understand the differences among the schemes proposed. We assume that r = 1, i.e. if the ex-post effectiveness of the drug is below d, the manufacturer will have to give back the entire price of the drug.
The expected social value is maximised when patients are treated up to the point where the expected marginal benefit is equal to the marginal cost, i.e. for n = n FB . In this respect, IBPs allows to reach the same exploitation of the social value, but with a consumer surplus equal to zero. This result is in line with the traditional microeconomic literature: pure IBP is a form of first-degree price discrimination that allows the firm to seize the entire consumer surplus (Campillo-Artero et al. 2020; Chandra and Garthwaite 2017; Claxton 2007).
As shown in Figure 2, for a PBA where the price is set using a C/E threshold, the social value may equal the optimum only if d is sufficiently low and a(0) > 0. As d increases, social value decreases because the industry reduces access, as shown in Section 4.4. If a maximal price is set by the regulator, social value is increasing in d for low values of d (when the number is higher than FB the expected gain for some patients is higher than the cost and by increasing d appropriateness is increased) and then decreasing because access falls under the optimal level.
When the price of the PBA is value based, it turns out to be equal or higher than the maximum of the FB solution, which is also the average price of IBP. When access is optimal, total expenditure may be lower than in IBP because of the rebates on treatments with a low value for money. An increase in d reduces total expenditure, as shown in Figure 5. If the price is chosen independently of n, total expenditure is decreasing both in
Figure 7 shows the combined effects on expected consumer surplus and its ratio over expected social value of changes in
![Figure 7:
Pricing schemes comparison on expected consumer surplus and ratio between consumer surplus and social value. Distribution g
c
(e∣x) = Beta(5, 3)(e) on [a(x), A(x)] with a(x) = (1 − x)2, A(x) = 3(1 − x)2, effectiveness level range
d
∈
[
0
,
E
(
1
)
]
$d\in \left[0,\mathcal{E}\left(1\right)\right]$
and πr = 1. Price p
2 correspond to the highest FB price, p
3 < p
2 < p
1.](/document/doi/10.1515/bejeap-2023-0150/asset/graphic/j_bejeap-2023-0150_fig_007.jpg)
Pricing schemes comparison on expected consumer surplus and ratio between consumer surplus and social value. Distribution g
c
(e∣x) = Beta(5, 3)(e) on [a(x), A(x)] with a(x) = (1 − x)2, A(x) = 3(1 − x)2, effectiveness level range
Heterogeneity (defined by the size of A(x) − a(x)) has a relevant role in welfare behaviour. The trade-off between consumer surplus and social value depends on the lower bound for effectiveness: the lower this bound, the lower the number of patients treated, especially if the price is set using a C/E threshold and the manufacturer foresees risk sharing (see Figure 4).
6 Discussion and Conclusions
Price regulation for new drugs is essential for equity and efficiency reasons; this is especially true for drugs whose effectiveness is heterogenous across patients groups. So far the literature has mostly studied the effects on price and access of these schemes. This analysis is certainly important, but also the dimension of the social value and of its distribution between consumers and the industry is quite relevant. In this article we have partially filled this gap by comparing the welfare properties of pure indication value based prices and pay-for-performance agreements, two schemes that allow to take into account differences in effectiveness across patients.
The settings into which these schemes are used are different: to implement IBPs the evidence about the effectiveness differential among patients has to be verifiable. We show that if the regulator is open to pay the full societal value of an extra unit of health care, IBPs allow to treat the optimal number of patients, but the social value becomes profit for the manufacturer. PBAs may allow listing for drugs in cases where collection of stronger evidence on effectiveness before listing may either cause undesirable delays or be unfeasible. However, uncertainty does not allow the regulator to define an optimal price scheme from a welfare point of view. With PBAs, if the threshold for response to the treatment is “sufficiently low” coverage may be optimal and at the same time the ex-post net price can be lowered through the rebate. The social value of the drug depends on access and the closer the number of groups treated to FB, the higher the social value. Our model shows that optimal access can be reached both using IBPs or in PBAs, when uncertainty is not too high: the proposal of value-based prices may be accepted by the regulator, if the industry is open to refund expenses for non responsive patients. Ex-post, consumer surplus may be slightly higher using PBAs than IBPs in this case, but a truly fairer distribution of benefits may not be reached. Theoretically, it would be possible to increase consumer surplus by increasing the minimal effectiveness for reimbursement, but only at the cost of a substantial reduction in the access to the new drug, which is as well not desirable. Some practical recommendations emerges from our analysis: firstly, price rather than C/E thresholds may in theory produce better welfare outcomes, but it is not easy in this context for the regulator (given its set of information) to set a maximal reimbursement that allows to reach this result. In fact, confidential discounts are a common feature in MEAs, thus nominal prices are kept high and this prevents these contracts to have an impact on external (international) reference pricing. This is obviously a desirable feature from the point of view of the industry, not from that of the payers (Wenzl and Chapman 2019). Secondly, the regulator should avoid agreements that penalise the manufacturer too much: to maximise profit, the probability of paying the rebate is reduced through the choice of a number of patients lower than optimal, as our results show, and prices are increased, as also shown by the theoretical and empirical analysis in Gamba, Pertile, and Vogler (2020).
Pay-for-performance schemes alone do not guarantee an improvement in the cost-effectiveness of the treatment. What these agreements offer to the regulator is generally a refund for non response; the actual effectiveness has to be measured through post-marketing research. Imposing a rebate safeguards the regulator from unpredictable fluctuations in the effectiveness of the treatment due to unobservable patients characteristics and the difficulty of classifying patients among groups. If uncertainty is not too high, a PBA may be preferred to IBP, because it allows to obtain the optimal access to the drug while avoiding paying for ineffective treatments, thus consumer surplus can be positive. Due to the difficulty in estimating the size of the reimbursement, the potential benefit has however to be weighed against the cost of implementation of the agreement. In fact, an increased administrative burden, usually on the payer’s side, related to both data collection (e.g. through patient registries) and selective reimbursement is seen as the main drawback in undertaking PBAs.
Whenever uncertainty in effectiveness is esteemed to be too high, other schemes should be implemented, for example forms of agreements such as Conditional Evidence Development (CED) (Garrison et al. 2013; Toumi et al. 2017). In any case, in these environments the setting of the price and the possibility to readjust it in time play a fundamental role. Also, an important point that should be addressed, is the availability to the public of reports on the performance of these agreements, non only to allow for their economic evaluation, but to enable the sharing of information on the effectiveness of treatments, something that is at present hindered by the confidentiality of contracts clauses.
For the practical application of these schemes, the difference in the costs involved in the R&D and the administrative process should also be considered. IBPs may require higher investments to verify the effectiveness differential; PBAs may be set forth when less precise information on effectiveness is available at listing. On the other hand, PBAs increase administrative costs since the effectiveness must be measured ex-post. Taking into account this added expense, the social value of the drug may be different under the two alternatives, and this is another factor that the regulator should evaluate when setting its pricing strategies.
In spite of the increasing number of drugs listed for multiple indications, IBPs are not widely used. Financial MEAs are more common, while outcome based schemes have so far been applied to specific therapeutic areas (Wenzl and Chapman 2019). Although a significant number of agreements have been completed, for few of them an assessment in terms of economic and clinical results has been performed (Antonanzas et al. 2019). From a financial point of view, the (scarce) evidence seems to point to savings of the order of few percentage points (1.3–1.7 %, up to 5 % in some cases (Antonanzas et al. 2019; Strohbehn et al. 2022)), thus confirming our result on the actual use of this class of PBAs. A thorough economic evaluation of their performance is however scant, due to the confidentiality that often characterises these contracts. In this respect, more transparency should be sought in order to understand the true effects of these instruments.
From a policy point of view our paper show that there are no easy solutions to the trade-off between the social value of the drug that can be exploited and the share of the latter that has to be left to the industry as profit. Uncertainty in the price regulation (in the form of rebates as in our model) may lead to a fairer division of the social value between patents and the industry, but at the cost of leaving some of the potential value of the drug unexploited. These results shows that more research is needed to study the effects of regulation in drug pricing due to the long-term horizon of investments in the drug industry.
The analysis presented in this paper could be extended in several directions. One important feature of several health care systems is the presence of copayments for drugs which may reduce the number of users especially when there is not a ceiling on the maximum amount paid by consumers. For IBPs two are the crucial issues: how copayment should differ across indications and which are the likely effects of this scheme on access to the drug (Preckler and Espín 2022); for MEAs the second issue is more relevant, along with the need to define rules for sharing the revenue from risk sharing between the regulators and consumers.
Another important dimension on which pricing schemes should be evaluated is their ability to promote R&D for a timely availability of new active principles. The trade-off between static and dynamic efficiency is in fact relevant (Chandra and Skinner 2012; Jena and Philipson 2008; Lakdawalla 2018; Levaggi, Moretto, and Pertile 2012; Vogler et al. 2017). In general, MEAs are more flexible and may allow innovation to reach the market more quickly (Filson 2012; Levaggi, Moretto, and Pertile 2017). IBPs require stratification in randomised clinical trials; this is certainly increasing the cost of R&D and may delay listing.
The two instruments (IBP and risk sharing) could of course be combined and a more general setting for the PBAs can be studied, for example by allowing the level of effectiveness for reimbursement to depend on the indication. We think that these might be an interesting avenues for future research.
Appendix A: Standing Hypotheses and Notation
| Parameters | Description |
|---|---|
| Modelling parameters | |
| e | Drug effectiveness under ideal circumstances |
| c | Marginal production cost |
| x ∈ [0, 1] | Patients groups label |
| [a(x), A(x)] | Range of effectiveness for patients of type x |
| λ | Money equivalent gain from health care |
| Distribution functions | |
| g(x, e) | Joint probability density function |
| g 1(x) | Marginal probability density function of x |
| g c (e∣x) | Conditional probability density function of e given x |
| Objective functions | |
| E[B](n) | Money equivalent expected benefit from treating n groups |
| E[SV](n) | Social value of the drug, defined as the money equivalent expected benefit minus the production cost |
| E[CS](n, p) | Consumer surplus defined as the money equivalent expected benefit minus expenditure for a unit (expected) price p |
| E[Π](n, p) | Profit of the firm |
| Decision variables | |
| n | Number of groups of patients to be treated |
| β | Willingness to pay for health gain under IBP and C/E threshold for PBA |
|
|
Maximum price threshold in PBA |
| d | Minimal effectiveness for full reimbursement |
| r | Rebate rate |
It is assumed throughout that the function:
is continuous and strictly decreasing in x, that g 1(x) > 0 for all x and is a continuous function.
Appendix B: First Best
Under complete information the optimisation problem is max n,p V(n, p) with:
with α ∈ [0, 1]. An internal solution exists under the assumption λM(1) < c < λM(0). From the F.O.C.s:
the following condition on the optimal value n FB is easily derived:
i.e. the expected marginal benefit of the drug has to equal the unit cost. The following optimal price p FB is then obtained:
thus the price is the weighted (through α) average of the unit cost and the unit benefit. The optimal number n
FB
is defined implicitly by the equation
and it is plain to see that the latter is split between consumer surplus and profit through α in the following way:
Appendix C: Indication Based Prices
From (9) the firm maximises the function:
The derivative wrt n is (βM(n) − c)g 1(n), thus from the hypotheses on M and g 1 an internal optimal point exists if βM(1) < c < βM(0) and the optimal number n IB is given by the following condition:
Thus n IB = n FB if and only if β = λ and in this case the social value is the same as in First Best, with a consumer surplus equal to zero, i.e. the scheme corresponds to FB with α = 0. If β < λ, since M is strictly decreasing, n IB < n FB and E[SV] IB < E[SV] FB .
Appendix D: Performance Based Agreements
Two different cases of PBAs are considered, both with a risk sharing component. In the first case, the firm proposes both p and n, expecting the drug to be listed only if the C/E is below a given threshold β, while in the second a maximum price
D.1 C/E Based Price
If the manufacturer believes that a risk sharing contract will be offered with probability π, the optimisation problem is written in terms of the expected profit as:
if r is the rebate rate and N(n, d) is the expected number of patients for which a rebate will be paid, as described in Equation (12).
Proof of Proposition 3
The objective function is strictly increasing in p and since
the goal is to find n such that the quantity
is maximised. Note that the function
From the definition of
and if M is differentiable at zero the same is true for
The smoothness requirement for M at zero is not necessary if the maximal
the derivative can be rewritten as:
and critical points satisfy the equation:
Note that, since N(n, d) increases in both n and d, from (18) it is obvious that if d is such that N(n IB , d) = 0, it is optimal to choose n in = n IB . For larger values of d the quantity N becomes positive for n < n IB . When f(n, d) is positive the rhs of Equation (21) is greater than c. In this case any critical point is lower than n IB because M decreases with n, while the corresponding price is higher. Let us then analyse the sign of f: the first summand is positive whenever N(n, d) > 0. From the definitions of g 1 and g c and Equation (12) it is:
Setting for simplicity:
one can write:
Thus, if the function φ(x, d) is non decreasing in the first argument for all d, from (20) it is f(n, d) > 0. If this is the case, to allow for the existence of a non zero maximum point it is sufficient to require that βM(0) > c + πrβf(0, d). Since
The expected profit for the firm is:
D.2 Price Threshold Set by the Regulator
The optimisation problem for the manufacturer reads:
where N(n, d) is the expected number of patients for which a rebate will be paid, as in Equation (12).
Proof of Proposition 4
Assume that d is such that N(1, d) > 0 and
Depending on d there exists a maximal
From (24) when φ(x, d) is increasing in x, since by its definition it is nondecreasing in d, the optimal number n
ex
is increasing in
For specific choices of d and
Expected total expenditure amounts to
D.3 Existence of a Solution
Both in Propositions 3 and 4 the existence of a solution is guaranteed under the hypothesis that the function φ(x, d) is increasing in the first argument for all d. In our setting, this is a realistic requirement, since it means that the probability that effectiveness is lower than d for patients belonging to group x increases with x. To give an illustration, let g(x, e) = ψ(x)ν(x, e) with ψ a probability density function on [0,1] and ν(x, e) a probability density function in e for each x. Then, for instance, the hypothesis is verified if for each x effectiveness e is uniformly distributed on [a(x), A(x)] or normally distributed with decreasing mean μ(x) and constant variance σ, under mild conditions on the bounds a(⋅) and A(⋅) and the mean μ(⋅). For example, in the first case it is
which is a non-decreasing function if a(⋅) and A(⋅) are decreasing since
References
Adamski, J., B. Godman, G. Ofierska-Sujkowska, B. Osinska, H. Herholz, K. Wendykowska, O. Laius, et al.. 2010. “Risk Sharing Arrangements for Pharmaceuticals: Potential Considerations and Recommendations for European Payers.” BMC Health Services Research 10 (1): 153. https://doi.org/10.1186/1472-6963-10-153.Search in Google Scholar
Aitken, M., M. Kleinrock, A. Simorellis, and D. Nass. 2018. “Global Oncology Trends 2018, Innovation, Expansion and Disruption.” Technical report. IQVIA Institute for Human Data Science.Search in Google Scholar
Antonanzas, F., C. Juárez Castelló, R. Lorente, and R. Rodríguez Ibeas. 2019. “The Use of Risk-Sharing Contracts in Healthcare: Theoretical and Empirical Assessments.” PharmacoEconomics 37 (12): 1469–83. https://doi.org/10.1007/s40273-019-00838-w.Search in Google Scholar
Bach, P. B. 2014. “Indication-Specific Pricing for Cancer Drugs.” JAMA – Journal of the American Medical Association 312 (16): 1629–30. https://doi.org/10.1001/jama.2014.13235.Search in Google Scholar
Campillo-Artero, C., J. Puig-Junoy, J. L. Segú-Tolsa, and M. Trapero-Bertran. 2020. “Price Models for Multi-Indication Drugs: A Systematic Review.” Applied Health Economics and Health Policy 18 (1): 47–56. https://doi.org/10.1007/s40258-019-00517-z.Search in Google Scholar
Capri, S., and F. Antonanzas. 2020. “Efficiency Ratio and Rocketing Drug Prices: Old Concerns and New Possibilities.” The European Journal of Health Economics 21 (9): 1273–7. https://doi.org/10.1007/s10198-020-01194-9.Search in Google Scholar
Carlson, J. J., S. Chen, and L. P. Garrison. 2017. “Performance-Based Risk-Sharing Arrangements: An Updated International Review.” PharmacoEconomics 35 (10): 1063–72. https://doi.org/10.1007/s40273-017-0535-z.Search in Google Scholar
Carone, G., C. Schwierz, and A. Xavier. 2012. “Cost-containment Policies in Public Pharmaceutical Spending in the EU.” European Economy-Economic Papers. European Commission-Economic and Financial Affairs.10.2139/ssrn.2161803Search in Google Scholar
Chandra, A., and C. Garthwaite. 2017. “The Economics of Indication-Based Drug Pricing.” New England Journal of Medicine 377 (2): 103–6. https://doi.org/10.1056/nejmp1705035.Search in Google Scholar
Chandra, A., and J. Skinner. 2012. “Technology Growth and Expenditure Growth in Health Care.” Journal of Economic Literature 50 (3): 645–80. https://doi.org/10.1257/jel.50.3.645.Search in Google Scholar
Claxton, K. 2007. “OFT, VBP: QED?” Health Economics 16 (6): 545–58. https://doi.org/10.1002/hec.1249.Search in Google Scholar
Cook, J., J. Vernon, and R. Mannin. 2008. “Pharmaceutical Risk-Sharing Agreements.” PharmacoEconomics 26: 551–6. https://doi.org/10.2165/00019053-200826070-00002.Search in Google Scholar
Coyle, D., M. J. Buxton, and B. J. O’Brien. 2003. “Stratified Cost-Effectiveness Analysis: A Framework for Establishing Efficient Limited Use Criteria.” Health Economics 12 (5): 421–7. https://doi.org/10.1002/hec.788.Search in Google Scholar
Dabbous, M., L. Chachoua, A. Caban, and M. Toumi. 2020. “Managed Entry Agreements: Policy Analysis from the European Perspective.” Value in Health 23 (4): 425–33. https://doi.org/10.1016/j.jval.2019.12.008.Search in Google Scholar
Danzon, P., A. Towse, and J. Mestre-Ferrandiz. 2015. “Value-Based Differential Pricing: Efficient Prices for Drugs in a Global Context.” Health Economics 24 (3): 294–301. https://doi.org/10.1002/hec.3021.Search in Google Scholar
Dickson, M., and H. Redwood. 1998. “Pharmaceutical Reference Prices. How Do They Work in Practice?” PharmacoEconomics 14 (5): 471–9. https://doi.org/10.2165/00019053-199814050-00002.Search in Google Scholar
Eichler, H.-G., E. Abadie, A. Breckenridge, B. Flamion, L. L. Gustafsson, H. Leufkens, M. Rowland, C. K. Schneider, and B. Bloechl-Daum. 2011. “Bridging the Efficacy-Effectiveness Gap: A Regulator’s Perspective on Addressing Variability of Drug Response.” Nature Reviews Drug Discovery 10 (7): 495–506. https://doi.org/10.1038/nrd3501.Search in Google Scholar
Filson, D. 2012. “A Markov-Perfect Equilibrium Model of the Impacts of Price Controls on the Performance of the Pharmaceutical Industry.” The RAND Journal of Economics 43 (1): 110–38. https://doi.org/10.1111/j.1756-2171.2012.00159.x.Search in Google Scholar
Gamba, S., P. Pertile, and S. Vogler. 2020. “The Impact of Managed Entry Agreements on Pharmaceutical Prices.” Health Economics 29 (S1): 47–62. https://doi.org/10.1002/hec.4112.Search in Google Scholar
Garattini, L., A. Curto, and K. van de Vooren. 2015. “Italian Risk-Sharing Agreements on Drugs: Are They Worthwhile?” The European Journal of Health Economics 16 (1): 1–3. https://doi.org/10.1007/s10198-014-0585-5.Search in Google Scholar
Garrison, L. P., A. Towse, A. Briggs, G. de Pouvourville, J. Grueger, P. E. Mohr, J. L. H. Severens, P. Siviero, and M. Sleeper. 2013. “Performance-Based Risk-Sharing Arrangements: Good Practices for Design, Implementation, and Evaluation: Report of the ISPOR Good Practices for Performance-Based Risk-Sharing Arrangements Task Force.” Value in Health 16 (5): 703–19. https://doi.org/10.1016/j.jval.2013.04.011.Search in Google Scholar
Haslam, A., M. S. Kim, and V. Prasad. 2022. “Overall Survival for Oncology Drugs Approved for Genomic Indications.” European Journal of Cancer 160: 175–9. https://doi.org/10.1016/j.ejca.2021.10.028.Search in Google Scholar
Hawkins, N., and D. A. Scott. 2011. “Reimbursement and Value-Based Pricing: Stratified Cost-Effectiveness Analysis May Not be the Last Word.” Health Economics 20 (6): 688–98. https://doi.org/10.1002/hec.1625.Search in Google Scholar
Hlávka, J. P., J. C. Yu, D. P. Goldman, and D. N. Lakdawalla. 2021. “The Economics of Alternative Payment Models for Pharmaceuticals.” The European Journal of Health Economics 22 (4): 559–69. https://doi.org/10.1007/s10198-021-01274-4.Search in Google Scholar
Holtorf, A.-P., F. Gialama, K. E. Wijaya, and Z. Kaló. 2019. “External Reference Pricing for Pharmaceuticals. A Survey and Literature Review to Describe Best Practices for Countries with Expanding Healthcare Coverage.” Value in Health Regional Issues 19: 122–31. https://doi.org/10.1016/j.vhri.2019.04.003.Search in Google Scholar
Jena, A. B., and T. Philipson. 2008. “Cost-Effectiveness Analysis and Innovation.” Journal of Health Economics 27 (5): 1224–36. https://doi.org/10.1016/j.jhealeco.2008.05.010.Search in Google Scholar
Jena, A., and T. Philipson. 2013. “Endogenous Cost-Effectiveness Analysis and Health Care Technology Adoption.” Journal of Health Economics 32 (1): 172–80. https://doi.org/10.1016/j.jhealeco.2012.10.002.Search in Google Scholar
Jobjörnsson, S., M. Forster, P. Pertile, and C. F. Burman. 2016. “Late-Stage Pharmaceutical R&D and Pricing Policies Under Two-Stage Regulation.” Journal of Health Economics 50: 298–311. https://doi.org/10.1016/j.jhealeco.2016.06.002.Search in Google Scholar
Kaltenboeck, A., and P. B. Bach. 2018. “Value-Based Pricing for Drugs: Theme and Variations.” JAMA 319 (21): 2165–6. https://doi.org/10.1001/jama.2018.4871.Search in Google Scholar
Kim, A. E., D. H. Choi, J. Chang, and S. H. Kim. 2020. “Performance-Based Risk-Sharing Arrangements (PBRSA): Is it a Solution to Increase Bang for the Buck for Pharmaceutical Reimbursement Strategy for Our Nation and Around the World?” Clinical Drug Investigation 40 (12): 1107–13. https://doi.org/10.1007/s40261-020-00972-w.Search in Google Scholar
Lakdawalla, D. N. 2018. “Economics of the Pharmaceutical Industry.” Journal of Economic Literature 56 (2): 397–449. https://doi.org/10.1257/jel.20161327.Search in Google Scholar
Levaggi, R. 2014. “Pricing Schemes for New Drugs: A Welfare Analysis.” Social Science & Medicine 102: 69–73. https://doi.org/10.1016/j.socscimed.2013.11.048.Search in Google Scholar
Levaggi, L., and R. Levaggi. 2021. “Value-Based Drug Price Schemes: A Welfare Analysis.” Journal of Pharmaceutical Health Services Research 12 (3): 357–62. https://doi.org/10.1093/jphsr/rmab043.Search in Google Scholar
Levaggi, R., and P. Pertile. 2020a. “Value-Based Pricing Alternatives for Personalised Drugs: Implications of Asymmetric Information and Competition.” Applied Health Economics and Health Policy 18 (3): 357–62. https://doi.org/10.1007/s40258-019-00541-z.Search in Google Scholar
Levaggi, R., and P. Pertile. 2020b. “Which Valued-Based Price when Patients are Heterogeneous?” Health Economics 29 (8): 923–35. https://doi.org/10.1002/hec.4033.Search in Google Scholar
Levaggi, R., M. Moretto, and P. Pertile. 2012. “Static and Dynamic Efficiency of Irreversible Health Care Investments Under Alternative Payment Rules.” Journal of Health Economics 31 (1): 169–79. https://doi.org/10.1016/j.jhealeco.2011.09.005.Search in Google Scholar
Levaggi, R., M. Moretto, and P. Pertile. 2017. “The Dynamics of Pharmaceutical Regulation and R&D Investments.” Journal of Public Economic Theory 19 (1): 121–41. https://doi.org/10.1111/jpet.12195.Search in Google Scholar
Mailankody, S., and V. Prasad. 2015. “Five Years of Cancer Drug Approvals.” JAMA Oncology 1 (4): 539. https://doi.org/10.1001/jamaoncol.2015.0373.Search in Google Scholar
Mestre-Ferrandiz, J., A. Towse, R. Dellamano, and M. Pistollato. 2015. “Multi-Indication Pricing: Pros, Cons and Applicability to the UK.” OHE Seminar Briefing. Office of Health Economics.10.1016/j.jval.2016.03.056Search in Google Scholar
Mestre-Ferrandiz, J., N. Zozaya, B. Alcalá, and Á. Hidalgo-Vega. 2018. “Multi-Indication Pricing: Nice in Theory but can it Work in Practice?” PharmacoEconomics 36 (12): 1407–20. https://doi.org/10.1007/s40273-018-0716-4.Search in Google Scholar
Michaeli, D. T., M. Mills, and P. Kanavos. 2022. “Value and Price of Multi-Indication Cancer Drugs in the USA, Germany, France, England, Canada, Australia, and Scotland.” Applied Health Economics and Health Policy 20 (5): 757–68. https://doi.org/10.1007/s40258-022-00737-w.Search in Google Scholar
Mills, M. J., D. Michaeli, A. Miracolo, and P. Kanavos. 2023. “Launch Sequencing of Pharmaceuticals with Multiple Therapeutic Indications: Evidence from Seven Countries.” BMC Health Services Research 23: 150. https://doi.org/10.1186/s12913-023-09095-2.Search in Google Scholar
OECD. 2017. “Health at a Glance 2017: OECD Indicators.” Technical report. OECD.Search in Google Scholar
OECD. 2020. “OECD Health Statistics 2019.” Technical report. OECD.Search in Google Scholar
Pauwels, K., I. Huys, S. Vogler, M. Casteels, and S. Simoens. 2017. “Managed Entry Agreements for Oncology Drugs: Lessons from the European Experience to Inform the Future.” Frontiers in Pharmacology 8: 171. https://doi.org/10.3389/fphar.2017.00171.Search in Google Scholar
Preckler, V., and J. Espín. 2022. “The Role of Indication-Based Pricing in Future Pricing and Reimbursement Policies: A Systematic Review.” Value in Health 25 (4): 666–75. https://doi.org/10.1016/j.jval.2021.11.1376.Search in Google Scholar
Shu, C. A., and N. A. Rizvi. 2016. “Into the Clinic with Nivolumab and Pembrolizumab.” The Oncologist 21 (5): 527–8. https://doi.org/10.1634/theoncologist.2016-0099.Search in Google Scholar
Strohbehn, G. W., J. H. Cooperrider, D. Yang, M. A. Fendrick, M. J. Ratain, and G. S. Zaric. 2022. “Pfizer and Palbociclib in China: Analyzing an Oncology Pay-For-Performance Plan.” Value in Health Regional Issues 31: 34–8. https://doi.org/10.1016/j.vhri.2022.01.007.Search in Google Scholar
Tie, Y., H. Yang, R. Zhao, H. Zheng, D. Yang, J. Zhao, and M. Liu. 2019. “Safety and Efficacy of Atezolizumab in the Treatment of Cancers: A Systematic Review and Pooled-Analysis.” Drug Design, Development and Therapy 13: 523–38. https://doi.org/10.2147/dddt.s188893.Search in Google Scholar
Toumi, M., S. Jarosławski, T. Sawada, and Å. Kornfeld. 2017. “The Use of Surrogate and Patient-Relevant Endpoints in Outcomes-Based Market Access Agreements.” Applied Health Economics and Health Policy 15 (1): 5–11. https://doi.org/10.1007/s40258-016-0274-x.Search in Google Scholar
Vogler, S., V. Paris, A. Ferrario, V. J. Wirtz, K. de Joncheere, P. Schneider, H. B. Pedersen, G. Dedet, and Z. U. D. Babar. 2017. “How Can Pricing and Reimbursement Policies Improve Affordable Access to Medicines? Lessons Learned from European Countries.” Applied Health Economics and Health Policy 15 (3): 307–21. https://doi.org/10.1007/s40258-016-0300-z.Search in Google Scholar
Vokinger, K. N., and A. S. Kesselheim. 2021. “Value-based Pricing of Drugs with Multiple Indications or in Combinations – Lessons from Europe.” Nature Reviews Clinical Oncology 19 (1): 1–2. https://doi.org/10.1038/s41571-021-00561-6.Search in Google Scholar
Wenzl, M., and S. Chapman. 2019. “Performance-Based Managed Entry Agreements for New Medicines in OECD Countries and EU Member States: How They Work and Possible Improvements Going Forward.” OECD Health Working Papers 115. OECD Publishing.Search in Google Scholar
WHO. 2020. “WHO Guideline on Country Pharmaceutical Pricing Policies.” Technical report. World Health Organization.Search in Google Scholar
Yeung, K., M. Li, and J. J. Carlson. 2017. “Using Performance-Based Risk-Sharing Arrangements to Address Uncertainty in Indication-Based Pricing.” Journal of Managed Care and Specialty Pharmacy 23 (10): 1010–5. https://doi.org/10.18553/jmcp.2017.23.10.1010.Search in Google Scholar
Yu, J. S., L. Chin, J. Oh, and J. Farias. 2017. “Performance-Based Risk-Sharing Arrangements for Pharmaceutical Products in the United States: A Systematic Review.” Journal of Managed Care & Specialty Pharmacy 23 (10): 1028–40. https://doi.org/10.18553/jmcp.2017.23.10.1028.Search in Google Scholar
Zaric, G. S., and B. J. O’Brien. 2005. “Analysis of a Pharmaceutical Risk Sharing Agreement Based on the Purchaser’s Total Budget.” Health Economics 14 (8): 793–803. https://doi.org/10.1002/hec.976.Search in Google Scholar
Zaric, G. S., and B. Xie. 2009. “The Impact of Two Pharmaceutical Risk-Sharing Agreements on Pricing, Promotion, and Net Health Benefits.” Value in Health 12 (5): 838–45. https://doi.org/10.1111/j.1524-4733.2009.00510.x.Search in Google Scholar
Zhang, H., T. Huang, and T. Yan. 2022. “A Quantitative Analysis of Risk-Sharing Agreements with Patient Support Programs for Improving Medication Adherence.” Health Care Management Science 25: 253–74. https://doi.org/10.1007/s10729-021-09587-9.Search in Google Scholar
© 2024 Walter de Gruyter GmbH, Berlin/Boston
Articles in the same Issue
- Frontmatter
- Research Articles
- Tradeoffs in the Power of Regulatory Regimes
- Pay as You Throw Threshold Tariff: Evidence on the Incentive to Recycle
- Industrial Technology Boundary, Product Quality Choice, and Market Segmentation
- Human Capital Investments and Family Size in Italy: IV Estimates Using Twin Births as an Instrument
- Maternal Labour Supply and School Enrolment Laws: Empirical Evidence from Brazilian Primary School Reforms
- Pricing Personalised Drugs: Comparing Indication Value Based Prices with Performance Based Schemes
- The Impact of Migration on Productivity: Evidence from the United Kingdom
- In the Eye of the Storm: The Disrupted Career Paths of Young People in the Wake of COVID-19
- Separating the Accountability and Competence Effects of Mayors on Municipal Spending
- Letters
- Close But Not Too Close? Optimal Copycat Strategies in the Light of Negative Publicity by the Original Product
- Keeping Mobile Firms at Home: The Role of Public Enterprise
- The Trouble with Take-Up
- Sex Ratio and Terrorist Group Survival