Medium and high energy electron detectors onboard BeiDou navigation satellite in MEO
-
Huanxin Zhang
 ,
Guohong Shen
,
Guohong Shen

Abstract
This work introduces the instruments’ design of multi-directional medium-energy electron detector (energy range: 30–770 keV) and high-energy electron detector (energy range: 400 keV to 5.8 MeV) deployed on one of the BeiDou navigation satellites in medium earth orbit. Through the electromagnetic compatibility design, the problem of the detector signal being susceptible to electromagnetic interference is solved and the lower detection limit reaches a very low level of 20 keV. The proton contamination in the electron measurement can be effectively removed by designing the light-blocking layer and the logical working mode of the sensors. The detector circuits and sensor structure are optimized and the miniaturization of the instrument is realized. This study also introduces the calibration method of the detectors, and gives the ground test results, which can provide a basis for the on-orbit calibration and data processing of the instrument.
1 Introduction
Medium earth orbit (MEO) is located in the central area of the outer radiation belt. The orbit is electron rich (Li and Temerin 2001), and accompanied by frequent geomagnetic disturbances and drastic changes in the space environment (Li et al. 2001). When a geomagnetic storm occurs, a large number of “killer electrons” will be generated in this orbit, which will threaten the safety of satellite by charging and discharging effects of dielectrics on it (Lanzerotti et al. 1998, Beech et al. 1994). Before a geomagnetic storm, the flux and pitch angle of medium energy electrons will change significantly (Yang et al. 2015), and the flux of high energy electrons will increase sharply during the geomagnetic storm (Gubby Robin 2002). Therefore, the simultaneous measurement of medium and high energy electrons will effectively serve the prediction and alarm of geomagnetic storm (Iles et al. 2002, Bogorad et al. 1995).
One of BeiDou navigation satellites in MEO is equipped with a three-directional medium-energy electron detector (MED), a high-energy electron detector (HED), and an electronics box they share.
This article is organized as follows: Section 2 introduces the scientific indicators and engineering requirements of the detectors. Section 3 describes the design scheme of both the detectors in detail, including the sensor design, electronics design, and structure design. Section 4 discusses the principle of calibration and the testing results of ground calibration.
2 Instrument parameters
2.1 Scientific indicators
According to the radiation belt model AE8, the energy of medium- and high-energy electrons ranges from tens of keV to several MeV (Gombosi 1998) in the quiet time of space environment. As mentioned, during the geomagnetic disturbance, the energy spectra and flux of electrons will change significantly, so will the pitch angle distribution of electrons (Li et al. 1997). Therefore, wide energy spectra and multi-directional measurement are very necessary. The two detectors together can measure electron energy of 30 keV to 5.8 MeV and output multiple energy channels. Detailed scientific indicators are shown in Table 1.
Scientific indicators of the MED and HED
| Parameters | MED | HED |
|---|---|---|
| Field of view | 60° (divided into three directions) | 30° (one direction) |
| Energy range | 30–770 keV | 0.4–5.8 MeV |
| Energy channels | 30–46 keV | 0.4–0.5 MeV |
| 46–72 keV | 0.5–0.6 MeV | |
| 72–140 keV | 0.6–0.77 MeV | |
| 140–230 keV | 0.77–1.3 MeV | |
| 230–410 keV | 1.3–1.7 MeV | |
| 410–600 keV | 1.7–2.0 MeV | |
| 600–770 keV | 2.0–2.2 MeV | |
| 2.2–3.0 MeV | ||
| 3.0–4.1 MeV | ||
| 4.1–5.8 MeV | ||
| Similar instruments on other satellites | Energy range of MED on FY-3 satellite is 50–400 keV | Energy range of HED on earlier BeiDou navigation satellites is 600 keV to 2 MeV |
2.2 Engineering requirements
Limited by the satellite resources, the instrument is miniaturized to the greatest extent. Compared with similar instruments on the earlier BeiDou navigation satellites, the mass, power consumption, and size of each component are greatly reduced. Detailed engineering requirements are shown in Table 2.
Engineering requirements for the detectors
| Parameters | Electronics box | HED | MED |
|---|---|---|---|
| Volume | 164.3 mm × 86 mm × 185 mm (±1 mm) | 100 mm × 100 mm × 100 mm (±1 mm) | 90 mm × 90 mm × 90 mm (±1 mm) |
| Mass | 2.4 ± 0.2 kg | 1.2 ± 0.1 kg | 1.2 ± 0.1 kg |
| Power consumption | <8.0 W | <1.5 W | <1.5 W |
| Operating temperature | −25°C to +45°C | ||
| Lifetime | 8 years | ||
3 Instrument design
3.1 Overall design and implementation
The system block diagram is shown in Figure 1. The electronics box is responsible for signal acquisition, data processing and it provides a secondary power supply (±12 V) for detectors. At the same time, it communicates with the satellite interface equipment via the 422 bus to complete data transmission, receive satellite broadcasting, and data injection commands.
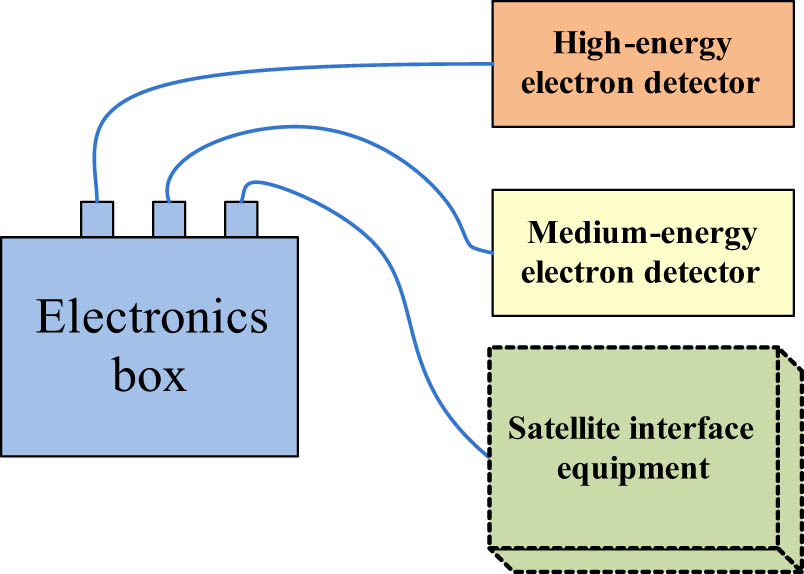
System block diagram.
Figure 2 shows the working principle of the electronics system. The scientific data formation cycle is 4 s. In the process of scientific data collection, high-energy electron detection and medium-energy electron detection are carried out independently and parallelly without interfering with each other. The data collection of HED and MED is driven by particle event triggering. When a particle enters the sensitive area of sensor, the sensor generates a charge pulse signal, which enters the threshold comparator after being amplified by the pre-amplifier and the main amplifier. The threshold comparator outputs a trigger pulse when the input signal amplitude is higher than the preset lower threshold. After receiving any trigger pulse, the corresponding AD converters start the conversion process, then the logic control circuit in FPGA divides the energy channel according to the signal amplitude and the designed logic.

Electronics principal block diagram of the instrument.
3.2 HED
The HED is used to measure the flux of high-energy electrons from 0.4 to 5.8 MeV in a fixed direction. The detector includes three parts: a telescope system (consisting of a collimator and multiple semiconductor sensors, in front of which is a 15 µm thick aluminum light-blocking layer), the front-end electronic circuits, and structural components. A photograph and a sectional view of the HED are shown in Figure 3.
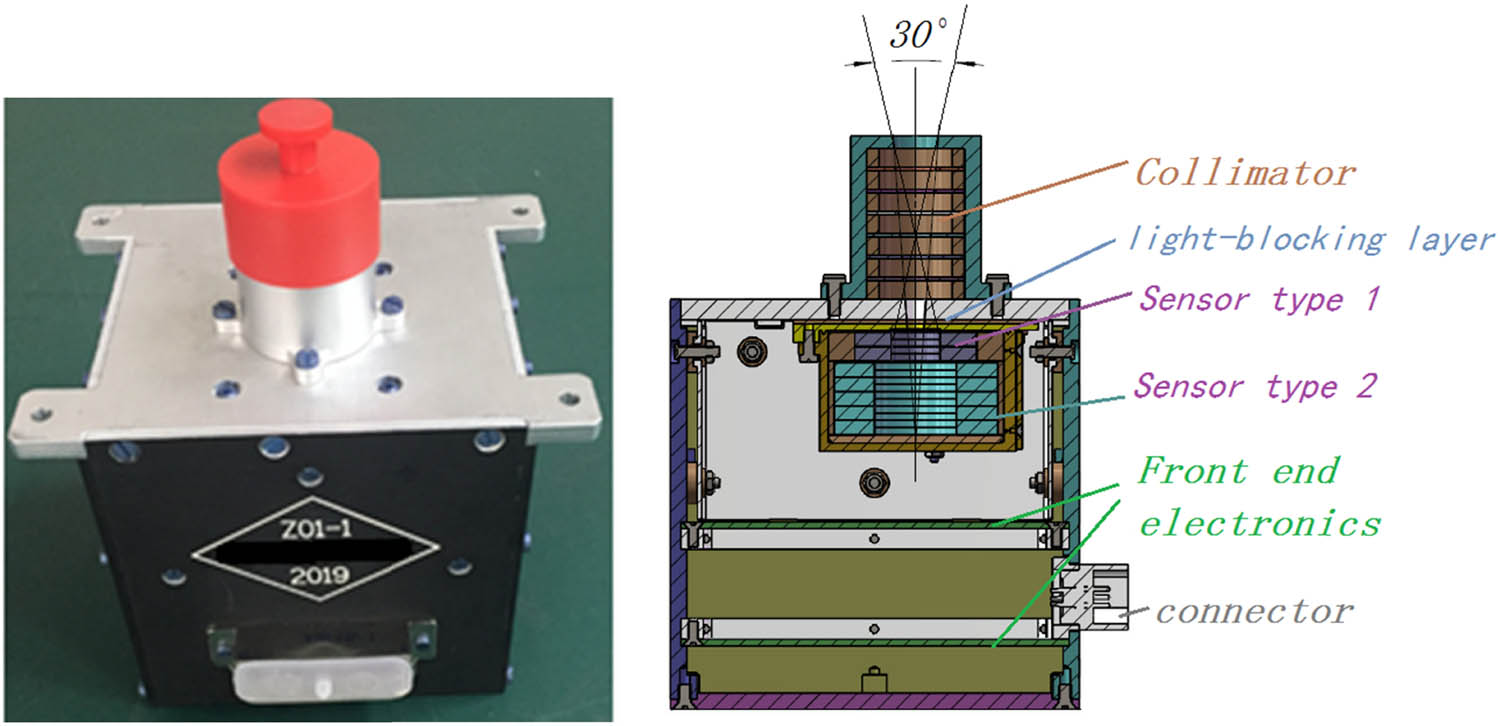
Photo (left) and cross-section (right) of the HED.
When an incident electron comes into the sensor, its energy is deposited and a corresponding number of electron–hole pairs are generated by ionization. These electron–hole pairs converge to the output terminal and generate charge pulse under a high-potential electric field. The charge pulse height is proportional to the energy deposited. The energy of incident electrons can be judged by analyzing the pulse amplitude of each semiconductor sensor and the energy channel division is determined by logical judgment. In addition to preventing sunlight from entering the sensor, the light-blocking layer is also used to remove medium- and low-energy protons, and the removal of high-energy protons and heavy ions is realized by the logical working mode of the sensors. The working principle of the HED is shown in Figure 4.

Working principal block diagram of the HED.
A total of seven ion-implanted semiconductor sensors are used in the HED. The characteristic parameters of sensors are shown in Table 3. The signals of the seven sensors are combined into four groups in the circuit, which are D1, D2 + D3, D4 + D5, and D6 + D7. The logical working mode is shown in Figure 5, where “anticoincidence” means that the sensor signal to be analyzed will be discarded when the amplitude of the anticoincidence sensor signal meets the preset conditions.
The characteristic parameters of sensors in HED
| Sensors | Thickness (mm) | Diameter (round) (mm) | Type |
|---|---|---|---|
| D1–D2 | 1 | 12 | Ion-implanted |
| D3–D7 | 1 | 20 |

Logical working mode of the sensors in HED.
The collimator is a cylindrical structure, which is used to define the field of view. Some annular aluminum sheets are installed in the collimator at intervals to reduce the scattering effect of electrons on the incident path.
3.3 MED
The working principle of the MED is similar to that of the HED. The energy of incident electrons is determined by analyzing the amplitude of the signal obtained from the semiconductor sensors. The sensor system includes three groups of independent sensors, a shared collimator, and a backscatter device (Hou et al. 2020). Two sensors (D1 and D2) are used in each group. Each group of sensors determines its detection field of view (20° × 20°) through the square opening of the collimator. The three groups of fields of view are merged into a 20° × 60° total detection field of view. A photo and cross-section of the MED are shown in Figure 6.

Photo (left) and cross-section (right) of the MED.
In each group of sensors, D1 and D2 have separate amplifying circuits. The D1 is used as a pulse amplitude analyzer for dividing energy channels. The D2 is used as an anticoincidence detector to eliminate the interference of high energy protons, high energy ions, and high energy electrons. The working mode of the sensors is

Logical working mode of the sensors in MED.
The characteristic parameters of the sensors are shown in Table 4.
Characteristic parameters of the sensors in MED
| Sensor | Thickness (μm) | Sensitive area (square) | Dead layer |
|---|---|---|---|
| D1 | 300 | 8 mm × 8 mm | 150 nm (100 nm aluminum electrode + 50 nm ion-implanted layer) |
| D2 | 300 | 8 mm × 8 mm |
Since the silicon sensor is sensitive to visible light, a light-blocking layer must be used in front of the silicon sensor. The light-blocking layer can absorb part of the electron energy, so the light-blocking layer should be as thin as possible to reduce the energy loss on the incident path. However, the light-blocking layer that is too thin is prone to damage under vibration and vacuum environments. Through simulation and experimental verification, a maylar film with a thickness of 3 μm was used as a light-blocking layer. For a 30 keV incident electron, the energy loss in it is about 5 keV. The photon pollution of sunlight on the sensors can be completely eliminated by the light-blocking layer, while ensuring its mechanical properties.
Another measure is using the ultra-low noise technology to control the noise at a very low level. According to the requirement of the signal-to-noise ratio of 3:1, the electronics noise of MED should be controlled to at least below 10 keV, and the noise of the HED should be controlled to below 50 keV. The solutions include the secondary filtering of the power supply, the selection of low noise devices, and a good electromagnetic compatibility design (Poman and wolfgang 2002, Mardiguian 2008). Tests on the ground show that the electronics noise can be controlled below 6 keV after using the above solutions, which can meet a lower measurement limit requirement of 20 keV.
Regarding the contamination problem of medium-energy protons to medium-energy electrons, the deflection magnet is not used here to separate the protons and electrons, because the required magnetic field is strong and the magnet will be very large. Most of the medium-energy protons can be excluded by the light-blocking layer mentioned above. High energy particles and part of the medium energy particles entering the sensor are further removed by the logical working mode of the sensors, so that the influence of various particles outside the detection energy range can be ignored.
In addition, the structure and internal circuits of the detectors have been optimized in order to save satellite resources. The sensor system, the front-end electronics including amplifier circuit, peak-holding circuit, trigger circuit, high voltage circuit, and other analog circuits are highly integrated. Signal transmission between circuit boards is realized by signal cables and no motherboard is used. These measures have greatly reduced the size and power consumption so that the detectors can be flexibly installed on the satellite.
4 Detector calibration
4.1 Calibration principle
The main calibration item of MED and HED is energy spectra, including energy spectra range, linearity, energy resolution, and so on. In addition, the calibration of detectors also includes the test of sensor thickness, size, and field of view. The energy spectra calibration was carried out on the 200 keV and 2 MeV accelerators of the “Space Payload Test and Calibration Platform” in Huairou District, Beijing.
The purpose of energy spectra range calibration is to determine the threshold of energy channel division. The probability of particles incident with energy at the boundary of two adjacent energy channels being recorded by these two channels is the same. The energy channels calibration is completed by an analog signal source and accelerator. Part of the energy channels (depending on the conditions of the accelerator) can be calibrated by the accelerator, and the rest need to be extrapolated based on the existing calibration results or completed by the analog signal source. The accelerator calibration process is shown in Figure 8.

Process of accelerator calibration.
First, select the incident particle beam energy on the boundary of two adjacent energy channels, then adjust the threshold voltage through software injection instructions. The count ratio of the two adjacent channels will change accordingly, and finally a series of count ratios will be obtained. Gaussian function fitting is used to find the positions where the counts of the two adjacent energy channels are equal, that is, to obtain the true threshold corresponding to the energy deposited by the incident particle in the sensors (Mauk et al. 2017). By selecting several beam energy points, the relationship between energy deposition and the threshold voltage can be obtained by linear fitting equation ΔE = f(V). For energy points that cannot be covered by the accelerator, Monte Carlo simulation is used to calculate the energy deposition ΔE of incident electrons (McNutt et al. 2008) and the threshold voltage is calculated according to the linear fitting results.
The relationship between energy loss and pulse amplitude is shown in Eq. (1), which is strictly proportional in theory. This principle is the basis of linearity calibration. In Eq. (1), U is the output voltage value of pre-amplifier, and C is the integrating capacitor for charge generated. During linearity calibration, a multi-channel analysis mode is set in the software, and the output signal of each sensor is divided into 256 channels. The output data of multi-channel analysis of each energy point is Gaussian fitted to find its peak position, and then the energy linearity in this direction is obtained through linear fitting of these peak positions.
Energy resolution refers to the energy broadening measured by the detector for particles with fixed energy. The energy deposition spectrum of the particles in the sensor is approximately Gaussian distribution (McEntire et al. 1985, Williams et al. 1994). The energy resolution is equal to the ratio of the full width at half maximum (FWHM) to the center value, as shown in Eq. (2).
where λ
0 is the center energy value of Gaussian fitting curve,

The definition of energy resolution.
4.2 Calibration results
Using the abovementioned calibration method, the energy spectra specified in Table 1 are tested. Since the three directions of MED are highly consistent in energy spectra range, linearity, and energy resolution, the ground testing results of MED in Z direction are given here to verify its performance.
4.2.1 Linearity and energy resolution testing
The Gaussian fitting results of the measured data in multi-channel analysis mode in the Z-direction of the MED are shown in Figure 10, where the ordinate of the black points are the multi-channel counting data corresponding to the fixed incident electron energy, the abscissa is the channel number, and the blue curve is the fitting result.

Gaussian fitting of multi-channel counting results in Z-direction of MED.
The corresponding relationship between the energy deposited in sensor and multi-channel peak position of Gaussian fitting is shown in Table 5.
Energy deposited and multi-channel position of Gaussian peak in Z-direction of MED
| Incident energy (keV) | Energy deposited (keV) | Energy channels (total 256) |
|---|---|---|
| 30 | 26.3 | 6.37 |
| 46 | 43.62 | 7.49 |
| 60 | 58.26 | 11.71 |
| 72 | 70.5 | 15.62 |
| 90 | 88.68 | 22.11 |
| 100 | 98.88 | 25.43 |
| 140 | 139 | 39.35 |
| 230 | 230 | 70.66 |
| 410 | 410 | 132.6 |
| 600 | 600 | 199.1 |
| 770 | 770 | 235 |
According to the relationship between the Gaussian peak position and the deposition energy in Table 5, the linear fitting result is shown in Figure 11.
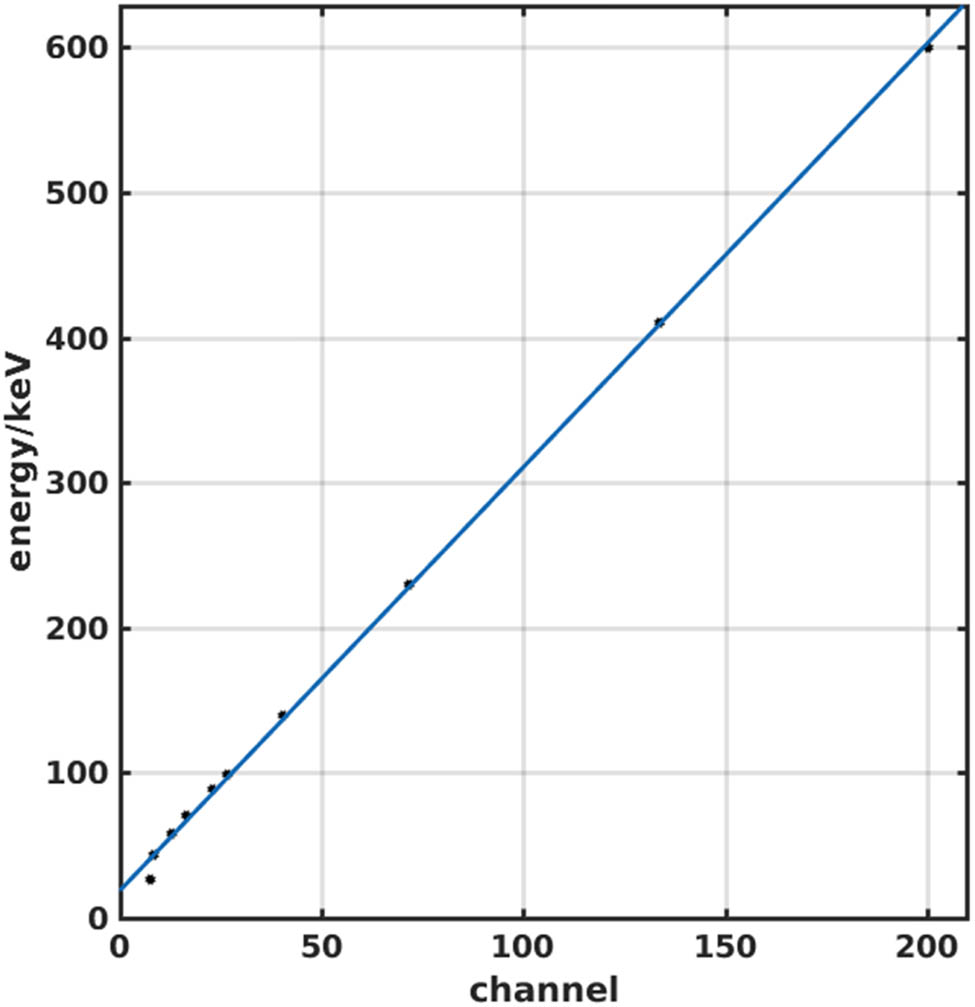
Linear fitting of Gaussian peak positions in Z-direction of MED.
The linear formula obtained by the fitting is y = 2.92x + 21.94, where y is the energy loss and x is the channel position in the multi-channels. According to the fitting formula, the linearity in this direction is calculated to be 99.44%, and the energy resolution is 9.2% (@230 keV), obtained by the Gaussian fitting curve in Figure 10.
The calibration and testing process of HED are similar to that of MED, so not introduced here in detail. Table 6 shows the linearity and energy resolution testing results of the detectors.
Summary of linearity and energy resolution testing results of both detectors
| Detector | Direction | Linearity (%) | Energy resolution |
|---|---|---|---|
| MED | X | 99.44 | 9.8% (@230 keV) |
| Y | 98.85 | 9.7% (@230 keV) | |
| Z | 99.44 | 9.2% (@230 keV) | |
| HED | Unidirectional | 98.47 | 15% (@600 keV) |
4.2.2 Energy channel division testing
The actual demarcation points of energy channels are determined by the count change between two adjacent energy channels. By normalizing the counts of the two energy channels to obtain the proportion of counts in each energy channel, the central intersection point can be found according to the changing trend of the counting ratio, as shown in Figure 12.
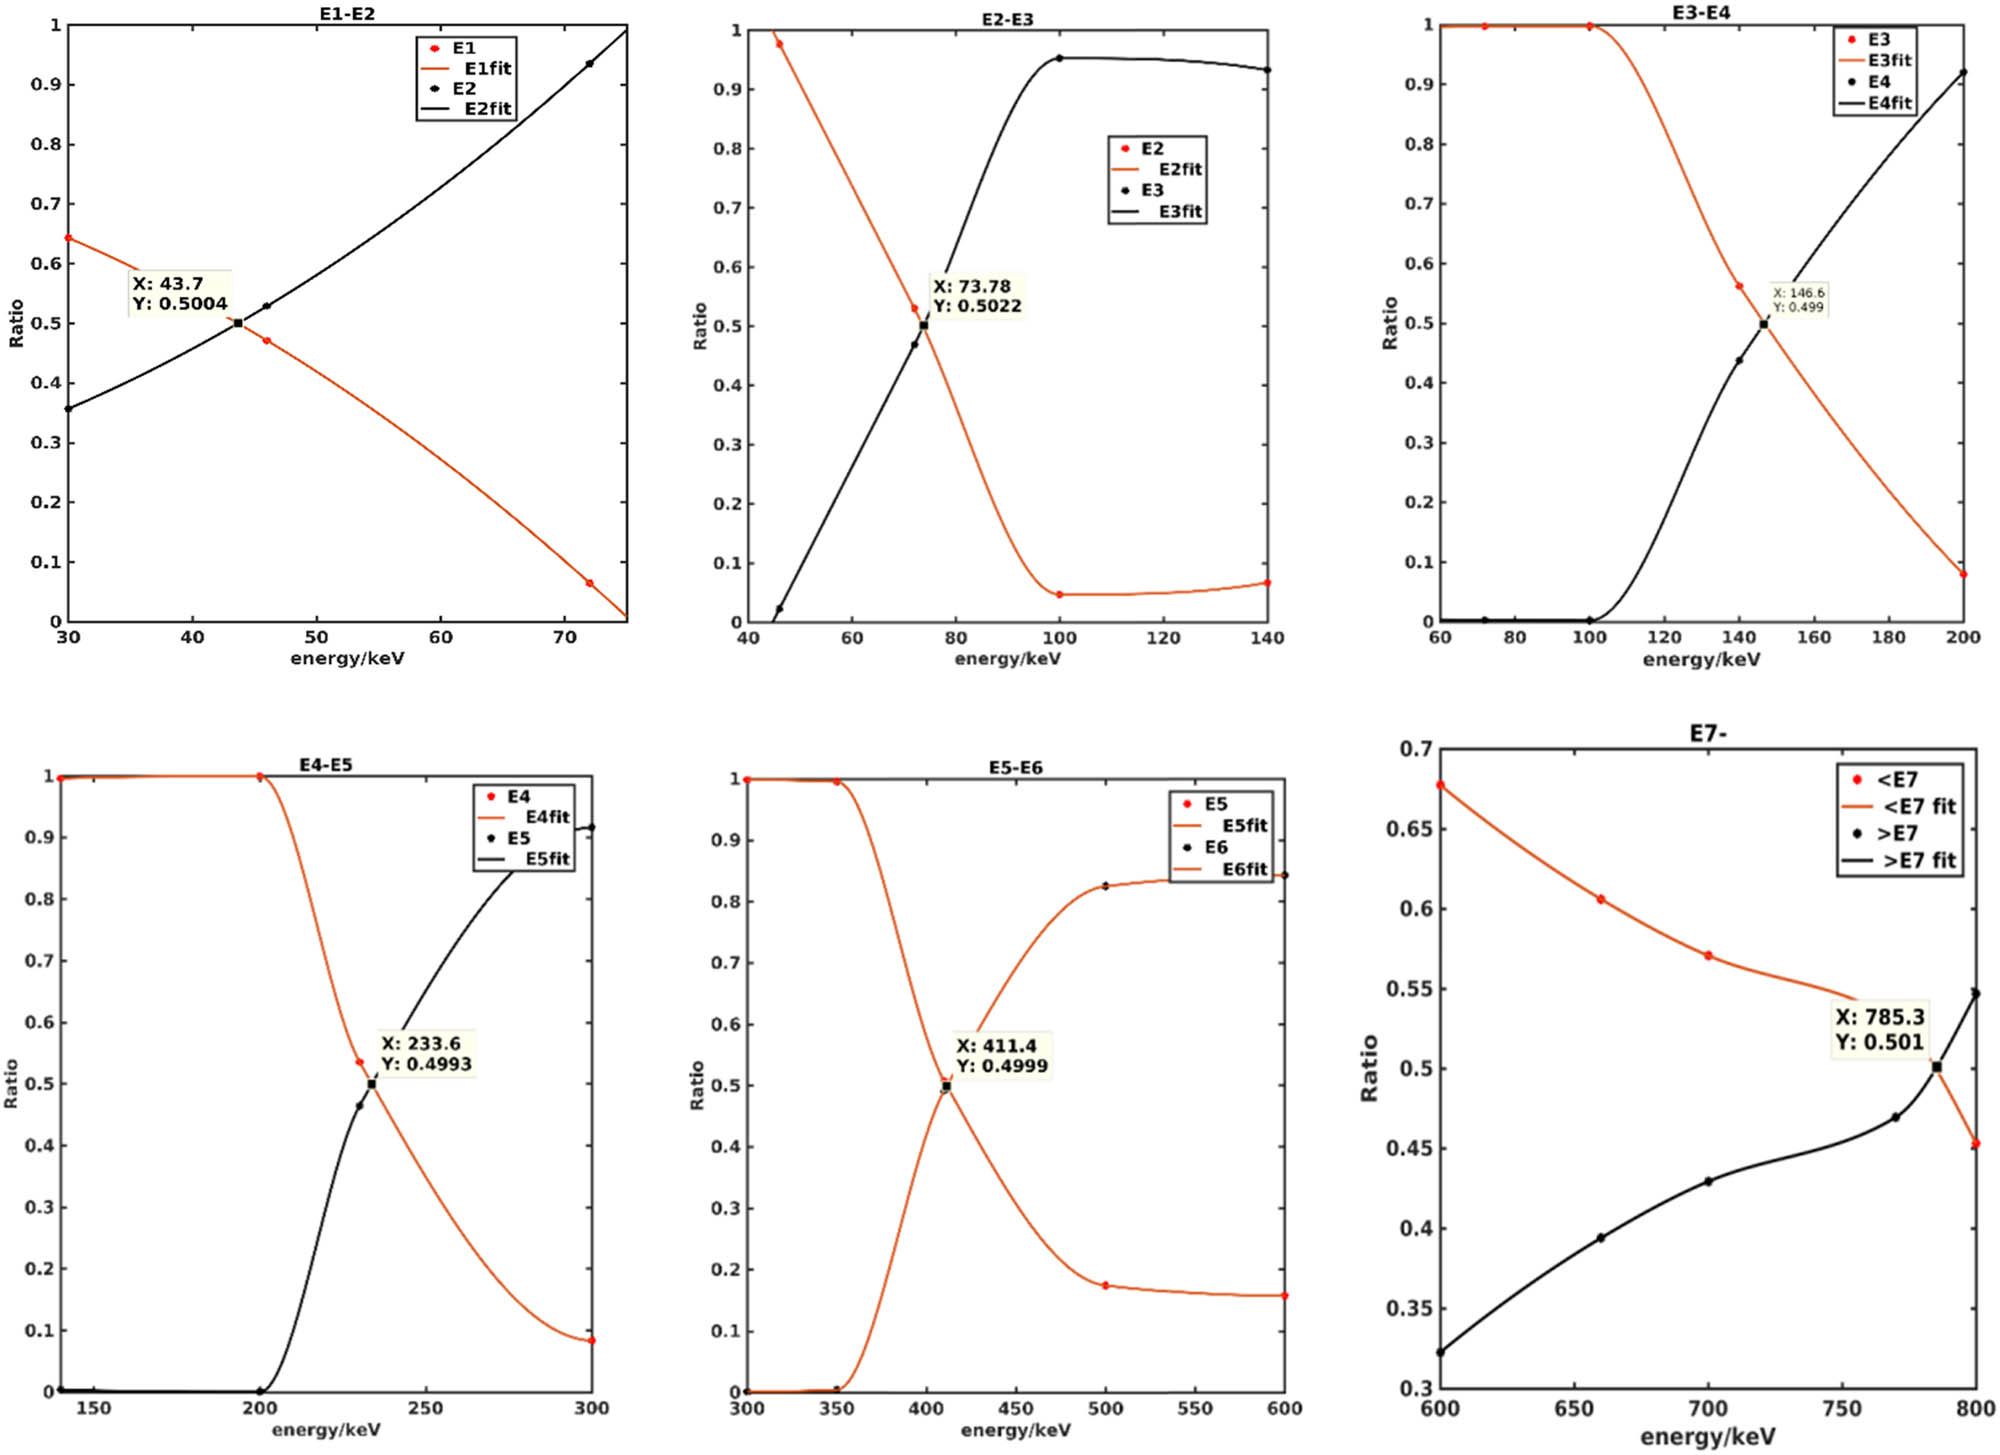
Testing results of energy channel boundary.
The actual obtained boundary values are shown in Table 7. The error range of energy channels division can be calculated by Eq. (3).
Energy demarcation points and error range in Z-direction of MED
| Energy channel | Designed boundary | Actual boundary | Error range (%) |
|---|---|---|---|
| E1 (lower) | 30 | 28.3 | 6.0 |
| E2/E1 | 46 | 43.7 | 5.0 |
| E3/E2 | 72 | 73.78 | 2.5 |
| E4/E3 | 140 | 146.6 | 4.7 |
| E5/E4 | 230 | 233.6 | 1.6 |
| E6/E5 | 410 | 411.4 | 0.3 |
| E7/E6 | 600 | 605.6 | 1.0 |
| E7 (upper) | 770 | 785 | 1.9 |
where Ca is the actual energy boundary position, Cd is the designed energy boundary position, and
Based on the same testing principle, the obtained energy channel boundaries of HED are shown in Table 8.
Energy demarcation points and error range of HED
| Energy channel | Designed boundary | Actual boundary | Error range (%) |
|---|---|---|---|
| E1 (lower) | 400 | 396 | 1.0 |
| E2/E1 | 500 | 493 | 1.4 |
| E3/E2 | 600 | 607.7 | 1.3 |
| E4/E3 | 770 | 813 | 5.6 |
| E5/E4 | 1,300 | 1,364 | 4.9 |
| E6/E5 | 1,700 | 1,735 | 2 |
| E7/E6 | 2,000 | 1,970 | 1.5 |
| E8/E7 | 2,200 | 2,247 | 2.14 |
| E9/E8 | 3,000 | 2,820 | 6 |
| E10/E9 | 4,100 | 3,792 | 7.5 |
| E10 (upper) | 5,800 | 5,280 | 8.97 |
4.2.3 Field of view testing
Scanning the detector’s three probes in turn with the accelerator electron beam of 100 keV, the measurement result of the MED’s field of view is shown in Figure 13. The total field of view is 61.5° when the counting rate of probe on either side reaches one third of the maximum value, and the field of view of each group of sensors are 16°, 15.5°, and 15.5°, with the consistency of 94.2%. Compared with MED, the sensor structure of HED is relatively simple. Guaranteed by the manufacturing accuracy of the collimator, the field of view of HED is 30.66° according to the dimension measurement and calculation.
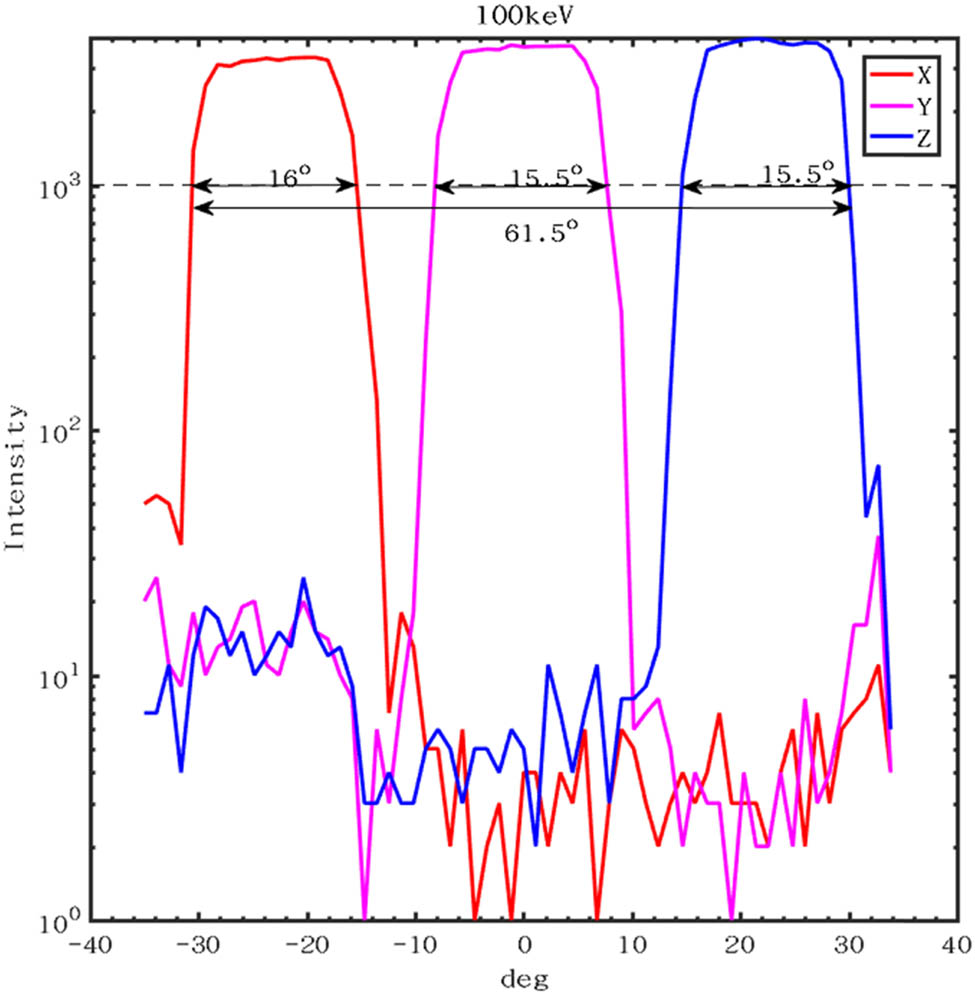
Field of view of MED.
5 Conclusion
This study focuses on the design of the HED and MED onboard a BeiDou MEO satellite in the aspect of sensors and electronic circuits, especially the critical technology of the detectors. The detectors meet the established detection mission requirements. At the same time, the miniaturization design method of the instrument is worth using for reference. Finally, the calibration method and ground testing results are introduced here to provide a basis for the on-orbit data processing of the detectors.
Acknowledgements
We thank the following facilities and personnel for supporting the calibration of MED and HED: NSSC-SEF (National Space Science Center-Space Electron Facility), China; Irradiation facility dedicated for heavy-ion induced Single-Event Effect, CIAE (China Institute of Atomic Energy), China; HIRFL (Heavy Ion Research Facility in Lanzhou, China). We thank Guogang/CIAE and Liujie/HIRFL for providing the of calibration service.
-
Funding information: The authors state no funding involved.
-
Author contributions: All authors have accepted responsibility for the entire content of this manuscript and approved its submission.
-
Conflict of interest: The authors state no conflict of interest.
References
Beech M, Brown P, Jones J. 26 October, 1994. The potential danger to space platforms from meteor storm activity. Q J Royal Astron Soc. 36:127–52.Suche in Google Scholar
Bogorad A, Bowman C, Dennis A, Beck J, Lang D, Herschitz R, et al. 1995. Integrated environmental monitoring system for spacecraft. IEEE Transactions on Nuclear Science. 42(6):2051–7.10.1109/23.489252Suche in Google Scholar
Gombosi TI. September 2, 1998. Physics of the space environment. Cambridge: Cambridge University Press.10.1017/CBO9780511529474Suche in Google Scholar
Gubby Robin EJ. 2002. Space environment effects and satellite design. J Atmos Sol Terr Phys. 64:1723–1733. 10.1016/S1364-6826(02)00122-0.Suche in Google Scholar
Hou DH, Zhang SY, Zhang XX, Zong WG. 2020. Design optimization of novel collimator for detector of space high energy electron: A simulation study. J Vac Sci Technol. 2020;40(10):965–70. 10.13922/j.cnki.cjovst.2020.10.13.Suche in Google Scholar
Iles RH, Fazakerley AN, Johnstone AD, Meredith NP, Bühler P. 2002. The relativistic electron response in the outer radiation belt during magnetic storms. Ann Geophys. 20(7):957–965.10.5194/angeo-20-957-2002Suche in Google Scholar
Lanzerotti LJ, LaFleur K, Maclennan CG, Maurer DW. 1998. Geosynchronous spacecraft charging in January 1997. Geophys Res Lett. 25(15):2967–2970.10.1029/98GL00987Suche in Google Scholar
Li X, Baker DN, Kanekal SG, Looper M, Temerin M. 2001. Long term measurements of radiation belts by SAMPEX and their variations. Geophys Res Lett. 28(20):3827–3830.10.1029/2001GL013586Suche in Google Scholar
Li X, Baker DN, Temerin M, Cayton TE, Reeves EG, Christensen RA, et al. 1997. Multisatellite observations of the outer zone electron variation during the November 3–4, 1993, magnetic storm. J Geophys Res. 102(A7):14123–14140.10.1029/97JA01101Suche in Google Scholar
Li X, Temerin MA. 2001. The electron radiation belts. Space Sci Rev. 95:569–580.10.1023/A:1005221108016Suche in Google Scholar
Mardiguian M. 2008. Controlling radiated emissions by design. Chen AX, translated. Beijing: Science Press. p. 4–6. (in Chinese)Suche in Google Scholar
Mauk BH, Haggerty DK, Jaskulek SE, Schlemm CE, Brown LE, Cooper SA, et al. 2017. The Jupiter energetic particle detector instrument (JEDI) investigation for the Juno mission. Space Sci Rev. 213:289–346. 10.1007/s11214-013-0025-3.Suche in Google Scholar
McEntire RW, Keath EP, Fort DE, Lui ATY, Krimigis SM. 1985. The medium energy particle analyzer on the AMPTEE CCE spacecraft, geosciences and remote sensing. IEEE Trans Geosci Remote Sens. GE-23(3):230. 10.1109/TGRS.1985.289518.Suche in Google Scholar
McNutt RL, Livi SA, Gurnee RS, Hill ME, Cooper KA, Andrews GB, et al. 2008. The Pluto energic particle spectrometer on the New Horizons mission. Space Sci Rev. 140(1–4):P315. 10.1007/s11214-0089436-y.Suche in Google Scholar
Poman PMS, wolfgang JRH. 2002. A TLM-SPICE interconnection framework for coupled field and circuit analysis in the time domain. IEEE Transactions on Microwave Theory and Techniques. 50(12):2728–2733.10.1109/TMTT.2002.805199Suche in Google Scholar
Williams DJ, McEntire RW, Schlemm II C, Lui ATY, Gloeckler G, Christon SP, et al. 1994. Geotail energetic particles and ion composition instrument. J Geomagn Geoelectr. 46(1):39–57. 10.5636/jgg.46.39.Suche in Google Scholar
Yang XC, Zhu GW, Fu Y, Sun YQ, Liang JB, Jing T, et al. 2015. Analysis of high energy electron environment properties on the middle earth orbit. Chinese J Space Sci. 35(5):581–587. 10.11728/cjss2015.05.581.Suche in Google Scholar
© 2023 the author(s), published by De Gruyter
This work is licensed under the Creative Commons Attribution 4.0 International License.
Artikel in diesem Heft
- Research Articles
- Deep learning applications for stellar parameter determination: II-application to the observed spectra of AFGK stars
- Braking and attitude control of lunar lander in active descent stage
- Ka/C dual frequency ranging system for ocean altimetry satellite and analysis of ionospheric error
- Necessary condition for temporary asteroid capture
- A holistic study of the systems V0487 Lac, V0566 Hya, and V0666 Lac
- Review Article
- Light curve analysis of main belt asteroids 4747, 5255, 11411, 15433, 17866
- Special Issue: New Technology for Space Environment Detection Based on Beidou Constellation
- Guest Editorial: Special Issue of New Technology for Space Environment Detection Based on Beidou Constellation
- Medium and high energy electron detectors onboard BeiDou navigation satellite in MEO
- An outlier detection method with CNN for BeiDou MEO moderate-energy electron data
- A low-energy ion spectrometer with large field of view and wide energy range onboard a Chinese GEO satellite
- High-energy proton detector based on semiconductor telescope
- Radiation dosimeter and charge detector onboard BeiDou navigation satellites in MEO
- Design and validation of a space plasma environment detector for BeiDou navigation satellite
- Surface charging and dose monitor on geosynchronous orbit satellite
- Monitor of the single event upsets and linear energy transfer of space radiation on the Beidou navigation satellites
- Radiation environment and effect detection based on global navigation constellation
- An ion beam system for calibration of space low-energy ion detectors
- Special Issue: Modern Stellar Astronomy 2022
- Crossmatching of high-proper motion L, T, and Y brown dwarfs with large photometric surveys
- Magnetic fields with random initial conditions in discs with Kepler rotation curve
- Far-IR emission from bright high-redshift quasars
- A new version of the binary star database BDB: Challenges and directions
- Dust and gas in star-forming complexes in NGC 3351, NGC 5055, and NGC 5457
- Investigation of the halo effect in the evolution of a nonstationary disk of spiral galaxies
- Special Issue: Astromineralogy and cosmochemistry of the Kaba meteorite
- Clay minerals and other hydrous alteration products in the Kaba meteorite: Review of the literature and new XRD investigations
- Special Issue: The Hubble Tension: Current Research and New Perspectives
- Late-time dark energy and Hubble tension
- The history of the Cosmos: Implications for the Hubble tension