Generating Behavior in the University-Industry Collaboration Network: Based on the Configuration of Motifs
-
Wen Zhou
 ,
Wei Chen
,
Wei Chen

Abstract
University-industry collaboration networks consist of heterogeneous subjects; in fact, the interactions among these subjects lead to the emergence of the complex characteristics of university-industry collaboration networks and even to the emergence of the networks themselves. Thus, understanding the behavior that generates university-industry collaboration networks is essential to their construction and optimization. To more fully comprehend this generating behavior, we considered a university-industry collaboration network in the ocean energy industry in China as a case study. Employing the motif analysis method, we analyze the network’s generating behavior from four perspectives: motif characteristics, motif classification, motif combination and motif clustering. Furthermore, we explore agents’ modes of adaptive collaboration — and the causes of such collaborations — and summarize the characteristics and modes of networks’ generating behavior. The results indicate that universities and industries tend to form highly stable and close cooperative relationships. The constraints of the network’s generating behavior — which influences the subjects’ interactions through relational and structural embeddedness — include asymmetric information, resource and cost constraints, risk aversion and geographical constraints. Our research presents the benefits of using the motif analysis method to study the network’s generating behavior and its implications in constructing and optimizing a university-industry collaboration network.
1 Introduction
Collaboration innovation is an important technique that helps to realize the value of industrial innovation and that promotes industrial development[1]. With the support and constraints of the government, a university-industry collaboration network emerges from an adaptive collaboration of enterprises, universities and institutes. As the support and underlying structure of the collaboration of network agents, the network not only reflects the characteristics of these network agents but also influences the performance of collaboration innovation by determining the selection of network partners and the spread of information and resources. To improve collaboration innovation, it is important to build and optimize the university-industry collaboration network[2]. Because they are heterogeneous[3], the collaboration goals and strategic behavior of network agents are not completely consistent. Moreover, as network scale increases, the adaptability of network agents leads to more complex collaborations characterized by dynamic and nonlinear features that lead to the emergence and evolution of the university-industry collaboration network. Thus, to build and optimize the network, it is necessary to fully understand the characteristics and modes of the network’s generating behavior. In addition, there is a time-varying characteristic to the network; however, we can rarely obtain this type of data in actuality because of its time-variation features and complexity. Therefore, as part of the practical reality of building and optimizing such a network, it is important to infer the network’s generating behavior based on a static structure.
However, considerable effort must also be undertaken that do not refer to the network’s generating behavior but that focus instead on the mechanics of network formation[4s,5], influencing factors[6–8], network characteristics[9] and network evolution[10–12]. The study of network characteristics has primarily referred to the characteristics of the global network structure and has not considered heterogeneity among the network agents or the network generating process. Moreover, analyses of the evolution of the university-industry collaboration network have focused on changes in the global network structure. In addition, research performed on the mechanics of the network formation and influencing factors has employed the qualitative analysis method, which neither reveals the complexity of the network’s generating behavior nor analyzes the generating process of the specific network.
In complex theory, the method of motif analysis based on statistical sampling is extremely important because it can investigate the nodes’ dynamic interaction in the network. A motif is defined as a set of nodes in which there are certain link relations — either physical or functional — that can implement special and relatively independent functions together by using them in basic combinations[13,14]. Essentially, a motif is the basic building block that can reflect special link patterns of nodes in the network from the medium perspective. Recently, some researchers have used motif theory to analyze the structure of collaboration networks. Miao et al.[15] and Shi et al.[16] analyzed a scientific collaboration network using motif theory. Salehi et al.[17] compared and analyzed the motif characteristics for a different type of real collaboration network. Wu et al.[18] used motif theory to characterize a collaborative editing network for Wikipedia. These studies popularized the methodology of motif analysis, which can characterize the interaction among nodes in a network from the medium perspective of the complex network; however, these studies focused on collaboration networks that did not involve university-industry collaboration networks. Based on the heterogeneity of the network agents, whether these conclusions regarding the network structure and network generating behavior can be consistent with or generalized to the university-industry collaboration network requires more verification. Moreover, because these studies did not reference the heterogeneity of the network agents and only emphasized the comparison and classification of motifs for different collaboration networks, they did not fully analyze the generating behavior of a single network. In particular, when there is significant heterogeneity among the network agents, it is necessary to conduct a full analysis of the characteristics of the applicable networks — including the entire network and all its subnetworks, which also consist of heterogeneous network agents — to further explore the characteristics and modes of the network’s generating behavior.
Designed to address the limitations of the studies mentioned above, this study used the university-industry collaboration network in China’s ocean energy industry as its case study and partitioned the network into six subnetworks based on the types of heterogeneity of the network agents. Then, the network’s generating behavior was analyzed from the perspective of interaction among the multi agents. This study employed statistical tests and sampling surveys to compare the motif characteristics of the entire network and its subnetworks, explored the modes of the agents’ adaptive collaboration and their causes, and summarized the characteristics and modes of the network’s generating behavior. Therefore, this study was able to overcome the difficulty in obtaining the time-varying data of the network and was able to deepen the understanding of the network’s generating behavior in a university-industry collaboration network, which is characterized by heterogeneity. Moreover, this study can promote the theory of building and optimizing the university-industry collaboration network.
This article is organized as follows. We illustrate the network data used in this study and introduce the research method in Section 2. Section 3 is the core of this study, in which we analyze a university-industry collaboration network’s generating behavior in terms of motif characteristics, motif class, motif combination and motif clustering. We conclude this study in Section 4.
2 Network Data and Methodology
2.1 Network Data
We used a university-industry collaboration network involving the ocean energy industry in China as our case study to analyze its generating behavior. The ocean energy industry is a technology-intensive and strategic emerging industry in China, in which marine energy technologies are the core technologies and are used to promote the development of this industry. Moreover, these technologies are spread throughout the university-industry collaboration network. The growing university-industry collaboration network of the ocean energy industry in China is typical in its organization form because it embodies the general features of a university-industry collaboration network; furthermore, university-industry collaboration in the high-tech industry is more important than in other industries and is the primary research objective in the field of university-industry collaboration. Therefore, research on the generating behavior of the university-industry collaboration network in the ocean energy industry has value as a practical application. Revealing the features and patterns of the network’s generating behavior can enhance our understanding of the structural characteristics of the university-industry collaboration network and provide practical directions for constructing and optimizing the network.
Because the Chinese ocean energy industry university-industry collaboration dates primarily from 2010, we combined the collaboration data from the leading projects nationwide that were involved with ocean energy technologies collaboration and their corresponding units from 2010 to 2012. Thus, we constructed a university-industry collaboration that included 39 universities, 49 research institutions and 48 concerned enterprises. The university-industry collaboration network of the ocean energy industry and its subnetworks are presented in Figure 1. Because of the network subjects’ nonconformity of the collaboration goals and strategic behavior based on their heterogeneity, we subdivided the entire network into six subnetworks based on their attributes and the known patterns of interaction among different subjects and their causes by comparing the motif features in the entire network with other subnetworks. Furthermore, we summarized the primary patterns of the university-industry collaboration network’s generating behavior by classifying motifs in the networks. The concrete indicators of the network structure are presented in Table 1.

University-industry collaboration network of the ocean energy industry and its subnetworks
Structural indicators of the university-industry collaboration network for the ocean energy industry
| Networks | Structural indicators of the network | |||||
|---|---|---|---|---|---|---|
| V[h] | E[i] | <k>[j] | L[k] | D[l] | C[m] | |
| uni-uni[a] | 39 | 47 | 2.410 | 1.848 | 0.063 | 0.487 |
| ins-ins[b] | 49 | 115 | 4.694 | 2.002 | 0.098 | 0.505 |
| com-com[c] | 48 | 17 | 0.708 | 1.150 | 0.016 | 0.800 |
| uni-ins[d] | 89 | 270 | 6.067 | 2.404 | 0.071 | 0.431 |
| uni-com[e] | 87 | 113 | 2.598 | 2.219 | 0.031 | 0.382 |
| ins-com[f] | 97 | 176 | 3.629 | 2.564 | 0.039 | 0.415 |
| whole net[g] | 136 | 384 | 5.647 | 2.734 | 0.042 | 0.380 |
Note: (1) to (7) represent the university-university sub-network, the institution-institution subnetwork, the company-company sub-network, the university-institution sub-network, the university-company sub-network, the institution-company sub-network and the university-industry collaboration network.
Table 1 shows that, except for the com-com network, other subnetworks have smaller average path lengths, and all subnetworks have a smaller average clustering coefficient and network density, which illustrates that they are in a growing period compared with networks in a mature period that have a larger network density; in other words, the university-industry collaboration of the ocean energy industry in China must be enhanced. It should be noted that the com-com network has a smaller average path length and a larger average clustering coefficient, which signifies that it has a small world feature but its network density is smallest; thus, the collaboration relationships in the com-com network must be strengthened urgently compared with other subnetworks.
2.2 Methodology
Based on the motif analysis method[13,19], we study the university-industry collaboration network from the medium perspective. The motif is a type of subgraph in the network that reflects patterns of underlying basic functions. The motif appears in the real network with greater frequency than a random network with the same number of nodes and edges. Prior studies on the motif primarily range from a three-node motif to an eight-node motif; however, the three-node to five-node motif are the most common motifs in the literature. Motif analysis includes three parts: random network construction, motif search and motif evaluation.
1) Random network construction. The goal of the random network construction is to be a reference for the frequency of occurrence of motif in the real network, which requires the random network to be comparable and always requires the random network to have the same number of nodes and edges, the same sequence of degree and the same distribution of degree as the real network. The common algorithms for constructing the random network include the Matching algorithm, Exchange algorithm and the Go with the Winner algorithm[20]. We use the Exchange algorithm to construct the random network.
2) Motif search. The process of the motif search is to search isomorphic subgraphs that are assigned a certain number of nodes in the real and random networks and can thus confirm the type of motif and its amount. The common algorithms of the motif search include the Recursive search algorithm, ESA sampling algorithm and ESU algorithm[17]. We use the ESA sampling algorithm to search the motif in the network.
3) Motif evaluation. The goal of the motif evaluation is to evaluate the statistical significance of the searched motifs. Because the motif search is based on statistical significance, it must verify the statistical significance of the motif. The common method used for motif evaluation is the Z value significance test[20].
where Nreal is the frequency of occurrence of motif i in the real network, and Nrandi and std(σrandi) are the average frequency of occurrence and standard deviation of motif i in the random network, respectively. The test standard of the Z value significance requires that the probability of the frequency of occurrence of motif i in the random network higher than in the real network is under a certain threshold (we set p = 0.05), and the frequency of occurrence of motif i is an independent subgraph, which has no overlap of nodes or edges in the real network under a certain lower limiting value (we set U = 3). In addition, the number of occurrences of motif i in the real network is required to be significantly higher than those in the random network; thus, we accept the common standard that (Nreal- Nrandi) > 0.1Nrandi.
To reveal the differences and correlations with motifs on different levels and to investigate the structure quality of different networks, a motif combination analysis and motif clustering analysis are needed.
1) Motif combination analysis. The goal of motif combination is to construct a higher level of motifs using a combination of underlying motifs and thus to construct a network with different techniques and various levels of motifs based on the consistency criteria of the rule of motif combination, which consists of the distribution of the normalized value of the strength of motif combination Ri. For example, the 3-4 motif combination denotes constructing a four-node motif with a three-node motif, which is illustrated in Figure 2.
![Figure 2 ‘3-4’ motif combination[12]](/document/doi/10.1515/JSSI-2015-0434/asset/graphic/j_JSSI-2015-0434_fig_002.jpg)
‘3-4’ motif combination[12]
Following references [15, 20], we define the motif combination Ri as the ratio of the number of three-node motifs contained in motif i with n nodes to all three-node motifs, which reflects the technique and the degree of three-node motifs combined with the motif i with n nodes. The formulas can be expressed as follows:
where formulas (2), (3) and (4) illustrate how to calculate the motif combination Ri when the motif combination only contains a 3-1 motif, 3-2 motif, and 3-1 motif and 3-2 motif, respectively; Nreali is the frequency of occurrence of motif i with n nodes; a is the number of 3-1 motifs contained in motif i; b is the number of 3-2 motifs contained in motif i; and Nreal(3–1) and Nreal(3-2) are the number of 3-1 motifs and 3-2 motifs in the real network, respectively. Normalizing the motif combination Ri can be used to compare networks of different scales and thus estimate the consistency of the rule of motif combination[20]. The formula of normalization can be expressed as follows:
2) Motif clustering analysis. The criterion of motif clustering is the SRP (subgraph ratio profiles) value given by the normalized value of the significance of the Z value. The SRP was proposed by Milo[19] and is used to classify motif family with different networks normalizing the similarity of the subgraph ratio profiles. Here, we use the SRP to conduct the motif clustering analysis.
3 Motif Analyses
3.1 Motif Characteristics
We use FANMOD[21], which is a tool for fast network motif detection made by Wernicke to search the three-node motifs and four-node motifs in the university-industry collaboration network of the ocean energy industry in China and its subnetworks. Table 2 presents the detailed statistical results.
3 nodes motifs and 4 nodes motifs of university-industry collaboration network of sea energy industry
| Subgraph | Subgraph | Subgraph (Motif r = 1000, p < 0.05, Z > 0) | Subgraph | |||||
|---|---|---|---|---|---|---|---|---|
| number | structure | Networks | Frequency [Original] | Mean-Freq [Random] | Standard-Dev [Random] | Z-Score | p-Value | types |
| 3-1 | com-com | 57.14% | 0.36% | 0.017 | 33.877 | 0 | Motif | |
| ins-com | 19.11% | 0.02% | 0.002 | 122.73 | 0 | Motif | ||
| ins-ins | 25.40% | 1.00% | 0.005 | 50.645 | 0 | Motif | ||
| uni-com | 17.06% | 0.11% | 0.002 | 108.95 | 0 | Motif | ||
| uni-ins | 20.18% | 0.25% | 0.004 | 51.893 | 0 | Motif | ||
| uni-uni | 24.03% | 0.40% | 0.004 | 64.176 | 0 | Motif | ||
| whole net | 16.95% | 0.10% | 0.001 | 139.17 | 0 | Motif | ||
| com-com | 42.86% | 99.64% | 0.017 | -33.877 | 1 | Anti-motif | ||
| ins-com | 80.89% | 99.98% | 0.002 | -122.73 | 1 | Anti-motif | ||
| 3-2 |  | ins-ins | 74.60% | 99% | 0.005 | -50.645 | 1 | Anti-motif |
| uni-com | 82.94% | 99.89% | 0.002 | -108.95 | 1 | Anti-motif | ||
| uni-ins | 79.82% | 99.76% | 0.004 | -51.893 | 1 | Anti-motif | ||
| uni-uni | 75.97% | 99.60% | 0.004 | -64.176 | 1 | Anti-motif | ||
| whole net | 83.05% | 99.90% | 0.001 | -139.17 | 1 | Anti-motif | ||
| com-com | 75% | 1.21% | 0.059 | 12.436 | 0 | Motif | ||
| ins-com | 30.58% | 0.06% | 0.003 | 100.52 | 0 | Motif | ||
| 4-1 |  | ins-ins | 35.52% | 2.88% | 0.011 | 30.474 | 0 | Motif |
| uni-com | 24.08% | 0.34% | 0.005 | 46.104 | 0 | Motif | ||
| uni-ins | 32.99% | 0.47% | 0.008 | 38.97 | 0 | Motif | ||
| uni-uni | 37.84% | 1.09% | 0.009 | 41.405 | 0 | Motif | ||
| whole net | 29.00% | 0.28% | 0.004 | 75.168 | 0 | Motif | ||
| 4-2 |  | ins-ins | 3.68% | 0.00% | 0 | 270.57 | 0 | Motif |
| uni-ins | 2.30% | 0.00% | 0 | 524.82 | 0 | Motif | ||
| whole net | 1.47% | 1.50E-07 | 0 | 6296.7 | 0 | Motif | ||
| ins-com | 46.98% | 55.38% | 0.005 | -18.497 | 1 | Anti-motif | ||
| ins-ins | 38.28% | 51.50% | 0.007 | -19.639 | 1 | Anti-motif | ||
| 4-3 |  | uni-com uni-ins | 64.21% 45.60% | 61.91% 56.99% | 0.01 0.004 | 2.391 -28.385 | 0.012 1 | Motif Anti-motif |
| uni-uni | 47.94% | 51.74% | 0.008 | -4.98 | 1 | Anti-motif | ||
| whole net | 51.80% | 60.70% | 0.003 | -29.084 | 1 | Anti-motif | ||
| ins-com | 17.43% | 41.59% | 0.004 | -60.375 | 1 | Anti-motif | ||
| ins-ins | 17.43% | 36.14% | 0.005 | -39.297 | 1 | Anti-motif | ||
| 4-4 |  | uni-com uni-ins | 9.94% 13.76% | 36.67% 36.27% | 0.01 0.004 | -27.295 -54.706 | 1 1 | Anti-motif Anti-motif |
| uni-uni | 8.03% | 43.78% | 0.012 | -29.533 | 1 | Anti-motif | ||
| whole net | 14.13% | 36.18% | 0.003 | -80.894 | 1 | Anti-motif | ||
| ins-com | 2.93% | 0.00% | 0 | 185.5 | 0 | Motif | ||
| ins-ins | 4.88% | 0.25% | 0.002 | 19.158 | 0.001 | Motif | ||
| 4-5 |  | uni-com uni-ins | 0.87% 5.31% | 0.01% 0.04% | 0 0.001 | 54.39 48.306 | 0 0 | Motif Motif |
| uni-uni | 3.90% | 0.02% | 0 | 92.404 | 0 | Motif | ||
| whole net | 3.57% | 0.01% | 0 | 152.67 | 0 | Motif | ||
| 4-6 |  | ins-com | 0.12% | 2.98% | 0.003 | -10.871 | 1 | Anti-motif |
| ins-ins uni-ins | 0.21% 0.04% | 9.24% 6.23% | 0.005 0.003 | -19.124 -20.598 | 1 1 | Anti-motif Anti-motif | ||
| whole net | 0.04% | 2.83% | 0.002 | -17.507 | 1 | Anti-motif | ||
The core of the motif and the Anti-motif is the frequency of occurrence of these subgraphs in the real network, which is higher than that in the random network. The use of an Anti-motif is to be used a reference when we use motifs to analyze the characteristics of the network structure. Table 2 indicates that the frequency of occurrence of the 3-1 motif in the three-node motifs and the 4-1 motif, 4-2 motif and 4-5 motif in the four-node motifs in the university-industry collaboration network of the ocean energy industry in China and its subnetworks are higher than those in the random network (Z > 0), which indicates that these motifs are basic motifs for the real university-industry collaboration network. Furthermore, Table 2 indicates that the frequency of occurrence of the 3-2 motif is of subtractive significance compared with the 4-3 motif, 4-4 motif and 4-6 motif (Z < 0), which indicates that this motif is an Anti-motif in the real network. In addition, we note that the frequency of occurrence of the 4-3 motif is of significance in the uni-com network, whereas it is of subtractive significance in the other networks. This result indicates that the 4-3 motif is a basic motif for the uni-com network.
Comparing the 3-1 motif with the 3-2 motif, we observe that the 3-1 motif has one more edge than the 3-2 motif. The three nodes link to one another and have peer-peer relationships in the 3-1 motif, whereas there is a hub node in those three modes of the 3-2 motif, and the link relationships in the 3-1 motif are thus more stable and closer than those in the 3-2 motif. The fact that the 3-1 motif is a basic motif for the real university-industry collaboration network indicates that the formation of the real university-industry collaboration network depends primarily on constructing and maintaining balanced relationships among the universities, enterprises and research institutes.
Comparing the six groups of motifs in the four-node motifs, we observe that the 4-2 motif and 4-5 motif as the basic motif for the real network have more edges than the 4-3 Anti-motif, 4-4 Anti-motif and 4-6 motif, which indicates that the 4-2 motif and the 4-5 motif have closer linkage relationships. Although the 4-1 motif has the same number of edges as the 4-6 motif, it has one more balanced relationship of triads than the 4-6 motif, which causes the structure of the 4-1 motif to be more stable. In addition, Table 2 indicates that seven networks select a 4-1 motif, six networks select a 4-5 motif, three networks select a 4-2 motif and only one network selects a 4-3 motif as their basic motifs. As opposed to the result of reference[13], the university-industry collaboration network of the ocean energy industry in China and its subnetworks primarily selects motifs with more edges and a higher average degree as their basic motifs. These basic motifs reflect that universities, enterprises and research institutes tend to form cooperative relationships of greater stability and closeness.
It is notable that only the uni-com network selects the 4-3 motif as its basic motif, and the 4-3 motif signifies the structure of the hub, which indicates unbalanced relationships. This structure leads to a network with hub nodes in the process of overlapping combinations, and there is generally a phenomenon in which the advantage of resource and information is more prominent in such a network that is affected by the clustering effect. The structure of the university-industry collaboration network of the ocean energy industry in China indicates that the uni-com subnetwork has a hub structure; most universities and enterprises clearly depend on a few universities. This result indicates that universities and enterprises in the uni-com network tend to form higher dependent cooperative relationships, which leads to the emergence of networks with a hub structure. However, this tendency toward dependence is not clear in other subnetworks. Thus, similar to that of enterprises, the control from a few universities is greater, and those enterprises tend to not depend on other subjects in the real network but to depend primarily on those universities.
A motif in a biological network is thought of as a type of underlying structure that performs a certain function based on biological evolution. However, there are a few researchers that argue that a motif in other vast networks is not a functional unit but a by-product of the process of network generation[22]. We believe that a motif is an expression of a subjects’ adaptive behavior in the real university-industry collaboration network, although it is not a functional unit that can address certain information. The sets of a subjects’ adaptive behavior consist of the network’s generating behavior. We summarize the primary reasons for the network’s generating behavior reflected by the basic motifs in the university-industry collaboration network of the ocean energy industry in China using interviews in sample surveys from various subjects — and types of subjects — in that real network. The primary reasons are as follows.
1) Asymmetric information. Because there is asymmetric information when the subjects of heterogeneity build cooperative relationships in the university-industry collaboration network of the ocean energy industry, it leads to threats of adverse selection and moral hazard, which will increase the cost of collaboration. To decrease the negative impact originating with asymmetric information, the subjects in the university-industry collaboration network tend to form balanced cooperative relationships. These network’s generating behavior can be expressed as the 3-1 motif, 4-2 motif, etc.
2) Resources and cost constraints. The growth of the university-industry collaboration network is restrained by intellectual resources, mutual learning, reputation, funds and human capital. To grow substantially, the universities and enterprises in the university-industry collaboration network of the ocean energy industry tend to form dependent relationships to improve the innovation efficiency by clustering, which is intended to save resources and costs. These network’s generating behavior can be expressed as a 3-2 motif, 4-3 motif, etc. Note that the base of the cluster is stability, although the clustering effect is the reflection of the universities and enterprises’ adaptive behavior under the constraints of resources and costs. Thus, the network’s generating behavior of these subjects of heterogeneity reflects both their clustering relationships and their balanced relationships. These network’s generating behavior can be expressed as a 4-1 motif, 4-5 motif, etc.
3) Risk aversion. The university-industry collaboration network will encounter the negative effects of structural risk, policy risk and uncertainty of R&D in the process of evolution. To avoid these risks, subjects in the university-industry collaboration network prefer to build balanced relationships. These network’s generating behavior can be expressed as a 3-1 motif, 4-2 motif, etc.
4) Geographical constraints. Although the geographical region does not definitely hinder the construction of the university-industry cooperative relationships, it does influence the subjects’ preference with respect to selecting cooperative partners. Being bounded by the limitation of the geographic region, subjects in the same region or adjacent regions will prefer to select one another as cooperative partners. This preference attachment reflected in the motif is that the number of long-range connections decreases, whereas the density of the short-range connection is higher. These network’s generating behavior can thus be expressed as a 4-2 motif.
The constraints mentioned above can influence the choice of motifs for the university-industry collaboration network using the relational embeddedness and structural embeddedness, in addition to the formation and development of the network. Relational embeddedness signifies a collaboration based on former cooperative relationships, whereas structural embeddedness signifies that two subjects who had no former cooperative relationships have built new cooperative relationships using links to a third-party. Subjects in the university-industry collaboration network construct networks with different characteristics of structure by their interaction, which reflects the adaptation of the constraints as well as cooperative and organizational routines. The interaction is driven and strengthened by both relational and structural embeddedness.
3.2 Motif Classification
Based on the analysis of the three-node motifs and four-node motifs above, we can subdivide the motifs in the university-industry collaboration network of the ocean energy industry in China and its subnetworks into a fundamental motif and a characteristic motif. The fundamental motif is the inevitable basic structure existing in the formation of the network: the 3-1 motif, 4-1 motif and 4-5 motif are the fundamental motifs in these networks. The characteristic motif expresses the special network features. Although the characteristic motif is not the basic structure for the network formation, it is the module that can produce the network identity. The 4-2 motif is the characteristic motif for the ins-ins network, the uni-ins network and the entire network, and the 4-3 motif is the characteristic motif for the uni-com network.
An analysis of the combination mechanism of the ’3-4’ motif and the Anti-motif can reveal the diversity in the functions between the fundamental motifs and the characteristic motifs, and it can be used to explore the reasons for the diversity in the network’s generating behavior in different networks. Details are provided in Table 3.
“3-4”[a] nodes motifs and anti-motifs units of university-industry collaboration network of sea energy industry
| Motif | Anti-motif | ||||||
|---|---|---|---|---|---|---|---|
| 4-1 | 4-2 | 4-3 | 4-5 | 4-3 | 4-4 | 4-6 | |
| Networks | com-com | ins-ins | uni-com | ins-com | ins-com | ins-com | ins-com |
| ins-com | uni-ins | — | ins-ins | ins-ins | ins-ins | ins-ins | |
| ins-ins | whole net | — | uni-com | uni-ins | uni-com | uni-ins | |
| uni-com | — | — | uni-ins | uni-uni | uni-ins | whole net | |
| uni-ins | — | — | uni-uni | whole net | uni-uni | — | |
| uni-uni | — | — | whole net | — | whole net | — | |
| whole net | — | — | — | — | — | — | |
| Assembly charts |  | ||||||
By analyzing the 4-2 motif and the 4-3 motif (the two characteristic motifs), we determine that the ins-ins network, the uni-ins network and the entire network, which all contain the 4-2 motif as their characteristic motif, are networks with closer ties (more edges and higher < k >). However, the uni-com network containing the 4-3 motif has the structural features of a hub. Furthermore, the 4-2 motif consisted of four 3-1 motifs, which emphasizes the equality of the network function and the stability and closeness of the network relationships, whereas the 4-3 motif consisted of three 3-2 motifs, which emphasizes clustering of the culture hub nodes in the network to optimize the network function under the constraints of resources and costs. Therefore, the characteristics of the structure of the ins-ins network, the uni-ins network, the uni-com network and the entire network are derived from the fundamental motif and the characteristic motif. In particular, the characteristic motif is the key structure that leads to different characteristics of the networks.
The com-com network does not contain the 4-5 motif; instead, it contains only the 3-1 motif and the 4-1 motif. The lack of the 4-5 motif leads to the structure characteristics of weak stability and prominent clustering in the network. In addition, only the uni-com network has the 4-3 motif lead the uni-com network to generate the structural characteristic of a hub by strengthening the clustering effect.
Based on the above analysis, we find that subdividing the motifs into fundamental motifs and characteristic motifs can effectively distinguish the patterns of the network’s generating behavior. The fundamental motif illustrates that the behavior of clustering and balance among the subjects in the network is common and basal generating behavior for the university-industry collaboration network, whereas the characteristic motif expresses that the subnetworks consisting of subjects who are heterogeneous in nature have different requirements of structure and function in different stages of network evolution. The existence of the characteristic motif breaks the equilibrium relationships between clustering and stability and thus leads to different characteristics for network structure, which reflects the subjects’ self-organization and adaptive behavior in the networks.
3.3 Motif Combination
Motif combination reflects the process of the assembly of the motif and the Anti-motif contained in each network[15], which can reveal the differences and correlations of motifs in different levels in terms of motif construction. We can calculate the normalized strength distribution of the ‘3-4’ motif combination of the university-industry collaboration network of the ocean energy industry in China and its subnetworks.

Strength distribution of the ‘3-4’ motif combination
The result indicates that in Figure 3, which illustrates the method and strength of the three-node motifs combined with the four-node motifs, the rules of the ‘3-4’ motif combination in the subnetworks are the same as the entire network. The rule excluding the Anti-motif is that the 4-1 motif and the 4-3 motif predominate, and the 4-2 motif comes second, whereas the 4-5 motif is last. Therefore, for the university-industry collaboration network of the ocean energy industry in China, it tends to not generate close behavior with higher strength but generates balance and cluster behavior, which dominates the emergence of the network.
To test whether the consistency of the rule of motif combination limits the level of motif analysis, we examine the strength distribution of the ‘3-5’ motif combination in these networks. The result is provided in Figure 4. We note that the rules of the ‘3-5’ motif combination in these networks are consistent. Thus, the rule of motif combination in the networks exceeds the limit of levels of motif analysis and the relationships among the different levels of motifs corresponding to one another. The consistency of the underlying network structure patterns spanning various levels of the network structure indicates that the network subjects’ interaction directly determines the entire network structure. Therefore, the summary and distinctness of patterns for the network’s generating behavior can help deepen the understanding of the characteristics of the network structure. Furthermore, it can also be used to predict the evolution feature of the network.

Strength distribution of the ‘3-5’a motif combination a ‘3-5’ denotes the combination from three-node motifs to five node motifs.
Note that the 3-1 motif, which is the structure of the balanced triad, indicates a stable structure, whereas the 3-2 motif, as the structure of the unbalanced triad, indicates the cluster structure. After analyzing the detailed structures among the 3-1 motif, 4-1 motif and 4-5 motif, which are three fundamental motifs, we find that all the fundamental motifs have a 3-1 motif, but the difference is the number of 3-1 motifs. Because both the 4-1 motif and the 4-5 motif have a 3-1 motif, both motifs have a stable structure. Furthermore, the 4-5 motifs have a larger number of 3-1 motifs than the 4-1 motif; therefore, the stability of the structure of the 4-5 motif is greater than that of the 4-1 motif. Additionally, the number of 3-2 motifs held in both the 4-1 motif and the 4-5 motif is greater than or equal to the number of 3-1 motifs, which indicates that these two motifs have the clustering characteristic, and the strength of clustering is greater than the stability. In fact, the essence of the cluster is the result of the preferential attachment. When the growth mechanism of the BA scale-free network is growth and preferential attachment[23], the same mechanism between the BA scale-free network and the university-industry collaboration network of the ocean energy industry in China and its subnetworks emphasizes clustering; however, the difference is that the latter emphasizes stability, which is absent in the former BA scale-free network. Thus, the 3-1 motif, 4-1 motif and 4-5 motif, which are the fundamental motifs, indicate that the subjects in that university-industry collaboration network tend to cluster and balance observably.
3.4 Motif Clustering
We analyze the strength of the motifs in the networks based on the statistical significance of the Z value, which can avoid the information interference when calculating the absolute amounts of motif density, and thus the motif clustering analysis of the university-industry collaboration network of the ocean energy industry in China and its subnetworks can be conducted using SRP.
The SRP of the networks is presented in Figure 5. We analyze the SRP values for each network using the Pearson correlation coefficient to distinguish the types of networks. The detailed similarity coefficient and clustering results are represented in Figure 6. There are three types of networks in Figure 6. Type 1 includes the com-com network and the uni-com network, type 2 includes the ins-com network and the uni-uni network and type 3 includes the ins-ins network, the uni-ins network and the entire network.

Distribution of SRP
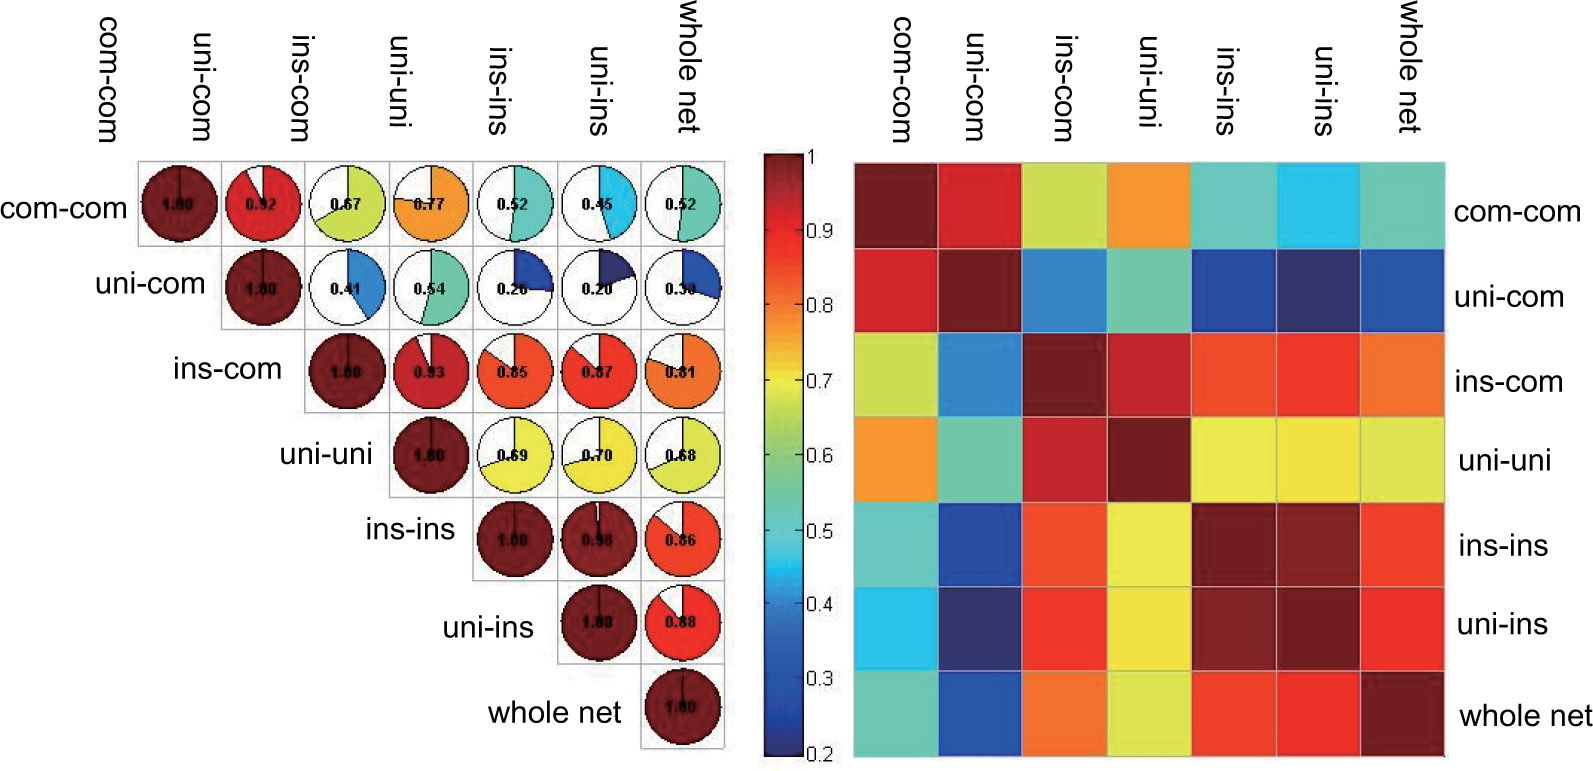
Similarity coefficient and clustering result
Because the type of motif strength in each type of network reflects the difference in the network’s generating behavior, it can effectively evaluate the quality of the network using motif clustering based on the types of motif strength. Figure 6 indicates that the correlation coefficient of the SRP value of the two networks contained in type 1 is higher than 0.92; the 4-1 motif is a strong motif, whereas the 4-3 motif and the 4-5 motif are weak motifs. The correlation coefficient of the SRP value for the two networks contained in type 2 is higher than 0.93; the 4-1 motif and the 4-5 motif are strong motifs. The correlation coefficient of the SRP value for the three networks contained in type 3 is higher than 0.86; the 4-1 motif, 4-2 motif and 4-5 motif are strong motifs. The number of strong motifs signifies the integrity of the network structure. Type 3 indicates a network with a better structure because the types of strong motifs in type 3 cover that in type 1 and type 2. Therefore, the ins-ins network, the uni-ins network and the entire network are networks with better structures.
4 Conclusions
Researching the university-industry collaboration network’s generating behavior is the basis for constructing and optimizing a network. Additionally, the key to analyzing a network’s generating behavior is to account for and cope with the subjects’ heterogeneity and consider their dynamic interaction and the network effect. Consequently, we use the university-industry collaboration network of the ocean energy industry in China as a case study to examine the network’s generating behavior using the method of motif analysis from the medium perspective.
The results indicate that the subjects’ interaction in the university-industry collaboration network, which is flexible under the relevant constraints and reflects the collaboration and organization routines, can construct networks with different characteristics under the drive and reinforce the behavior of relational and structural embeddedness. This result indicates that the interaction can directly determine the structure of the network. Thus, summarizing and distinguishing the network’s generating behavior can deepen the understanding of the university-industry collaboration network structure and help predict the characteristics of subsequent network evolution. Furthermore, we can effectively distinguish patterns in the network’s generating behavior by subdividing the motifs into fundamental and characteristic motifs. The types of motif combination in each type of network can reflect the diversity of the network’s generating behavior. Additionally, motif clustering analysis can be used to evaluate the network quality based on the diversity in the network’s generating behavior.
Because we lack more substantial longitudinal network data, we cannot analyze the dynamic characteristics of the university-industry collaboration network’s generating behavior from the perspective of network evolution. Thus, collecting additional university-industry collaboration network data for high-tech industries and analyzing the dynamic characteristics of the network’s generating behavior combined with network evolution and motif characteristics will provide us with even more profound insights.
References
[1] Thorgren S, Wincent J, Oqvist D. Designing interorganizational networks for innovation: An empirical examination of network configuration, formation and governance. Journal of Engineering and Technology Management, 2009, 26(3): 148–166.10.1016/j.jengtecman.2009.06.006Search in Google Scholar
[2] Perkmann M, Neely A, Walsh K. How should firms evaluate success in university-industry alliances: A performance measurement system. R&D Management, 2011, 41(2): 202–216.10.1111/j.1467-9310.2011.00637.xSearch in Google Scholar
[3] Hyundo C, Laura D A. The role of the complementary sector and its relationship with network formation and government policies in emerging sectors: The case of solar photovoltaics between 2001 and 2009. Technological Forecasting and Social Change, 2014, 82(3): 80–94.10.1016/j.techfore.2013.06.002Search in Google Scholar
[4] Este P D, Perkmann M. Why do academics engage with industry: The entrepreneurial university and individual motivations. The Journal of Technology Transfer, 2011, 36(3): 316–339.10.1007/s10961-010-9153-zSearch in Google Scholar
[5] Giuliani E, Arza V. What drives the formation of ‘valuable’ university-industry linkages: Insights from the wine industry. Research Policy, 2009, 38(6): 906–921.10.1016/j.respol.2009.02.006Search in Google Scholar
[6] Yang Z, Qixia L. Innovation pattern analysis of the industry-university-research cooperation. Information Technology in Medicine and Education, ITME, Hokodate, Hokkaido, 2012, 1: 274–277.Search in Google Scholar
[7] Guan J, Zhao Q. The impact of university-industry collaboration networks on innovation in nanobiopharmaceuticals. Technological Forecasting and Social Change, 2013, 80(7): 1271–1286.10.1016/j.techfore.2012.11.013Search in Google Scholar
[8] Klenk N L, Hickey, G M, Maclellan J I. Evaluating the social capital accrued in large research networks: The case of the sustainable forest management network (1995–2009). Social Studies of Science, 2010, 40(6): 931–960.10.1177/0306312710374130Search in Google Scholar
[9] Jin J, Wu S, Chen J. International university-industry collaboration to bridge R&D globalization and national innovation system in China. Journal of Knowledge-Based Innovation in China, 2011, 3(1): 5–14.10.1108/17561411111120837Search in Google Scholar
[10] Rui P, Fang Y, The evolution of industry-university-institute cooperation innovation networks and the function of the R&D management office during the evolution. Science Research Management, 2008(S1): 38–41 (in Chinese).Search in Google Scholar
[11] Stolwijk C, Ortt J R, den Hartigh E. The joint evolution of alliance networks and technology: A survey of the empirical literature. Technological Forecasting and Social Change, 2013, 80(7): 1287–1305.10.1016/j.techfore.2012.11.012Search in Google Scholar
[12] Wilson J, Hynes N. Co-evolution of firms and strategic alliances: Theory and empirical evidence. Technological Forecasting and Social Change, 2009, 76(5): 620–628.10.1016/j.techfore.2008.08.005Search in Google Scholar
[13] Milo R, Shen-Orr S, Itzkovitz S, et al. Network motifs: Simple building blocks of complex networks. Science, 2002, 298(5594): 824–827.10.1515/9781400841356.217Search in Google Scholar
[14] Kashtan N, Itzkovitz S, Milo R, et al. Topological generalizations of network motifs. Physical Review E, 2004, 70(3): 31909.10.1103/PhysRevE.70.031909Search in Google Scholar PubMed
[15] Miao L L, Han C F, Liu L, et al. Using motif to characterize building block of scientific collaboration networks. Studies in Science of Science, 2012, 30(10): 1468–1475 (in Chinese).Search in Google Scholar
[16] Shi X, Wu L, Yang H. Scientific collaboration network evolution model based on motif emerging. Proc. 9rd Conf. Young Computer Scientists, ICYCS, Hunan, 2008: 2748–2752.10.1109/ICYCS.2008.31Search in Google Scholar
[17] Salehi M, Rabiee H R, Jalili M. Motif structure and cooperation in real-world complex networks. Physica A: Statistical Mechanics and Its Applications, 2010, 389(23): 5521–5529.10.1016/j.physa.2010.08.001Search in Google Scholar
[18] Wu G, Harrigan M, Cunningham P. Characterizing wikipedia pages using edit network motif profiles. Proc. 3rd Conf. Proceedings of the 3rd International Workshop on Search and Mining User-Generated Contents, ACM, 2011: 45–52.10.1145/2065023.2065036Search in Google Scholar
[19] Milo R, Itzkovitz S, Kashtan N, et al. Superfamilies of evolved and designed networks. Science, 2004, 303(5663): 1538–1542.10.1126/science.1089167Search in Google Scholar PubMed
[20] Liang L, Chuan-Feng H, Wei-Sheng X. Motifs and superfamilies in critical infrastructure engineering network. Systems Engineering — Theory & Practice, 2013, 33(5): 1335–1344 (in Chinese).Search in Google Scholar
[21] Wernicke S, Rasche F. FANMOD: A tool for fast network motif detection. Bioinformatics, 2006, 22(9): 1152–1153.10.1093/bioinformatics/btl038Search in Google Scholar PubMed
[22] Lee T I, Rinaldi N J, Robert F, et al. Transcriptional regulatory networks in Saccharomyces cerevisiae. Science, 2002, 298(5594): 799–804.10.1126/science.1075090Search in Google Scholar PubMed
[23] Barabasi A, Albert R. Emergence of scaling in random networks. Science, 1999, 286(5439): 509–512.10.1515/9781400841356.349Search in Google Scholar
© 2015 Walter de Gruyter GmbH, Berlin/Boston
Articles in the same Issue
- Start-Up and Acceleration Profile for Protected Left-Turn Vehicles at Signalized Intersections
- Construction and Practice of the Optimal Smooth Semi-Supervised Support Vector Machine
- Trade Potential of China’s Export to ASEAN: The Gravity Model Using New Economic Mass Proxies
- A Method of Power Supply Mode Selection for Urban Distribution Network Planning Based on Association Rules
- Generating Behavior in the University-Industry Collaboration Network: Based on the Configuration of Motifs
- Research on the Evaluation of Enterprises’ Green Growth Efficiency Based on DEMATEL-DEA
- Power of Moran’s I Test for Spatial Dependence in Panel Data Models with Time Varying Spatial Weights Matrices
- Linear Quadratic Nash Game of Stochastic Singular Time-Delay Systems with Multiple Decision Makers